Automotive Electric Actuator Market Size, Share, and Forecast Outlook 2025 to 2035

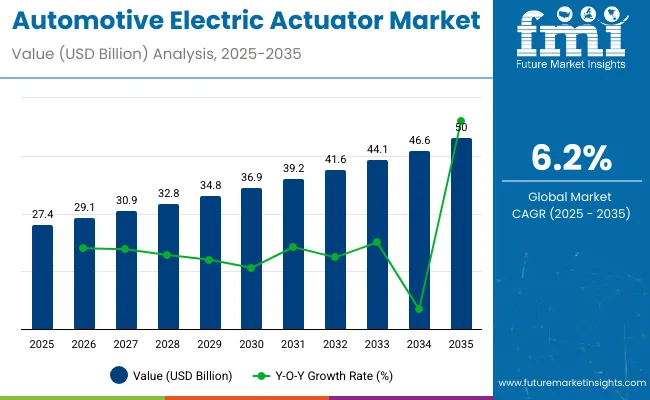
The automotive electric actuator market is valued at USD 27.4 billion in 2025 and is likely to reach around USD 50 billion by 2035, reflecting a CAGR of 6.2%. The multiplying factor over the ten-year period is about 1.82x, indicating that the 2035 market will be 1.82 times the 2025 base.

Quick stats of Global Automotive Electric Actuator Market

  • Automotive Electric Actuator Market Size (2025): USD 27.4 Billion
  • Projected Automotive Electric Actuator Market Size (2035): USD 50 Billion
  • Forecast CAGR of Automotive Electric Actuator Market (2025 to 2035): 6.2 %
  • Leading Segment of Automotive Electric Actuator Market (2025): Linear Actuators
  • Key Growth Regions of Automotive Electric Actuator Market: China, Germany, United States, Japan
  • Top Key Players of Automotive Electric Actuator Market: BorgWarner, Robert Bosch, Denso, ZF Friedrichshafen

Automotive Electric Actuator Market

Metric Value
Industry Size (2025E) USD 27.4 billion
Industry Value (2035F) USD 50 billion
CAGR (2025 to 2035) 6.2%

Initial growth is supported by wider adoption of electric actuators in steering, braking, and transmission systems, particularly in electric and hybrid vehicles. Technological enhancements, tighter emission standards, and demand for better vehicle performance drive faster uptake during the early phase.

Towards 2035, growth slows as adoption levels off in established segments and conventional vehicles integrate fewer new actuator solutions. Continued expansion is fueled by emerging markets, broader deployment in advanced driver-assistance systems, and replacement of mechanical systems with electric actuators. The acceleration and deceleration pattern, together with a multiplying factor of 1.82x, illustrates early momentum followed by steady long-term growth, providing manufacturers and suppliers measurable opportunities to increase production, develop technology, and strengthen market positioning over the decade.

The automotive electric actuator market is influenced by five parent markets with varying contributions. Automotive electronics accounts for approximately 40%, supplying sensors, controllers, and powertrain modules. Automotive components contribute around 25%, integrating actuators into braking, steering, HVAC, and transmission systems. The global automotive market represents about 15%, driving adoption through new vehicle production and fleet upgrades.
Industrial automation and robotics account for roughly 10%, enabling precision manufacturing and testing of actuators. Information and communication technology (ICT) contributes nearly 10%, supporting software, connectivity, and vehicle control systems. Combined, these markets enable the widespread adoption of electric actuators in modern vehicles.

Recent trends in the industry focus on electrification, integration, and strategic collaborations. Key players such as Bosch, Denso, Continental, and Valeo are developing energy-efficient actuators for braking, steering, and HVAC systems. Integration with electric vehicles and advanced driver assistance systems (ADAS) is accelerating adoption. Smart actuators with IoT connectivity allow predictive maintenance, remote monitoring, and performance optimization.

Companies are forming partnerships with automakers to expand EV platforms and autonomous mobility solutions. Lightweight design, energy efficiency, and precision control technologies are driving innovation, improving vehicle performance, safety, and reliability while meeting regulatory and consumer demands.

Top Automotive Electric Actuator Market Dynamics

The automotive electric actuator industry is growing due to increasing integration of electronic control systems in modern vehicles. Global installation exceeded 45 million units in 2024, with Europe and Asia Pacific accounting for more than 60% of the total.

Electric actuators are increasingly used in throttle control, braking systems, seat adjustment, and HVAC systems, replacing traditional mechanical and hydraulic components. Advancements in precision, response time, and compact design are improving vehicle performance and safety. Growth of electric and hybrid vehicles, coupled with stricter emission regulations, is driving actuator adoption. Expansion of passenger car production and commercial vehicle fleets further supports demand.

Driving Force Demand for Enhanced Vehicle Control and Safety

Rising consumer expectations for vehicle safety, comfort, and performance are key drivers. Electric actuators improve braking, throttle, and steering response, reducing stopping distance by 8-10% compared to traditional systems. OEMs increasingly integrate actuators into advanced driver assistance systems and EVs to meet regulatory standards.

Asia Pacific leads adoption with a 7-9% annual growth rate, driven by increasing vehicle production and urban mobility solutions. Improved actuator precision reduces maintenance requirements by 15%, enhancing system reliability. The shift toward electronic systems also reduce vehicle weight, supporting fuel efficiency and lowering emissions. Adoption in commercial vehicles, buses, and trucks is expanding to improve fleet operational efficiency.

  • Electric actuators reduce stopping distance by 8-10%.
  • Asia Pacific annual growth ranges 7-9% due to vehicle production.
  • Precision improvements reduce maintenance by 15%.

Growth Avenue Technological Advancements and EV Integration

Technological innovation is expanding actuator applications across throttle, brake-by-wire, HVAC, and seat positioning systems. Electric actuators in EVs enhance energy efficiency, improving vehicle range by up to 5%. Over-the-air software updates optimize actuator performance and reduce system downtime by 10-12%. Integration with AI-driven systems allows predictive maintenance and smoother vehicle operation.

Compact and lightweight designs improve engine compartment utilization and reduce overall vehicle weight by 3-5%. Modular actuator platforms enable OEMs to standardize components across multiple vehicle segments, lowering production complexity and cost. Increased adoption in hybrid and electric vehicles drives market growth, especially in regions with strong EV policies and incentives.

  • EV integration improves vehicle range by up to 5%.
  • Software updates reduce system downtime by 10-12%.
  • Modular platforms lower production complexity and cost.

Emerging Trend Expansion in Asia Pacific and Commercial Vehicles

Asia Pacific dominates adoption due to rising passenger vehicle production, EV incentives, and growing commercial vehicle fleets. Annual growth in China, India, and Japan ranges 6-9%. Commercial vehicles increasingly rely on electric actuators for throttle control, braking, and HVAC, improving fuel efficiency by 4-6%. Integration with fleet management systems allows predictive maintenance, reducing downtime by 12-15%.

Urban mobility solutions and smart transportation projects support actuator adoption in buses, taxis, and delivery vehicles. Compact actuator designs facilitate installation in space-constrained vehicles while meeting safety and performance standards. Manufacturers are localizing production to reduce lead times by 10-15% and enhance regional supply chain efficiency.

  • Asia Pacific annual growth ranges 6-9% in key markets.
  • Commercial vehicles improve fuel efficiency by 4-6% using electric actuators.
  • Localized production reduces lead times by 10-15%.

Market Challenge High Cost and Integration Complexity

Advanced electric actuators require significant investment, with unit prices ranging from USD 150 to 800 depending on application and vehicle type. Integration into existing mechanical systems can add 10-12% to manufacturing costs. Actuators require precise calibration to maintain performance, with improper setup reducing efficiency by 5-8%. Maintenance, software updates, and sensor alignment add 7-10% to operational expenses annually.

Retrofitting older vehicles is challenging due to space constraints and compatibility issues. Manufacturers must balance cost, reliability, and regulatory compliance to ensure adoption, especially in regions with strict safety standards and emission regulations. Effective supply chain management and local production are key to controlling costs.

  • Unit prices range between USD 150 and 800 depending on application.
  • Improper calibration reduces actuator efficiency by 5-8%.
  • Maintenance and updates add 7-10% annually to operational costs.

Analyzing Automotive Electric Actuator Market by Top Investment Segments

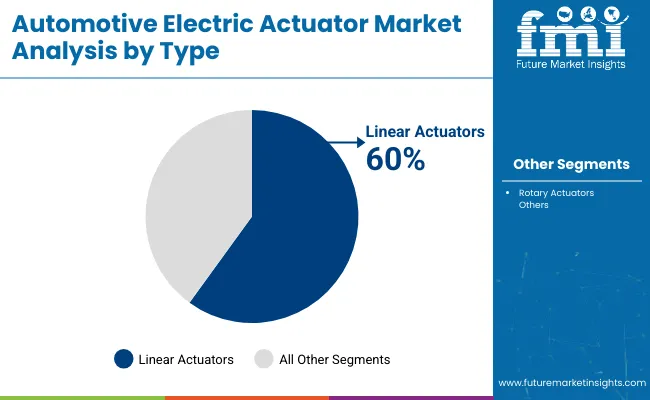
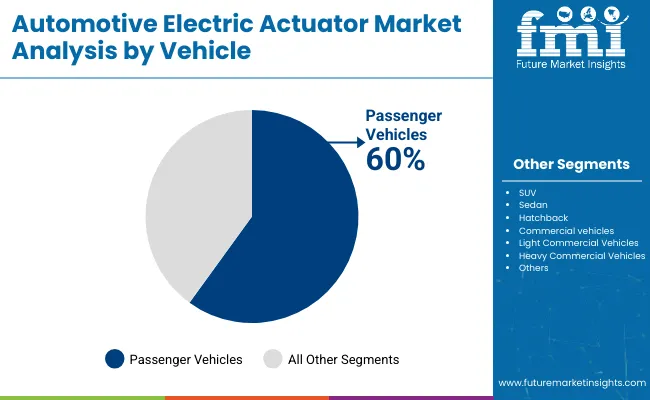
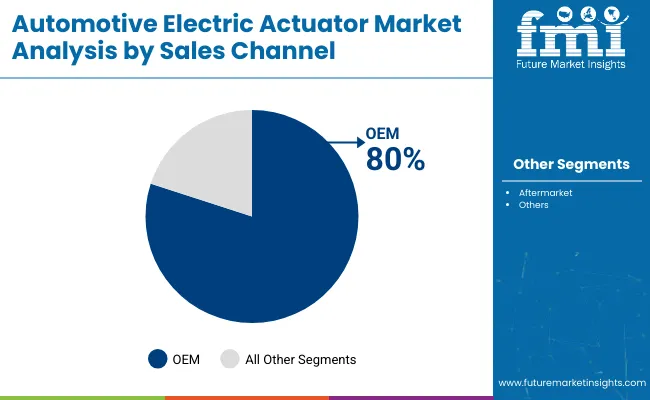
The automotive electric actuator market is primarily driven by linear actuators, passenger vehicles, and OEM channels, while throttle and brake applications account for high usage. Linear actuators hold 60% share due to applications in braking, HVAC, and door lock systems. Passenger vehicles contribute 60% of installations, highlighting strong adoption in cars, SUVs, and sedans. OEM sales dominate 80% of the market, reflecting manufacturer control over integration and quality.
Linear Actuators Lead Adoption in 2025

Automotive Electric Actuator Market By Type

Linear actuators account for 60% of the market, widely used in braking, HVAC, throttle, and door lock systems. Bosch, Denso, and Continental provide units with precise movement, high reliability, and compact design. Their efficiency and compatibility with passenger and commercial vehicles drive adoption. Technological improvements in torque control and response time enhance system performance. Passenger cars benefit from integration in comfort and safety systems, while light commercial vehicles use linear actuators in automated operations. Heavy commercial vehicles increasingly adopt them for braking and HVAC control.

  • 60% of electric actuators are linear units globally
  • Torque and response improvements enhance performance and safety
  • Installed in braking, HVAC, and door lock applications

Rotary Actuators Capture 40% Market Share

Rotary actuators hold 40% of the market, used in headlights, mirrors, sunroof, and EGR systems. Valeo, Aisin, and Nidec supply rotary actuators with precise angular control and energy-efficient designs. They enable headlight adjustment, mirror positioning, and exhaust gas recirculation. Passenger vehicles benefit from mirror and lighting functions, while SUVs and commercial vehicles use them in sunroof and HVAC systems. Growth in EVs and connected vehicles supports demand. Rotary actuators complement linear actuators by offering rotational movement in compact assemblies, making them essential for specialized automotive applications.
  • 40% of market demand is for rotary actuators
  • Angular precision improves lighting and mirror functions
  • Energy-efficient designs reduce power consumption

Passenger Vehicles Dominate 60% Of Installations

Automotive Electric Actuator Market By Vehicle

Passenger vehicles hold 60% share, reflecting high demand in cars, SUVs, and sedans. Electric actuators enhance throttle control, braking, HVAC operation, and seat adjustment. Bosch, Denso, and Continental deliver solutions optimized for dashboard integration and electronic systems. SUVs account for 25% and sedans 15%, highlighting diverse usage in comfort and safety systems. Hatchbacks use compact actuators for space efficiency. Commercial vehicles account for 40%, with light commercial at 25% and heavy commercial at 15%, applied in braking, HVAC, and door lock systems to improve operational efficiency.
  • Passenger vehicles represent 60% of actuator adoption
  • Actuators enhance comfort, safety, and electronic control
  • Commercial vehicles utilize actuators for braking and HVAC

OEM Channels Control 80% Of The Market

Automotive Electric Actuator Market By Sales

OEM sales cover 80% of the market, reflecting direct integration and quality control. Bosch, Denso, Continental, and Aisin collaborate with automakers to ensure compatibility, reliability, and system calibration. Aftermarket sales account for 20%, mainly for replacement or specialized upgrades. OEM dominance ensures consistent deployment across passenger and commercial vehicles, supports advanced electronic control systems, and enables integration with EVs and connected vehicle technologies. Direct manufacturer influence accelerates adoption, improves system reliability, and drives standardization across multiple automotive segments globally.
  • 80% of electric actuators are sold through OEM channels
  • OEM integration ensures quality and system compatibility
  • Aftermarket accounts for 20% for replacements or upgrades

Top Countries Advancing Automotive Electric Actuator Market

Automotive Electric Actuator Market By Country

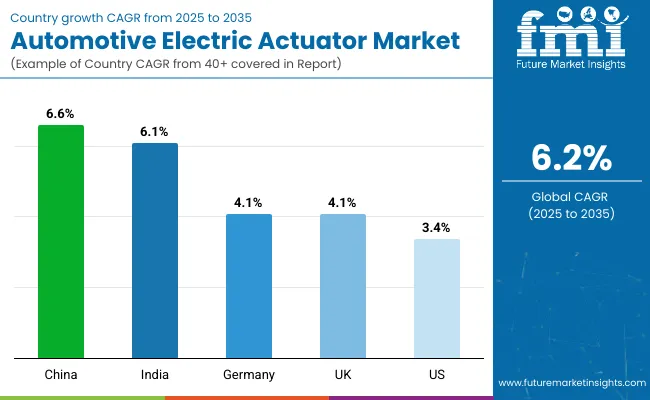
The global market is projected to grow at a CAGR of 4.1% from 2025 to 2035. China leads with 6.6%, exceeding the global rate by +61%, driven by large-scale vehicle automation and BRICS-led mobility initiatives. India follows at 6.1%, or +49% above the global benchmark, supported by ASEAN-linked collaborations and rising demand for advanced vehicle components.

Germany, the United Kingdom, and the global average all align at 4.1%, reflecting steady adoption across OECD markets through incremental integration of electric actuator systems. The United States records the slowest growth at 3.4%, -17% below the global level, influenced by established automotive infrastructure and gradual replacement cycles. The BRICS economies demonstrate higher adoption rates, while OECD markets advance at a measured, consistent pace.

Market Growth Analysis of Automotive Electric Actuator in China

The automotive electric actuator market in China is expanding at a CAGR of 6.6%, fueled by increasing production of electric and hybrid vehicles and growing adoption of advanced driver-assistance systems. Domestic manufacturers are focusing on high-precision actuators for throttle, brake, and steering systems to meet performance and safety standards.

Integration with vehicle control modules and AI-driven systems enhances operational efficiency and reliability. Government support for electric mobility and investments in automotive component manufacturing further stimulate market growth. The demand is concentrated in major automotive hubs including Shanghai, Guangzhou, and Chongqing.

  • Over 60% of new electric vehicles equipped with electric actuators by 2026
  • AI-integrated actuator systems projected to improve response time by 15%
  • Investment in actuator R&D expected to increase 18% annually

Automotive Electric Actuator Market Expansion Outlook in India

The automotive electric actuator market in India is growing at a CAGR of 6.1%, supported by rising production of passenger vehicles and growing focus on electrification. Manufacturers are introducing cost-effective actuators for throttle control, braking, and steering systems to meet evolving vehicle standards. Adoption is driven by increased demand for vehicles with improved fuel efficiency and advanced driver-assistance features. Integration with vehicle electronic control units is becoming standard across mid-range and premium vehicles. Local suppliers are expanding production capacity to meet rising domestic demand.

  • Over 45% of new vehicles incorporating electric actuators by 2026
  • Mid-range vehicle adoption of AI-driven actuators projected to grow 20%
  • Production capacity of domestic actuator manufacturers expected to rise 15%

Automotive Electric Actuator Market Forecast in Germany

The demand of automotive electric actuator in Germany is growing at a CAGR of 4.1%, influenced by the presence of a strong automotive sector and advanced vehicle technology adoption. German manufacturers are developing actuators with high precision, durability, and integration for autonomous and semi-autonomous vehicles. The market is also driven by fleet operators upgrading vehicles with enhanced braking, steering, and throttle actuators. Energy-efficient actuator designs that improve overall vehicle performance are increasingly deployed. Germany’s focus on automotive innovation ensures steady demand for advanced electric actuators.

  • Fleet operators upgrading actuators in over 30% of commercial vehicles by 2026
  • Energy-efficient actuator adoption projected to improve fuel efficiency by 10%
  • Integration with autonomous driving modules expected to rise 18%

Automotive Electric Actuator Market Growth Outlook in the United Kingdom

The automotive electric actuator industry in the United Kingdom is expanding at a CAGR of 4.1%, driven by the adoption of electric vehicles and modern driver-assistance systems. Manufacturers are providing actuators optimized for braking, throttle, and steering systems, supporting improved vehicle control. Integration with electronic control units enhances safety and performance. Fleet operators are also incorporating actuators to optimize commercial vehicle efficiency and reduce operational costs. Growth is supported by the UK government’s initiatives to support electrification and smart vehicle technologies.

  • Electric actuator adoption in new electric vehicles expected to reach 50% by 2026
  • Fleet efficiency improvements projected at 12% due to actuator integration
  • Throttle and steering actuator replacement cycles expected to reduce maintenance costs by 15%

Automotive Electric Actuator Market Growth Analysis in the United States

The demand of automotive electric actuator in the United States is growing at a CAGR of 3.4%, influenced by the expansion of electric and hybrid vehicle production. Advanced braking, steering, and throttle actuators are increasingly standard in mid-range and premium vehicles. Fleet operators adopt actuators to improve vehicle efficiency, reduce maintenance downtime, and enhance safety. Manufacturers focus on actuator designs that integrate with electronic control units for better performance and predictive diagnostics. Continuous technological upgrades in vehicles support the gradual expansion of the actuator market.
  • Over 55% of premium vehicles expected to include electric actuators by 2026
  • Fleet adoption of integrated actuator systems projected to increase 15%
  • Predictive maintenance through actuator monitoring expected to reduce downtime by 12%

Leading Automotive Electric Actuator Manufacturers, Suppliers, Distributors

Automotive Electric Actuator Market By Company

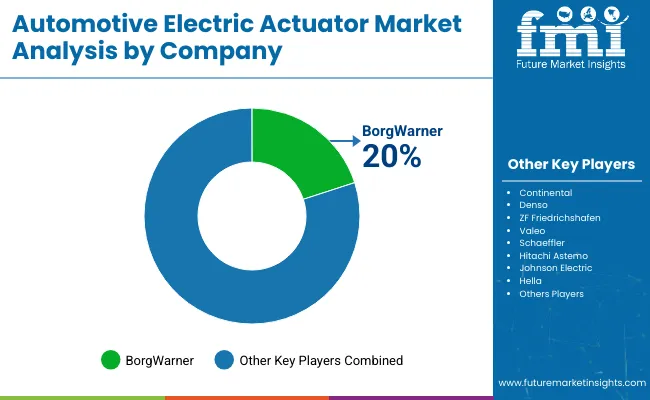
The market is shaped by several established players and emerging companies, each employing strategies to strengthen their market presence. BorgWarner focuses on expanding its product portfolio with high-performance actuators for throttle control and transmission systems, while Continental invests in research and development to improve precision and durability across a range of actuator applications. Denso emphasizes collaborations with automakers to integrate electric actuators in hybrid and electric vehicles, enhancing efficiency and reliability.

Hella has recently launched compact actuator models for climate control and door systems, highlighting its approach of addressing specific vehicle needs. Hitachi Astemo develops actuators for braking and steering systems, combining quality with wide compatibility to attract global automotive clients.

Other key players, including Johnson Electric, Schaeffler, Valeo, and ZF Friedrichshafen, are actively enhancing their offerings through product upgrades and strategic partnerships. Johnson Electric focuses on miniaturized actuators for vehicle comfort systems, while Schaeffler invests in actuators for powertrain applications.

Valeo has introduced modular actuator designs to simplify assembly and maintenance, and ZF Friedrichshafen emphasizes actuator solutions for automated transmission and chassis systems. Collectively, these companies strengthen their presence through targeted product launches, R&D investments, and collaborations with vehicle manufacturers, ensuring they remain competitive in the evolving market.

Leading Players

  • BorgWarner
  • Continental
  • Denso
  • ZF Friedrichshafen
  • Valeo
  • Schaeffler
  • Hitachi Astemo
  • Johnson Electric
  • Hella

Report Scope

Report Attributes Details
Market Size (2025) USD 27.4 billion
Projected Market Size (2035) USD 50 billion
CAGR (2025 to 2035) 6.2%
Base Year for Estimation 2024
Historical Period 2020 to 2024
Projections Period 2025 to 2035
Quantitative Units USD billion for value
Types Analyzed (Segment 1) Linear actuators, Rotary actuators
Applications Analyzed (Segment 2) Throttle, Brake, HVAC, Headlight, EGR, Door Lock, Power Seat, Sunroof, Mirror
Vehicle Types Analyzed (Segment 3) Passenger Vehicles (Hatchback, Sedan, SUV), Commercial Vehicles (Light Commercial Vehicles, Heavy Commercial Vehicles)
Sales Channels Analyzed (Segment 4) OEM, Aftermarket
Regions Covered North America; Europe; Asia Pacific; Latin America; Middle East & Africa
Countries Covered United States, Canada, Germany, United Kingdom, France, Italy, China, Japan, India, Brazil, Mexico, UAE, South Africa
Key Players Influencing the Market BorgWarner, Continental, Denso, ZF Friedrichshafen, Valeo, Schaeffler, Hitachi Astemo, Johnson Electric, Hella
Additional Attributes Dollar sales by actuator type and vehicle application, demand dynamics across passenger, commercial, and electric vehicles, regional adoption trends, innovation in high-torque, compact, and energy-efficient designs, environmental impact of emissions reduction, and emerging uses in ADAS and electric powertrains.

Automotive Electric Actuator Market Analyzed by Key Investment Segments 

By Type:

  • Linear actuators
  • Rotary actuators

By Application:

  • Throttle
  • Brake
  • HVAC
  • Headlight
  • EGR
  • Door lock
  • Power seat
  • Sunroof
  • Mirror

By Vehicle:

  • Passenger vehicles
  • Hatchback
  • Sedan
  • SUV
  • Commercial vehicles
  • Light Commercial Vehicles (LCV)
  • Heavy Commercial Vehicles (HCV)

By Sales Channel:

  • OEM
  • Aftermarket

By Region:

  • North America
  • Europe
  • Asia Pacific
  • Latin America
  • Middle East and Africa

Table of Content

  1. Executive Summary
    • Global Market Outlook
    • Demand-side Trends
    • Supply-side Trends
    • Technology Roadmap Analysis
    • Analysis and Recommendations
  2. Market Overview
    • Market Coverage / Taxonomy
    • Market Definition / Scope / Limitations
  3. Market Background
    • Market Dynamics
      • Drivers
      • Restraints
      • Opportunity
      • Trends
    • Scenario Forecast
      • Demand in Optimistic Scenario
      • Demand in Likely Scenario
      • Demand in Conservative Scenario
    • Opportunity Map Analysis
    • Product Life Cycle Analysis
    • Supply Chain Analysis
      • Supply Side Participants and their Roles
        • Producers
        • Mid-Level Participants (Traders/ Agents/ Brokers)
        • Wholesalers and Distributors
      • Value Added and Value Created at Node in the Supply Chain
      • List of Raw Material Suppliers
      • List of Existing and Potential Buyer’s
    • Investment Feasibility Matrix
    • Value Chain Analysis
      • Profit Margin Analysis
      • Wholesalers and Distributors
      • Retailers
    • PESTLE and Porter’s Analysis
    • Regulatory Landscape
      • By Key Regions
      • By Key Countries
    • Regional Parent Market Outlook
    • Production and Consumption Statistics
    • Import and Export Statistics
  4. Global Market Analysis 2020 to 2024 and Forecast, 2025 to 2035
    • Historical Market Size Value (USD Billion) & Volume (Units) Analysis, 2020 to 2024
    • Current and Future Market Size Value (USD Billion) & Volume (Units) Projections, 2025 to 2035
      • Y-o-Y Growth Trend Analysis
      • Absolute $ Opportunity Analysis
  5. Global Market Pricing Analysis 2020 to 2024 and Forecast 2025 to 2035
  6. Global Market Analysis 2020 to 2024 and Forecast 2025 to 2035, By Vehicle Type
    • Introduction / Key Findings
    • Historical Market Size Value (USD Billion) & Volume (Units) Analysis By Vehicle Type, 2020 to 2024
    • Current and Future Market Size Value (USD Billion) & Volume (Units) Analysis and Forecast By Vehicle Type, 2025 to 2035
      • Passenger vehicles
      • SUV
      • Sedan
      • Hatchback
      • Commercial vehicles
      • Light Commercial Vehicles
      • Heavy Commercial Vehicles
    • Y-o-Y Growth Trend Analysis By Vehicle Type, 2020 to 2024
    • Absolute $ Opportunity Analysis By Vehicle Type, 2025 to 2035
  7. Global Market Analysis 2020 to 2024 and Forecast 2025 to 2035, By Sales Channel
    • Introduction / Key Findings
    • Historical Market Size Value (USD Billion) & Volume (Units) Analysis By Sales Channel, 2020 to 2024
    • Current and Future Market Size Value (USD Billion) & Volume (Units) Analysis and Forecast By Sales Channel, 2025 to 2035
      • OEM
      • Aftermarket
    • Y-o-Y Growth Trend Analysis By Sales Channel, 2020 to 2024
    • Absolute $ Opportunity Analysis By Sales Channel, 2025 to 2035
  8. Global Market Analysis 2020 to 2024 and Forecast 2025 to 2035, By Type
    • Introduction / Key Findings
    • Historical Market Size Value (USD Billion) & Volume (Units) Analysis By Type, 2020 to 2024
    • Current and Future Market Size Value (USD Billion) & Volume (Units) Analysis and Forecast By Type, 2025 to 2035
      • Linear actuators
      • Rotary actuators
    • Y-o-Y Growth Trend Analysis By Type, 2020 to 2024
    • Absolute $ Opportunity Analysis By Type, 2025 to 2035
  9. Global Market Analysis 2020 to 2024 and Forecast 2025 to 2035, By Application
    • Introduction / Key Findings
    • Historical Market Size Value (USD Billion) & Volume (Units) Analysis By Application, 2020 to 2024
    • Current and Future Market Size Value (USD Billion) & Volume (Units) Analysis and Forecast By Application, 2025 to 2035
      • Throttle
      • Brake
      • HVAC
      • Headlight
      • EGR
      • Door lock
      • Power seat
      • Sunroof
      • Mirror
    • Y-o-Y Growth Trend Analysis By Application, 2020 to 2024
    • Absolute $ Opportunity Analysis By Application, 2025 to 2035
  10. Global Market Analysis 2020 to 2024 and Forecast 2025 to 2035, By Region
    • Introduction
    • Historical Market Size Value (USD Billion) & Volume (Units) Analysis By Region, 2020 to 2024
    • Current Market Size Value (USD Billion) & Volume (Units) Analysis and Forecast By Region, 2025 to 2035
      • North America
      • Latin America
      • Western Europe
      • Eastern Europe
      • East Asia
      • South Asia & Pacific
      • Middle East and Africa
    • Market Attractiveness Analysis By Region
  11. North America Market Analysis 2020 to 2024 and Forecast 2025 to 2035, By Country
    • Historical Market Size Value (USD Billion) & Volume (Units) Trend Analysis By Market Taxonomy, 2020 to 2024
    • Market Size Value (USD Billion) & Volume (Units) Forecast By Market Taxonomy, 2025 to 2035
      • By Country
        • USA
        • Canada
        • Mexico
      • By Vehicle Type
      • By Sales Channel
      • By Type
      • By Application
    • Market Attractiveness Analysis
      • By Country
      • By Vehicle Type
      • By Sales Channel
      • By Type
      • By Application
    • Key Takeaways
  12. Latin America Market Analysis 2020 to 2024 and Forecast 2025 to 2035, By Country
    • Historical Market Size Value (USD Billion) & Volume (Units) Trend Analysis By Market Taxonomy, 2020 to 2024
    • Market Size Value (USD Billion) & Volume (Units) Forecast By Market Taxonomy, 2025 to 2035
      • By Country
        • Brazil
        • Argentina
        • Rest of LATAM
      • By Vehicle Type
      • By Sales Channel
      • By Type
      • By Application
    • Market Attractiveness Analysis
      • By Country
      • By Vehicle Type
      • By Sales Channel
      • By Type
      • By Application
    • Key Takeaways
  13. Western Europe Market Analysis 2020 to 2024 and Forecast 2025 to 2035, By Country
    • Historical Market Size Value (USD Billion) & Volume (Units) Trend Analysis By Market Taxonomy, 2020 to 2024
    • Market Size Value (USD Billion) & Volume (Units) Forecast By Market Taxonomy, 2025 to 2035
      • By Country
        • Germany
        • Italy
        • France
        • UK
        • Spain
        • BENELUX
        • Nordic
        • Rest of W.Europe
      • By Vehicle Type
      • By Sales Channel
      • By Type
      • By Application
    • Market Attractiveness Analysis
      • By Country
      • By Vehicle Type
      • By Sales Channel
      • By Type
      • By Application
    • Key Takeaways
  14. Eastern Europe Market Analysis 2020 to 2024 and Forecast 2025 to 2035, By Country
    • Historical Market Size Value (USD Billion) & Volume (Units) Trend Analysis By Market Taxonomy, 2020 to 2024
    • Market Size Value (USD Billion) & Volume (Units) Forecast By Market Taxonomy, 2025 to 2035
      • By Country
        • Russia
        • Hungary
        • Poland
        • Balkan & Baltics
        • Rest of E. Europe
      • By Vehicle Type
      • By Sales Channel
      • By Type
      • By Application
    • Market Attractiveness Analysis
      • By Country
      • By Vehicle Type
      • By Sales Channel
      • By Type
      • By Application
    • Key Takeaways
  15. East Asia Market Analysis 2020 to 2024 and Forecast 2025 to 2035, By Country
    • Historical Market Size Value (USD Billion) & Volume (Units) Trend Analysis By Market Taxonomy, 2020 to 2024
    • Market Size Value (USD Billion) & Volume (Units) Forecast By Market Taxonomy, 2025 to 2035
      • By Country
        • China
        • Japan
        • South Korea
      • By Vehicle Type
      • By Sales Channel
      • By Type
      • By Application
    • Market Attractiveness Analysis
      • By Country
      • By Vehicle Type
      • By Sales Channel
      • By Type
      • By Application
    • Key Takeaways
  16. South Asia & Pacific Market Analysis 2020 to 2024 and Forecast 2025 to 2035, By Country
    • Historical Market Size Value (USD Billion) & Volume (Units) Trend Analysis By Market Taxonomy, 2020 to 2024
    • Market Size Value (USD Billion) & Volume (Units) Forecast By Market Taxonomy, 2025 to 2035
      • By Country
        • India
        • Australia & New Zealand
        • ASEAN
        • Rest of SAP
      • By Vehicle Type
      • By Sales Channel
      • By Type
      • By Application
    • Market Attractiveness Analysis
      • By Country
      • By Vehicle Type
      • By Sales Channel
      • By Type
      • By Application
    • Key Takeaways
  17. Middle East and Africa Market Analysis 2020 to 2024 and Forecast 2025 to 2035, By Country
    • Historical Market Size Value (USD Billion) & Volume (Units) Trend Analysis By Market Taxonomy, 2020 to 2024
    • Market Size Value (USD Billion) & Volume (Units) Forecast By Market Taxonomy, 2025 to 2035
      • By Country
        • GCC Countries
        • Northern Africa
        • South Africa
        • Turkiye
        • Rest of MEA
      • By Vehicle Type
      • By Sales Channel
      • By Type
      • By Application
    • Market Attractiveness Analysis
      • By Country
      • By Vehicle Type
      • By Sales Channel
      • By Type
      • By Application
    • Key Takeaways
  18. Key Countries Market Analysis
    • USA
      • Pricing Analysis
      • Market Share Analysis, 2024
        • By Vehicle Type
        • By Sales Channel
        • By Type
        • By Application
    • Canada
      • Pricing Analysis
      • Market Share Analysis, 2024
        • By Vehicle Type
        • By Sales Channel
        • By Type
        • By Application
    • Brazil
      • Pricing Analysis
      • Market Share Analysis, 2024
        • By Vehicle Type
        • By Sales Channel
        • By Type
        • By Application
    • Mexico
      • Pricing Analysis
      • Market Share Analysis, 2024
        • By Vehicle Type
        • By Sales Channel
        • By Type
        • By Application
    • Argentina
      • Pricing Analysis
      • Market Share Analysis, 2024
        • By Vehicle Type
        • By Sales Channel
        • By Type
        • By Application
  19. Market Structure Analysis
    • Competition Dashboard
    • Competition Benchmarking
    • Market Share Analysis of Top Players
      • By Regional
      • By Vehicle Type
      • By Sales Channel
      • By Type
      • By Application
  20. Competition Analysis
    • Competition Deep Dive
      • Continental
        • Overview
        • Product Portfolio
        • Profitability by Market Segments (Product/Age /Sales Channel/Region)
        • Sales Footprint
        • Strategy Overview
          • Marketing Strategy
          • Product Strategy
          • Channel Strategy
      • Denso
        • Overview
        • Product Portfolio
        • Profitability by Market Segments (Product/Age /Sales Channel/Region)
        • Sales Footprint
        • Strategy Overview
          • Marketing Strategy
          • Product Strategy
          • Channel Strategy
      • ZF Friedrichshafen
        • Overview
        • Product Portfolio
        • Profitability by Market Segments (Product/Age /Sales Channel/Region)
        • Sales Footprint
        • Strategy Overview
          • Marketing Strategy
          • Product Strategy
          • Channel Strategy
      • Valeo
        • Overview
        • Product Portfolio
        • Profitability by Market Segments (Product/Age /Sales Channel/Region)
        • Sales Footprint
        • Strategy Overview
          • Marketing Strategy
          • Product Strategy
          • Channel Strategy
      • Schaeffler
        • Overview
        • Product Portfolio
        • Profitability by Market Segments (Product/Age /Sales Channel/Region)
        • Sales Footprint
        • Strategy Overview
          • Marketing Strategy
          • Product Strategy
          • Channel Strategy
      • Hitachi Astemo
        • Overview
        • Product Portfolio
        • Profitability by Market Segments (Product/Age /Sales Channel/Region)
        • Sales Footprint
        • Strategy Overview
          • Marketing Strategy
          • Product Strategy
          • Channel Strategy
      • Johnson Electric
        • Overview
        • Product Portfolio
        • Profitability by Market Segments (Product/Age /Sales Channel/Region)
        • Sales Footprint
        • Strategy Overview
          • Marketing Strategy
          • Product Strategy
          • Channel Strategy
      • Hella
        • Overview
        • Product Portfolio
        • Profitability by Market Segments (Product/Age /Sales Channel/Region)
        • Sales Footprint
        • Strategy Overview
          • Marketing Strategy
          • Product Strategy
          • Channel Strategy
  21. Assumptions & Acronyms Used
  22. Research Methodology

List of Tables

  • Table 1: Global Market Value (USD Billion) Forecast by Region, 2020-2035
  • Table 2: Global Market Volume (Units) Forecast by Region, 2020-2035
  • Table 3: Global Market Value (USD Billion) Forecast by Vehicle Type, 2020-2035
  • Table 4: Global Market Volume (Units) Forecast by Vehicle Type, 2020-2035
  • Table 5: Global Market Value (USD Billion) Forecast by Sales Channel, 2020-2035
  • Table 6: Global Market Volume (Units) Forecast by Sales Channel, 2020-2035
  • Table 7: Global Market Value (USD Billion) Forecast by Type, 2020-2035
  • Table 8: Global Market Volume (Units) Forecast by Type, 2020-2035
  • Table 9: Global Market Value (USD Billion) Forecast by Application, 2020-2035
  • Table 10: Global Market Volume (Units) Forecast by Application, 2020-2035
  • Table 11: North America Market Value (USD Billion) Forecast by Country, 2020-2035
  • Table 12: North America Market Volume (Units) Forecast by Country, 2020-2035
  • Table 13: North America Market Value (USD Billion) Forecast by Vehicle Type, 2020-2035
  • Table 14: North America Market Volume (Units) Forecast by Vehicle Type, 2020-2035
  • Table 15: North America Market Value (USD Billion) Forecast by Sales Channel, 2020-2035
  • Table 16: North America Market Volume (Units) Forecast by Sales Channel, 2020-2035
  • Table 17: North America Market Value (USD Billion) Forecast by Type, 2020-2035
  • Table 18: North America Market Volume (Units) Forecast by Type, 2020-2035
  • Table 19: North America Market Value (USD Billion) Forecast by Application, 2020-2035
  • Table 20: North America Market Volume (Units) Forecast by Application, 2020-2035
  • Table 21: Latin America Market Value (USD Billion) Forecast by Country, 2020-2035
  • Table 22: Latin America Market Volume (Units) Forecast by Country, 2020-2035
  • Table 23: Latin America Market Value (USD Billion) Forecast by Vehicle Type, 2020-2035
  • Table 24: Latin America Market Volume (Units) Forecast by Vehicle Type, 2020-2035
  • Table 25: Latin America Market Value (USD Billion) Forecast by Sales Channel, 2020-2035
  • Table 26: Latin America Market Volume (Units) Forecast by Sales Channel, 2020-2035
  • Table 27: Latin America Market Value (USD Billion) Forecast by Type, 2020-2035
  • Table 28: Latin America Market Volume (Units) Forecast by Type, 2020-2035
  • Table 29: Latin America Market Value (USD Billion) Forecast by Application, 2020-2035
  • Table 30: Latin America Market Volume (Units) Forecast by Application, 2020-2035
  • Table 31: Western Europe Market Value (USD Billion) Forecast by Country, 2020-2035
  • Table 32: Western Europe Market Volume (Units) Forecast by Country, 2020-2035
  • Table 33: Western Europe Market Value (USD Billion) Forecast by Vehicle Type, 2020-2035
  • Table 34: Western Europe Market Volume (Units) Forecast by Vehicle Type, 2020-2035
  • Table 35: Western Europe Market Value (USD Billion) Forecast by Sales Channel, 2020-2035
  • Table 36: Western Europe Market Volume (Units) Forecast by Sales Channel, 2020-2035
  • Table 37: Western Europe Market Value (USD Billion) Forecast by Type, 2020-2035
  • Table 38: Western Europe Market Volume (Units) Forecast by Type, 2020-2035
  • Table 39: Western Europe Market Value (USD Billion) Forecast by Application, 2020-2035
  • Table 40: Western Europe Market Volume (Units) Forecast by Application, 2020-2035
  • Table 41: Eastern Europe Market Value (USD Billion) Forecast by Country, 2020-2035
  • Table 42: Eastern Europe Market Volume (Units) Forecast by Country, 2020-2035
  • Table 43: Eastern Europe Market Value (USD Billion) Forecast by Vehicle Type, 2020-2035
  • Table 44: Eastern Europe Market Volume (Units) Forecast by Vehicle Type, 2020-2035
  • Table 45: Eastern Europe Market Value (USD Billion) Forecast by Sales Channel, 2020-2035
  • Table 46: Eastern Europe Market Volume (Units) Forecast by Sales Channel, 2020-2035
  • Table 47: Eastern Europe Market Value (USD Billion) Forecast by Type, 2020-2035
  • Table 48: Eastern Europe Market Volume (Units) Forecast by Type, 2020-2035
  • Table 49: Eastern Europe Market Value (USD Billion) Forecast by Application, 2020-2035
  • Table 50: Eastern Europe Market Volume (Units) Forecast by Application, 2020-2035
  • Table 51: East Asia Market Value (USD Billion) Forecast by Country, 2020-2035
  • Table 52: East Asia Market Volume (Units) Forecast by Country, 2020-2035
  • Table 53: East Asia Market Value (USD Billion) Forecast by Vehicle Type, 2020-2035
  • Table 54: East Asia Market Volume (Units) Forecast by Vehicle Type, 2020-2035
  • Table 55: East Asia Market Value (USD Billion) Forecast by Sales Channel, 2020-2035
  • Table 56: East Asia Market Volume (Units) Forecast by Sales Channel, 2020-2035
  • Table 57: East Asia Market Value (USD Billion) Forecast by Type, 2020-2035
  • Table 58: East Asia Market Volume (Units) Forecast by Type, 2020-2035
  • Table 59: East Asia Market Value (USD Billion) Forecast by Application, 2020-2035
  • Table 60: East Asia Market Volume (Units) Forecast by Application, 2020-2035
  • Table 61: South Asia & Pacific Market Value (USD Billion) Forecast by Country, 2020-2035
  • Table 62: South Asia & Pacific Market Volume (Units) Forecast by Country, 2020-2035
  • Table 63: South Asia & Pacific Market Value (USD Billion) Forecast by Vehicle Type, 2020-2035
  • Table 64: South Asia & Pacific Market Volume (Units) Forecast by Vehicle Type, 2020-2035
  • Table 65: South Asia & Pacific Market Value (USD Billion) Forecast by Sales Channel, 2020-2035
  • Table 66: South Asia & Pacific Market Volume (Units) Forecast by Sales Channel, 2020-2035
  • Table 67: South Asia & Pacific Market Value (USD Billion) Forecast by Type, 2020-2035
  • Table 68: South Asia & Pacific Market Volume (Units) Forecast by Type, 2020-2035
  • Table 69: South Asia & Pacific Market Value (USD Billion) Forecast by Application, 2020-2035
  • Table 70: South Asia & Pacific Market Volume (Units) Forecast by Application, 2020-2035
  • Table 71: Middle East and Africa Market Value (USD Billion) Forecast by Country, 2020-2035
  • Table 72: Middle East and Africa Market Volume (Units) Forecast by Country, 2020-2035
  • Table 73: Middle East and Africa Market Value (USD Billion) Forecast by Vehicle Type, 2020-2035
  • Table 74: Middle East and Africa Market Volume (Units) Forecast by Vehicle Type, 2020-2035
  • Table 75: Middle East and Africa Market Value (USD Billion) Forecast by Sales Channel, 2020-2035
  • Table 76: Middle East and Africa Market Volume (Units) Forecast by Sales Channel, 2020-2035
  • Table 77: Middle East and Africa Market Value (USD Billion) Forecast by Type, 2020-2035
  • Table 78: Middle East and Africa Market Volume (Units) Forecast by Type, 2020-2035
  • Table 79: Middle East and Africa Market Value (USD Billion) Forecast by Application, 2020-2035
  • Table 80: Middle East and Africa Market Volume (Units) Forecast by Application, 2020-2035

List of Figures

  • Figure 1: Global Market Volume (Units) Forecast 2020-2035
  • Figure 2: Global Market Pricing Analysis
  • Figure 3: Global Market Value (USD Billion) Forecast 2020-2035
  • Figure 4: Global Market Value Share and BPS Analysis by Vehicle Type, 2025 and 2035
  • Figure 5: Global Market Y-o-Y Growth Comparison by Vehicle Type, 2025-2035
  • Figure 6: Global Market Attractiveness Analysis by Vehicle Type
  • Figure 7: Global Market Value Share and BPS Analysis by Sales Channel, 2025 and 2035
  • Figure 8: Global Market Y-o-Y Growth Comparison by Sales Channel, 2025-2035
  • Figure 9: Global Market Attractiveness Analysis by Sales Channel
  • Figure 10: Global Market Value Share and BPS Analysis by Type, 2025 and 2035
  • Figure 11: Global Market Y-o-Y Growth Comparison by Type, 2025-2035
  • Figure 12: Global Market Attractiveness Analysis by Type
  • Figure 13: Global Market Value Share and BPS Analysis by Application, 2025 and 2035
  • Figure 14: Global Market Y-o-Y Growth Comparison by Application, 2025-2035
  • Figure 15: Global Market Attractiveness Analysis by Application
  • Figure 16: Global Market Value (USD Billion) Share and BPS Analysis by Region, 2025 and 2035
  • Figure 17: Global Market Y-o-Y Growth Comparison by Region, 2025-2035
  • Figure 18: Global Market Attractiveness Analysis by Region
  • Figure 19: North America Market Incremental $ Opportunity, 2025-2035
  • Figure 20: Latin America Market Incremental $ Opportunity, 2025-2035
  • Figure 21: Western Europe Market Incremental $ Opportunity, 2025-2035
  • Figure 22: Eastern Europe Market Incremental $ Opportunity, 2025-2035
  • Figure 23: East Asia Market Incremental $ Opportunity, 2025-2035
  • Figure 24: South Asia & Pacific Market Incremental $ Opportunity, 2025-2035
  • Figure 25: Middle East and Africa Market Incremental $ Opportunity, 2025-2035
  • Figure 26: North America Market Value Share and BPS Analysis by Country, 2025 and 2035
  • Figure 27: North America Market Value Share and BPS Analysis by Vehicle Type, 2025 and 2035
  • Figure 28: North America Market Y-o-Y Growth Comparison by Vehicle Type, 2025-2035
  • Figure 29: North America Market Attractiveness Analysis by Vehicle Type
  • Figure 30: North America Market Value Share and BPS Analysis by Sales Channel, 2025 and 2035
  • Figure 31: North America Market Y-o-Y Growth Comparison by Sales Channel, 2025-2035
  • Figure 32: North America Market Attractiveness Analysis by Sales Channel
  • Figure 33: North America Market Value Share and BPS Analysis by Type, 2025 and 2035
  • Figure 34: North America Market Y-o-Y Growth Comparison by Type, 2025-2035
  • Figure 35: North America Market Attractiveness Analysis by Type
  • Figure 36: North America Market Value Share and BPS Analysis by Application, 2025 and 2035
  • Figure 37: North America Market Y-o-Y Growth Comparison by Application, 2025-2035
  • Figure 38: North America Market Attractiveness Analysis by Application
  • Figure 39: Latin America Market Value Share and BPS Analysis by Country, 2025 and 2035
  • Figure 40: Latin America Market Value Share and BPS Analysis by Vehicle Type, 2025 and 2035
  • Figure 41: Latin America Market Y-o-Y Growth Comparison by Vehicle Type, 2025-2035
  • Figure 42: Latin America Market Attractiveness Analysis by Vehicle Type
  • Figure 43: Latin America Market Value Share and BPS Analysis by Sales Channel, 2025 and 2035
  • Figure 44: Latin America Market Y-o-Y Growth Comparison by Sales Channel, 2025-2035
  • Figure 45: Latin America Market Attractiveness Analysis by Sales Channel
  • Figure 46: Latin America Market Value Share and BPS Analysis by Type, 2025 and 2035
  • Figure 47: Latin America Market Y-o-Y Growth Comparison by Type, 2025-2035
  • Figure 48: Latin America Market Attractiveness Analysis by Type
  • Figure 49: Latin America Market Value Share and BPS Analysis by Application, 2025 and 2035
  • Figure 50: Latin America Market Y-o-Y Growth Comparison by Application, 2025-2035
  • Figure 51: Latin America Market Attractiveness Analysis by Application
  • Figure 52: Western Europe Market Value Share and BPS Analysis by Country, 2025 and 2035
  • Figure 53: Western Europe Market Value Share and BPS Analysis by Vehicle Type, 2025 and 2035
  • Figure 54: Western Europe Market Y-o-Y Growth Comparison by Vehicle Type, 2025-2035
  • Figure 55: Western Europe Market Attractiveness Analysis by Vehicle Type
  • Figure 56: Western Europe Market Value Share and BPS Analysis by Sales Channel, 2025 and 2035
  • Figure 57: Western Europe Market Y-o-Y Growth Comparison by Sales Channel, 2025-2035
  • Figure 58: Western Europe Market Attractiveness Analysis by Sales Channel
  • Figure 59: Western Europe Market Value Share and BPS Analysis by Type, 2025 and 2035
  • Figure 60: Western Europe Market Y-o-Y Growth Comparison by Type, 2025-2035
  • Figure 61: Western Europe Market Attractiveness Analysis by Type
  • Figure 62: Western Europe Market Value Share and BPS Analysis by Application, 2025 and 2035
  • Figure 63: Western Europe Market Y-o-Y Growth Comparison by Application, 2025-2035
  • Figure 64: Western Europe Market Attractiveness Analysis by Application
  • Figure 65: Eastern Europe Market Value Share and BPS Analysis by Country, 2025 and 2035
  • Figure 66: Eastern Europe Market Value Share and BPS Analysis by Vehicle Type, 2025 and 2035
  • Figure 67: Eastern Europe Market Y-o-Y Growth Comparison by Vehicle Type, 2025-2035
  • Figure 68: Eastern Europe Market Attractiveness Analysis by Vehicle Type
  • Figure 69: Eastern Europe Market Value Share and BPS Analysis by Sales Channel, 2025 and 2035
  • Figure 70: Eastern Europe Market Y-o-Y Growth Comparison by Sales Channel, 2025-2035
  • Figure 71: Eastern Europe Market Attractiveness Analysis by Sales Channel
  • Figure 72: Eastern Europe Market Value Share and BPS Analysis by Type, 2025 and 2035
  • Figure 73: Eastern Europe Market Y-o-Y Growth Comparison by Type, 2025-2035
  • Figure 74: Eastern Europe Market Attractiveness Analysis by Type
  • Figure 75: Eastern Europe Market Value Share and BPS Analysis by Application, 2025 and 2035
  • Figure 76: Eastern Europe Market Y-o-Y Growth Comparison by Application, 2025-2035
  • Figure 77: Eastern Europe Market Attractiveness Analysis by Application
  • Figure 78: East Asia Market Value Share and BPS Analysis by Country, 2025 and 2035
  • Figure 79: East Asia Market Value Share and BPS Analysis by Vehicle Type, 2025 and 2035
  • Figure 80: East Asia Market Y-o-Y Growth Comparison by Vehicle Type, 2025-2035
  • Figure 81: East Asia Market Attractiveness Analysis by Vehicle Type
  • Figure 82: East Asia Market Value Share and BPS Analysis by Sales Channel, 2025 and 2035
  • Figure 83: East Asia Market Y-o-Y Growth Comparison by Sales Channel, 2025-2035
  • Figure 84: East Asia Market Attractiveness Analysis by Sales Channel
  • Figure 85: East Asia Market Value Share and BPS Analysis by Type, 2025 and 2035
  • Figure 86: East Asia Market Y-o-Y Growth Comparison by Type, 2025-2035
  • Figure 87: East Asia Market Attractiveness Analysis by Type
  • Figure 88: East Asia Market Value Share and BPS Analysis by Application, 2025 and 2035
  • Figure 89: East Asia Market Y-o-Y Growth Comparison by Application, 2025-2035
  • Figure 90: East Asia Market Attractiveness Analysis by Application
  • Figure 91: South Asia & Pacific Market Value Share and BPS Analysis by Country, 2025 and 2035
  • Figure 92: South Asia & Pacific Market Value Share and BPS Analysis by Vehicle Type, 2025 and 2035
  • Figure 93: South Asia & Pacific Market Y-o-Y Growth Comparison by Vehicle Type, 2025-2035
  • Figure 94: South Asia & Pacific Market Attractiveness Analysis by Vehicle Type
  • Figure 95: South Asia & Pacific Market Value Share and BPS Analysis by Sales Channel, 2025 and 2035
  • Figure 96: South Asia & Pacific Market Y-o-Y Growth Comparison by Sales Channel, 2025-2035
  • Figure 97: South Asia & Pacific Market Attractiveness Analysis by Sales Channel
  • Figure 98: South Asia & Pacific Market Value Share and BPS Analysis by Type, 2025 and 2035
  • Figure 99: South Asia & Pacific Market Y-o-Y Growth Comparison by Type, 2025-2035
  • Figure 100: South Asia & Pacific Market Attractiveness Analysis by Type
  • Figure 101: South Asia & Pacific Market Value Share and BPS Analysis by Application, 2025 and 2035
  • Figure 102: South Asia & Pacific Market Y-o-Y Growth Comparison by Application, 2025-2035
  • Figure 103: South Asia & Pacific Market Attractiveness Analysis by Application
  • Figure 104: Middle East and Africa Market Value Share and BPS Analysis by Country, 2025 and 2035
  • Figure 105: Middle East and Africa Market Value Share and BPS Analysis by Vehicle Type, 2025 and 2035
  • Figure 106: Middle East and Africa Market Y-o-Y Growth Comparison by Vehicle Type, 2025-2035
  • Figure 107: Middle East and Africa Market Attractiveness Analysis by Vehicle Type
  • Figure 108: Middle East and Africa Market Value Share and BPS Analysis by Sales Channel, 2025 and 2035
  • Figure 109: Middle East and Africa Market Y-o-Y Growth Comparison by Sales Channel, 2025-2035
  • Figure 110: Middle East and Africa Market Attractiveness Analysis by Sales Channel
  • Figure 111: Middle East and Africa Market Value Share and BPS Analysis by Type, 2025 and 2035
  • Figure 112: Middle East and Africa Market Y-o-Y Growth Comparison by Type, 2025-2035
  • Figure 113: Middle East and Africa Market Attractiveness Analysis by Type
  • Figure 114: Middle East and Africa Market Value Share and BPS Analysis by Application, 2025 and 2035
  • Figure 115: Middle East and Africa Market Y-o-Y Growth Comparison by Application, 2025-2035
  • Figure 116: Middle East and Africa Market Attractiveness Analysis by Application
  • Figure 117: Global Market - Tier Structure Analysis
  • Figure 118: Global Market - Company Share Analysis

Frequently Asked Questions

What is the projected market size of the automotive electric actuator industry by 2035?

The market is expected to reach approximately 50 billion USD by 2035, growing at a CAGR of 6.2%.

Which type of actuator holds the largest share in 2025?

Linear actuators lead with a 60% market share, primarily used in braking, HVAC, and door lock systems.

How much of the market is dominated by OEM sales?

OEM channels account for 80% of the automotive electric actuator market.

What is the annual growth rate of the market in China?

Automotive electric actuator industry In China is growing at a CAGR of 6.6%.

Who is the leading player in the automotive electric actuator market?

BorgWarner holds a 20% share, making it the market leader in electric actuators.

Explore Similar Insights

Future Market Insights

Automotive Electric Actuator Market