The Automotive Actuator Market is estimated to be valued at USD 16.1 billion in 2025 and is projected to reach USD 30.5 billion by 2035, registering a compound annual growth rate (CAGR) of 6.6% over the forecast period.
The Automotive Actuator market is experiencing substantial growth driven by the increasing integration of advanced electronic and electromechanical systems in modern vehicles. The future outlook is largely shaped by the rising demand for improved vehicle performance, fuel efficiency, and enhanced safety features. Growing adoption of electric and hybrid vehicles has further fueled the need for precise actuator systems to control components such as transmission, throttle, braking, and steering.
Continuous technological advancements, including the development of intelligent and software-controlled actuators, are enabling manufacturers to offer better reliability, faster response times, and reduced energy consumption. Increasing consumer preference for passenger cars equipped with advanced features, coupled with stricter emission and safety regulations globally, is creating a significant demand for high-performance actuators.
Moreover, the ongoing shift toward electric and autonomous vehicles is expected to further accelerate the adoption of automotive actuators Investments in research and development, along with the focus on reducing vehicle weight and improving operational efficiency, are anticipated to create sustained growth opportunities across various vehicle types and actuator working mechanisms.
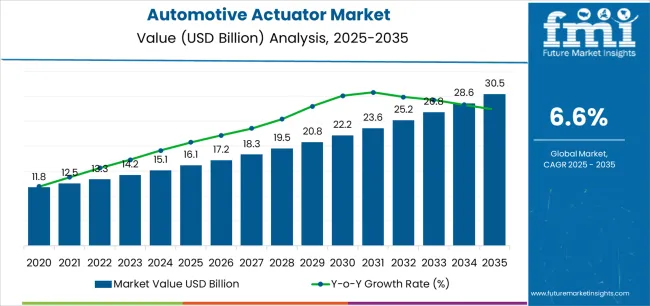
| Metric | Value |
|---|---|
| Automotive Actuator Market Estimated Value in (2025 E) | USD 16.1 billion |
| Automotive Actuator Market Forecast Value in (2035 F) | USD 30.5 billion |
| Forecast CAGR (2025 to 2035) | 6.6% |
The market is segmented by Product Type, Vehicle Type, Working Type, and Sales Channel and region. By Product Type, the market is divided into Transmission Actuators, Driveline Actuators, and Brake Actuators. In terms of Vehicle Type, the market is classified into Passenger Cars, Light Commercial Vehicles, and Heavy Commercial Vehicles. Based on Working Type, the market is segmented into Electric, Pneumatic, Hydraulic, and Electromagnetic. By Sales Channel, the market is divided into OEM and Aftermarket. Regionally, the market is classified into North America, Latin America, Western Europe, Eastern Europe, Balkan & Baltic Countries, Russia & Belarus, Central Asia, East Asia, South Asia & Pacific, and the Middle East & Africa.
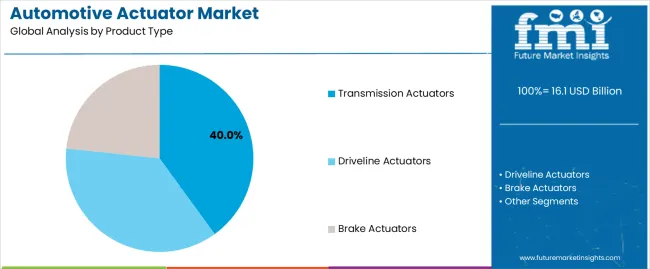
The transmission actuators product type segment is projected to hold 40.0% of the Automotive Actuator market revenue share in 2025, making it the leading product type. This dominance is attributed to the critical role transmission actuators play in enabling smooth gear shifts and improving overall vehicle drivability.
Advancements in software and electronic control systems have enhanced the precision and response time of transmission actuators, supporting better fuel efficiency and vehicle performance. Growing demand for automated transmissions in passenger cars, especially in regions with increasing preference for convenience and comfort, has contributed to the widespread adoption of transmission actuators.
Additionally, the ability to integrate with electric and hybrid vehicle powertrains has further strengthened their market position The development of compact, lightweight, and energy-efficient actuators has also encouraged adoption among automotive manufacturers aiming to meet stringent emission and efficiency standards.
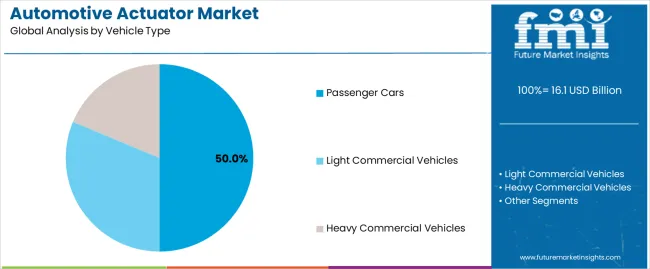
The passenger cars vehicle type segment is expected to capture 50.0% of the Automotive Actuator market revenue share in 2025, establishing it as the leading vehicle type segment. The growth of this segment is driven by the rising production and sales of passenger cars equipped with advanced actuator technologies for enhanced driving experience, safety, and efficiency.
Consumer preference for vehicles offering smooth performance, fuel economy, and automated features has increased reliance on sophisticated actuators. The integration of actuators in systems such as transmission, braking, and throttle control has become essential for passenger cars to comply with safety and emission regulations.
Furthermore, the increasing shift toward electric and hybrid passenger cars has accelerated the adoption of actuators, as these vehicles require precise electronic and electromechanical control systems The combination of regulatory compliance, technological advancement, and consumer demand continues to support the dominance of the passenger cars segment.
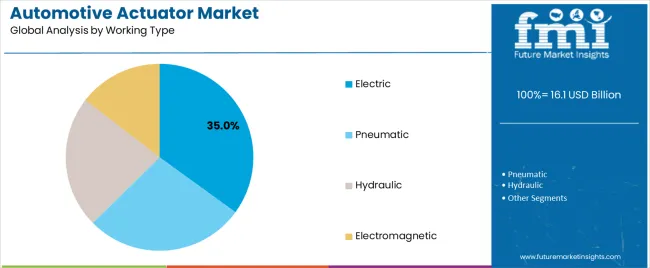
The electric working type segment is anticipated to account for 35.0% of the Automotive Actuator market revenue in 2025, making it the leading working type. This growth is driven by the increasing adoption of electric and hybrid vehicles, which rely on electrically operated actuators for transmission, throttle, braking, and steering systems.
Electric actuators offer advantages such as improved precision, faster response times, and energy efficiency compared to traditional hydraulic or pneumatic actuators. The segment has benefited from continuous innovation in motor technology and control electronics, allowing for compact designs and integration with vehicle software systems.
The rising focus on reducing vehicle emissions and enhancing performance has further reinforced the adoption of electric actuators Additionally, the growing trend of autonomous driving and advanced driver-assistance systems (ADAS) has created a strong demand for reliable and intelligent electric actuators capable of supporting automated vehicle functions, solidifying their leading position in the market.
The table below presents a comparative assessment of the variation in CAGR over six months for the base year (2025) and current year (2025) for the global automotive actuator industry. This analysis reveals crucial shifts in industry performance and indicates revenue realization patterns, thereby providing stakeholders with a better vision of the growth trajectory over the year.
The first half of the year, or H1, spans from January to June. The second half, H2, includes the months from July to December. In the first half (H1) of the semi-annual period from 2025 to 2035, the industry is predicted to surge at a CAGR of 6.2%, followed by a slightly higher growth rate of 6.6% in the second half (H2) of the same decade.
| Particular | Value CAGR |
|---|---|
| H1 | 6.2% (2025 to 2035) |
| H2 | 6.6% (2025 to 2035) |
| H1 | 6% (2025 to 2035) |
| H2 | 7.2% (2025 to 2035) |
Moving into the subsequent period, from H1 2025 to H2 2035, the CAGR is projected to remain moderate at 6% in the first half and remain relatively high at 7.2% in the second half. In the first half (H1), the industry witnessed a decrease of 20 BPS while in the second half (H2), it showcased a surge of 60 BPS.
Automakers Strive to Provide Precise Control over Engines with Strict Emission Standards
The automotive actuator market is experiencing significant growth driven by increasingly stringent emission regulations worldwide. Governments and regulatory bodies are imposing tougher standards to curb pollution and promote environmental sustainability.
The pressure is compelling internal combustion engine (ICE) manufacturers to adopt advanced clean-engine technologies like variable valve timing (VVT) and exhaust gas recirculation (EGR). These technologies require precise control mechanisms provided by actuators to optimize engine performance, reduce emissions, and comply with regulatory standards.
Actuators play a crucial role in minimizing pollution by enabling precise control over engine functions. In VVT systems, these components help adjust the timing of valve operations to improve engine efficiency and reduce harmful emissions.
Similarly, in EGR systems, these help regulate the flow of exhaust gases back into the engine's intake, lowering nitrogen oxide emissions. By enhancing the efficiency of these systems, the components help manufacturers meet emission targets and contribute to a clean environment.
Emergence of Speech Command Operated Driving Assist Systems Boosts Demand
The automotive actuator market is increasingly adopting advanced driver assistance systems that leverage deep learning techniques for improved safety and convenience. A notable trend is the integration of speech command-operated systems, designed to mitigate the risks associated with distracted driving.
According to the National Highway Traffic Safety Administration (NHTSA), distracted driving contributes to 16.1% to 17% of injuries and fatalities annually, with 3,142 fatalities reported in 2025 alone. By enabling drivers to control various vehicle functions, such as climate control, windows, and navigation systems using voice commands, these systems allow drivers to keep their eyes on the road and hands on the steering wheel.
It helps in significantly reducing distraction-related accidents. The use of deep neural networks ensures high accuracy in processing, recognizing, and classifying spoken commands, making these systems both reliable and user-friendly.
The shift toward voice-activated control in vehicles not only enhances safety but also offers a more convenient driving experience. As deep learning models continuously improve through user interactions, the precision and efficiency of these systems increase over time. This trend is reshaping the automotive actuator industry, driven by the rising demand for smarter and more intuitive vehicular systems.
As automotive manufacturers and technology providers innovate, the adoption of these advanced driver assistance systems is expected to surge, setting new standards for vehicle automation and driver assistance. This technological advancement is poised to revolutionize in-vehicle automation, making driving safer and more convenient for everyone.
Vehicle Electrification Trends like Development of EVs and HEVs to Create New Opportunities
The automotive industry is undergoing a transformation with the rise of electric vehicles. The development of electric and hybrid vehicles is mainly driven by environmental concerns, government policies, and consumer concerns for sustainable transportation solutions. This shift toward electrification is increasing the need for actuators in various components of electric powertrains.
Electric powertrains require various types of actuators to ensure efficient operation and optimal performance. Battery cooling systems rely on these components to regulate the temperature of battery packs, ensuring optimal charging and discharge cycles.
Regenerative braking systems, a key feature of EVs and HEVs, use actuators to control the energy recovery process during braking function, improving overall energy efficiency. Also, power electronic components, such as inverters employ actuators for precise control and management of electrical power flow.
For instance, electric car markets are seeing exponential growth as sales exceeded 16.1 million in 2025. A total of 14% of all new cars sold were electric in 2025. China was the frontrunner, accounting for around 60% of global electric car sales. Europe being the second-largest, electric car sales increased by over 15% in 2025. The United States was in the fourth position as sales surged increased 55% in 2025, reaching a share of 8%.
Increasing Adoption of Advanced Chassis Systems Augments Sales
Active suspension systems utilize actuators to adjust to suspension damping in real-time, which is based on road conditions and driving dynamics. This improves riding quality by minimizing vibration and ensuring optimal contact between tires and the road surface.
Adaptive damping systems use actuators to continuously adjust the damping and absorb shock, providing a balance between comfortable rides and handling performance. Active roll control systems employ these components to counteract during corning, thereby improving vehicle stability and enhancing overall experience.
Automakers are increasingly incorporating advanced chassis systems into their portfolios as demand for more comfortable driving experiences surges. The effective functioning of these systems relies on the precise and responsive operation of actuators, which is driving demand for high-performance and innovative actuator technology. The growing emphasis on vehicle dynamics, safety, and comfort is anticipated to propel the adoption of advanced chassis systems, turning actuators into an indispensable link in modern vehicle design and manufacturing.
Fluid Leakage Issues and High Maintenance Requirements Hamper Demand
One of the significant restraints on the growth of the automotive actuator industry is the issue related to fluid leaks, which severely impact performance and efficiency. Actuators that rely on hydraulic systems are specifically affected by this problem.
Fluid leaks can lead to decreased pressure within the system, resulting in suboptimal operation of several vehicle functions, such as steering and braking. This not only compromises vehicle performance but also poses safety risks.
The need to frequently monitor and address fluid leaks adds to the operational costs and maintenance burdens on vehicle owners and manufacturers. This issue potentially deters them from investing in such technologies.
High maintenance requirements associated with actuators are anticipated to further hinder business growth. Hydraulic and pneumatic actuators often involve complex assemblies that make regular assessment and upkeep important to ensure proper functionality. The component requires routine checks for wear and tear, which can be both time-consuming and costly.
The need for maintenance and the potential downtime associated with repairs can deter automotive manufacturers from adopting actuators. Instead, key players may shift their focus to more reliable and low-maintenance alternatives, such as electromagnetic actuators, which do not have the aforementioned drawbacks.
Global sales of automotive actuators grew at a CAGR of 2.6% between 2020 and 2025. Total revenue reached about USD 16.1 billion in 2025. In the forecast period, the global industry is set to thrive at a CAGR of 6.9%.
The industry has been seeing a notable increase in growth due to the rising demand for modern vehicles with advanced functionalities like automatic climate control, adaptive cruise control, and power window systems. Besides, the growing popularity of electric and hybrid vehicles also played a part in augmenting growth, since these vehicles need a large quantity of actuators to function efficiently.
Furthermore, the automotive sector's move toward automation and the introduction of autonomous vehicles propelled the need for precise actuators, resulting in industry expansion.
During the COVID-19 pandemic, the market faced numerous challenges, particularly related to disruptions in the global supply chain. Factory shutdowns, labor shortages, and restrictions on international trade LED to delays in the production and delivery of automotive components, including actuators. Manufacturers struggled to maintain their operations amid the uncertain economic environment, which caused a significant drop in vehicle production and sales.
The industry is on a strong upward trajectory post-COVID-19, fueled by the revival of vehicle production and sales as economies recover and consumer confidence strengthens. A significant driver of this growth is the rising popularity of electric and autonomous vehicles. This is mainly being driven by government initiatives promoting environmentally friendly transportation.
Tier 1 companies comprise leading players with a revenue of above USD 150 million, capturing a significant share of 25% to 30%. These leaders are characterized by high production capacity and a wide product portfolio. They are distinguished by their extensive expertise in manufacturing and a broad geographical reach, underpinned by a robust consumer base.
They provide a wide range of actuators by utilizing the latest technology and meeting regulatory standards. Prominent companies within Tier I include Denso Corporation, Hitachi, Ltd., Robert Bosch GmbH, Nidec Corporation, Mitsubishi Heavy Industries Ltd., ZF Friedrichshafen AG, Magna International, Inc., and Mahle GmbH.
Tier 2 includes most of the mid-sized companies with a robust presence in specific countries. These companies mainly focus on influencing local sales. Companies in this category are mainly characterized by highly skilled workers and a robust presence overseas.
Tier 2 companies, however, do not have access to cutting-edge technology. But, they focus on adhering to production guidelines provided by government bodies to gain a large client base.
The table below highlights the CAGRs of three key countries in the automotive actuator market. China, the United States, and Germany are projected to witness considerable CAGRs of 6.6%, 5.5%, and 5%, respectively from 2025 to 2035.
| Countries | CAGR 2025 to 2035 |
|---|---|
| China | 6.6% |
| United States | 5.5% |
| Germany | 5% |
The United States remains a dynamic industry for automotive actuator manufacturers. Overall sales in the country are likely to reach a value of around USD 16.1 billion in 2025. However, the market performance declined amid the outbreak of COVID-19 between 2020 and 2024.
Leading automakers, such as General Motors Company (GM) and Ford Motor Company witnessed a 30 to 40% decline in sales. The industry is now set to recover and deliver sustained growth on the back of a number of factors.
One key factor is the rising focus of international firms present in the United States on strategic collaborations and partnerships with start-up companies. These collaborations aim to co-develop technologically advanced electromagnetic actuators, fostering innovation and accelerating the adoption of cutting-edge actuator technologies.
The emergence of innovative actuator features in vehicles is anticipated to drive sales of automotive actuators in the United States. Also, the rapidly increasing number of testing procedures that are being carried out for autonomous vehicles in the country is anticipated to push demand.
As consumers are moving toward safe, comfortable, and convenient features, demand for autonomous driving is surging steadily. Hence, sales of actuators with advanced features are projected to increase in the United States.
As of 2025, China continues to hold its position as the world’s most prominent vehicle market in terms of both annual sales and manufacturing output. The country's domestic production is projected to reach 16.1 million vehicles by 2025, showcasing its dominant role in the global automotive industry. This growth is not just limited to conventional vehicles but also extends to various segments, such as the automotive actuator industry.
China is experiencing rapid expansion due to the increasing adoption of advanced automotive technologies and the rising demand for more automated and efficient vehicle systems. Actuators, which are essential for controlling several vehicle functions, are becoming more prevalent as vehicles become increasingly sophisticated and integrated with smart technologies.
The New Energy Vehicle (NEV) sector in China has seen substantial growth, mainly fueled by government subsidies that totaled around 16.1 billion yuan by 2025. This financial support has been instrumental in accelerating the adoption of NEVs, with China dominating the global NEV sector by selling 6.8 million units in 2025, accounting for 63.6% of global sales.
The boom in the NEV sector correlates strongly with actuator demand in the automotive industry. This is because NEVs rely heavily on advanced actuator systems for functions such as battery management, electric powertrains, and automated driving systems. The integration of these technologies not only boosts the efficiency and performance of NEVs but also positions China at the forefront of automotive innovation and sustainability.
Germany is likely to position itself as a dominant country in Europe’s automotive actuator market, which is predicted to account for a staggering 29.8% share by 2025. This remarkable growth can be attributed to extensive research and development and robust export capabilities.
In 2025, sport utility vehicles (SUVs) LED the passenger car segment with 855,700 new registrations, followed by compact and sub-compact cars with 465,100 and 337,600 registrations, respectively. The industry, known for its high turnover, research intensity, and export strength, significantly influences various economic sectors. In 2020, it achieved a turnover of USD 484.3 billion, surpassing other industries.
Automotive firms in the country invested about USD 15.1 billion in research and development in 2024, sustaining a competitive edge in innovation. This extensive research and development spending also bolsters the industry, essential for advancing clean-engine technologies and enhancing vehicle efficiency.
The section shows that based on working type, the electromagnetic segment is anticipated to hold a dominant share in 2035. It is set to exhibit a CAGR of 5.1% during the forecast period. In terms of product type, the transmission actuator segment is anticipated to witness a 4.8% CAGR through 2035.
| Segment | Electromagnetic (Working Type) |
|---|---|
| Value CAGR (2025 to 2035) | 5.1% |
Based on working type, the electromagnetic segment is projected to lead the global industry, accounting for around 40% of the share in 2025. This dominance is due to the growing demand for passenger cars, which heavily depend on electromagnetic actuators for several functions.
Electromagnetic actuators have emerged as a groundbreaking technology in automotive suspension systems, offering dynamic control over damping values to adjust spring firmness in response to varying road conditions. Unlike traditional pneumatic or hydraulic actuators, electromagnetic actuators utilize magnetic forces for actuation, providing swift and precise adjustments to improve ride quality.
The introduction of two-way electromagnetic actuation has further enhanced suspension performance by facilitating active suspension mechanisms in both humps and potholes, thereby refining the overall driving experience.
Compared to pneumatic, hydraulic, and electric actuators, electromagnetic actuators boast several advantages. They offer faster response times, greater precision, and energy efficiency, making these ideal for automotive applications where rapid adjustments and minimal energy loss are crucial.
Dana's smart electromagnetic actuator, for instance, exemplifies these advantages by integrating position-sensing electronics and eliminating the need for complex hydraulic systems. This results in improved fuel economy, enhanced performance, and reduced maintenance requirements, contributing to the widespread adoption of electromagnetic actuators in automotive suspension systems.
Over the forecast period, demand for electromagnetic actuators is forecast to rise at a CAGR of 5.1%. By 2025, the target segment is estimated to reach USD 9.9 billion.
| Segment | Transmission Actuator (Product Type) |
|---|---|
| Value CAGR (2025 to 2035) | 4.8% |
Transmission actuators play an important role in modern automotive powertrains, controlling gear shifting and optimizing performance and efficiency. Recent advancements in electromechanical actuation systems by companies like Getrag, Hyundai, and Honda have showcased remarkable efficiency.
The average power consumption below 20 W has been exemplified by Honda's sport hybrid i-DCD. It boasts an impressive 12 W consumption. These systems not only enhance dynamics and controllability but also contribute to reduced size and costs of transmissions.
Compared to driveline and brake actuators, transmission actuators stand out due to their significant influence on transmission size, costs, and efficiency. While all three types of actuators contribute to vehicle dynamics and control, transmission actuators have a unique impact on powertrain performance.
Their ability to optimize gear shifting and power distribution directly affects overall vehicle efficiency. Continuous demand for improved fuel economy and performance in automobiles has increased the importance of transmission actuators, making these indispensable components in modern vehicles. Their role in achieving efficient power transmission and enhancing driving experience positions these at the forefront of technological advancements in automotive actuation systems.
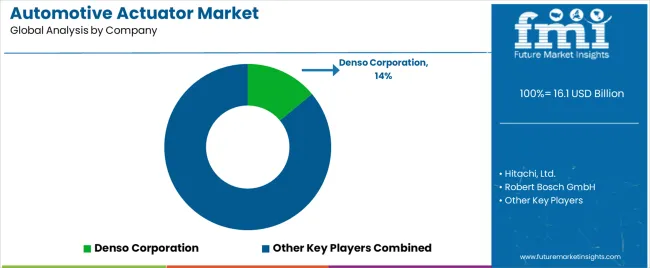
Denso Corporation, Hitachi, Ltd., Robert Bosch GmbH, Nidec Corporation, Mitsubishi Heavy Industries Ltd., ZF Friedrichshafen AG, Magna International, Inc., Mahle GmbH, Brose Fahrzeugteile GmbH & Co KG, Vitesco Technologies, Minebea Mitsumi, Inc., and HELLA GmbH & Co. KGaA are the leading manufacturers of automotive actuators profiled in the full version of the report.
Key players are focusing on the expansion of domestic production and investing in new technologies to provide cost-efficient solutions to vehicle owners. They are also joining hands with local companies or start-ups to exchange ideas and co-develop new products.
Industry Updates
A few key product types included in the study are transmission actuators, driveline actuators, and brake actuators.
The leading types of vehicles included in the study are passenger cars, light commercial vehicles, and heavy commercial vehicles.
In terms of working types, the industry is divided into pneumatic, hydraulic, electromagnetic, and electric.
Based on sales channel, the industry is bifurcated into original equipment manufacturer (OEM) and aftermarket.
A few regions considered in the study include North America, Latin America, Western Europe, Eastern Europe, East Asia, South Asia, and the Middle East and Africa.
The global automotive actuator market is estimated to be valued at USD 16.1 billion in 2025.
The market size for the automotive actuator market is projected to reach USD 30.5 billion by 2035.
The automotive actuator market is expected to grow at a 6.6% CAGR between 2025 and 2035.
The key product types in automotive actuator market are transmission actuators, driveline actuators and brake actuators.
In terms of vehicle type, passenger cars segment to command 50.0% share in the automotive actuator market in 2025.


Full Research Suite comprises of:
Market outlook & trends analysis
Interviews & case studies
Strategic recommendations
Vendor profiles & capabilities analysis
5-year forecasts
8 regions and 60+ country-level data splits
Market segment data splits
12 months of continuous data updates
DELIVERED AS:
PDF EXCEL ONLINE
Automotive Lighting Actuators Market Size and Share Forecast Outlook 2025 to 2035
Automotive Electric Actuators Market Size and Share Forecast Outlook 2025 to 2035
Automotive Electric Actuator Market Analysis - Size, Share, and Forecast Outlook 2025 to 2035
Automotive Roof Rails Market Size and Share Forecast Outlook 2025 to 2035
Automotive Active Safety System Market Size and Share Forecast Outlook 2025 to 2035
Automotive Diagnostic Scan Tool Market Size and Share Forecast Outlook 2025 to 2035
Automotive Test Equipment Market Size and Share Forecast Outlook 2025 to 2035
Automotive Dynamic Map Data Market Size and Share Forecast Outlook 2025 to 2035
Automotive Green Tires Market Size and Share Forecast Outlook 2025 to 2035
Automotive E-Tailing Market Size and Share Forecast Outlook 2025 to 2035
Automotive Interior Market Forecast Outlook 2025 to 2035
Automotive Key Market Size and Share Forecast Outlook 2025 to 2035
Automotive Appearance Chemical Market Forecast and Outlook 2025 to 2035
Automotive Seating Market Forecast and Outlook 2025 to 2035
Automotive Domain Control Module Market Forecast and Outlook 2025 to 2035
Automotive Remote Diagnostic Market Forecast and Outlook 2025 to 2035
Automotive-grade Inertial Navigation System Market Size and Share Forecast Outlook 2025 to 2035
Automotive Thin IGBT Module Market Size and Share Forecast Outlook 2025 to 2035
Automotive Hydrogen Leak Detection Sensors Market Size and Share Forecast Outlook 2025 to 2035
Automotive Hybrid IGBTs Market Size and Share Forecast Outlook 2025 to 2035

Thank you!
You will receive an email from our Business Development Manager. Please be sure to check your SPAM/JUNK folder too.
Chat With
MaRIA