Aircraft Hydraulic System Market Size and Share Forecast Outlook

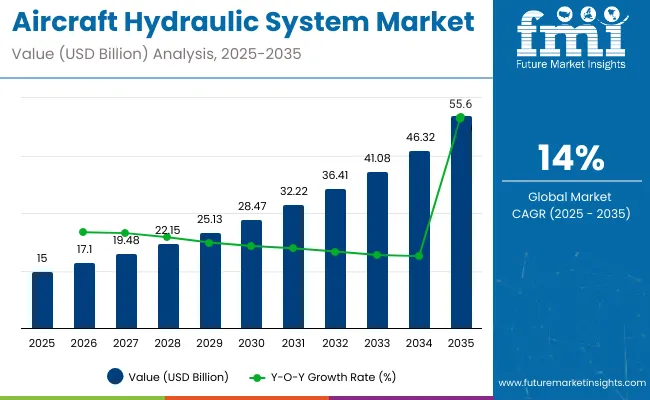
The aircraft hydraulic system market is expected to surge from USD 12.6 billion in 2024 to USD 25.9 billion in 2034. Between 2024 and 2034, the demand for aircraft hydraulic systems is expected to expand steadily at a CAGR of 11.8%.

Factors anticipated to stimulate the market for aircraft hydraulic systems include the growing requirement for extremely reliable systems, higher power-to-weight ratios in hydraulic systems, reduced cooling costs resulting from the low heat created in hydraulic systems, and a wide range of load-handling capacities. The high maintenance costs and substantial weight of the hydraulic system restrain the airplane hydraulic system market.

Dynamic Shifts Shaping the Aircraft Hydraulic System Landscape

  • The aviation sector has been moving toward more electric aircraft to increase efficiency and lessen its environmental impact. Since electrically driven components are frequently included in MEA designs, this change potentially affects the function and architecture of aircraft hydraulic systems.
  • Strict regulatory requirements have an impact on the aircraft hydraulic system market. Safety and performance standards that manufacturers and operators must follow encourage creativity and ongoing advancement in hydraulic system designs.
  • The expansion of the global aviation sector directly impacts the market. It is growing due to the growing need for new aircraft and the contemporary hydraulic systems added to aircraft fleets.
Attributes Details
Market Value for 2024 USD 12.6 billion
Market Size for 2034 USD 25.9 billion
Market CAGR from 2024 to 2034 11.8%

Top Aircraft Hydraulic System Market Dynamics and Industry Trends

  • Aircraft manufacturers and operators always seek new technology to improve aircraft performance, emphasizing environmental sustainability and fuel efficiency. Since hydraulic systems offer dependable and lightweight solutions for essential tasks, they are critical to increasing fuel efficiency and boosting the growth of the airplane hydraulic system market.
  • Hydraulic systems are also necessary for several vital tasks in military aircraft. Modernization initiatives by defense forces globally demand sophisticated aircraft hydraulic technologies to improve military aircraft capabilities.
  • The aviation sector has strict safety standards and regulations. Hydraulic systems must follow these rules since they are essential to airplane safety. The demand for sophisticated aircraft hydraulic systems is driven by the ongoing development of safety regulations and the focus on dependability.
Attributes Details
Market Value for 2019 USD 6.2 billion
Market Size for 2023 USD 11 billion
Market CAGR from 2019 to 2023 15.5%

Factors Restraining the Demand for Aircraft Hydraulic Systems

  • Hydraulic systems need to undergo routine maintenance and inspections regularly to ensure optimal operation. The accompanying maintenance costs are high, which affects airlines' and aircraft operators' operational costs. These financial considerations cause customers to favor less maintenance-intensive alternatives, negatively impacting aircraft hydraulic system sales.
  • There is growing concern in the aviation sector about the environmental impact of hydraulic fluids due to the industry's focus on sustainability. The adoption of aircraft hydraulic systems is hampered by the environmental dangers associated with leaks or spills. As a result, more emphasis is now on eco-friendly options, which puts limitations on traditional aircraft hydraulic systems.
  • Modern technologies are preferred over more conventional hydraulic systems in the aviation sector, which are characterized by rapid technical breakthroughs. Rapid innovation leads to constraints as producers and operators weigh whether to use the newest technologies, constraining market expansion for aircraft hydraulic systems.

Aircraft Hydraulic System Industry Analysis by Top Investment Segments

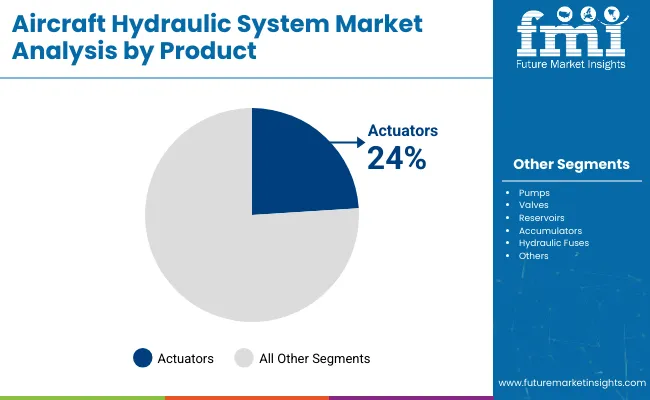
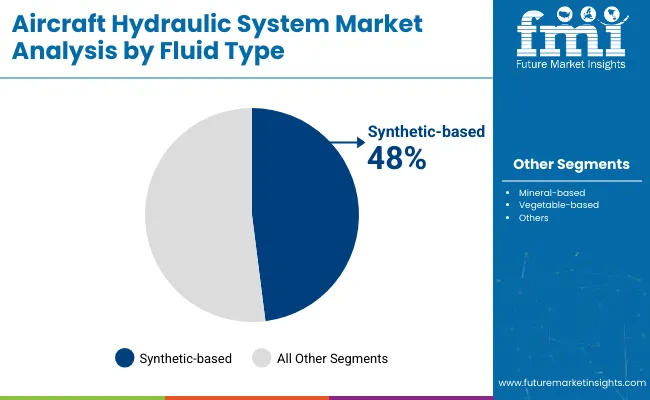
The segmented market analysis of aircraft hydraulic systems is included in the following subsection. Based on comprehensive studies, the reservoirs sector is leading the product category, and the vegetable-based segment is commanding the fluid type category.

The Reservoirs Segment is Likely to Exhibit a CAGR of 11.6% Through 2034

Based on the product, the reservoirs category is expected to evolve at an 11.6% CAGR until 2034. Key reasons propelling the segment's growth include:

Leading Segment Reservoirs
Segment HCAGR 15.3%
  • Since reservoirs are vital for maintaining a steady fluid flow and maximizing the effectiveness of hydraulic components, they command the aircraft hydraulic system market.
  • Reservoirs are significant to businesses because they save maintenance costs and downtime by ensuring the smooth operation of aircraft hydraulic systems.
  • For companies looking for durable and dependable aircraft hydraulic solutions in the aircraft sector, reservoirs are a wise investment as a fundamental part.

Vegetable-based Segment is Likely to Advance at a CAGR of 11.4% Through 2034

The vegetable-based sector is expected to develop at a CAGR of 11.4% from 2024 to 2034. The factors that contribute to its sales are as follows:

Leading Segment Vegetable-based
Segment HCAGR 15.1%
  • Due to its smooth integration and compatibility with current systems, the vegetable-based segment is anticipated to acquire market share in the aircraft hydraulic system industry.
  • Vegetable-based fluids are prevalent due to increased safety requirements and regulatory preferences for biodegradable choices.
  • Vegetable-based fluids are becoming the preferred option in the aircraft hydraulic systems sector as environmental consciousness grows and the need for environmentally acceptable solutions increases.

Analysis of Top Countries Manufacturing, Certifying, and Operating Aircraft Hydraulic System Components

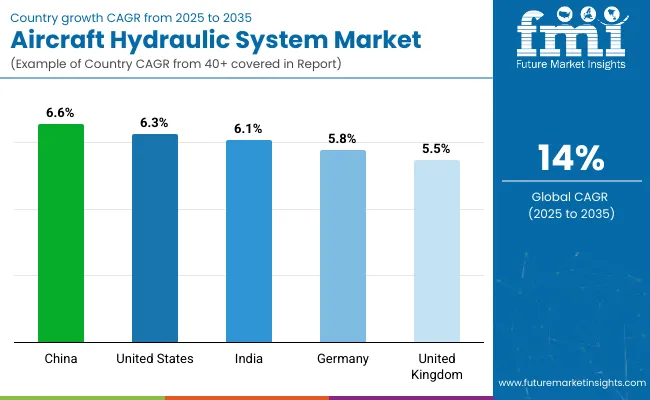
The aircraft hydraulic system market is observed in the subsequent tables, which focus on the leading economies in North America, Europe, and Asia Pacific. A comprehensive evaluation demonstrates that Asia Pacific has enormous opportunities due to its resilient aircraft hydraulic system manufacturers.

Innovation In Hydraulic Technology Fosters Resilience in South Korea's Aviation.

The South Korea aircraft hydraulic system industry is expected to develop at a 14.0% CAGR through 2034. This expansion is sustained by:

Country South Korea
Market Size (2034) USD 2.5 billion
  • With an emphasis on cutting-edge technology and dependability, aircraft hydraulic system providers meet the changing needs of South Korea's defense applications owing to the country's dedication to military modernization.
  • South Korea is positioned as a key player in the global aircraft hydraulic system market due to proactive investments in research and development that enhance the country's lightweight and technologically sophisticated hydraulic systems.
  • The focus on training a skilled labor force in aerospace engineering establishes South Korea as a talent hotspot, encouraging creativity and cutting-edge technology in the aviation hydraulic system market.

Enhanced Safety Features Contribute to The Evolution of Aircraft Hydraulic Systems in Japan

Loaded with promise, Japan's aircraft hydraulic system sector is expected to develop at a CAGR of 13.3% through 2034. This expansion is driven by:

Country Japan
Market Size (2034) USD 4.2 billion
  • Japan airplane hydraulic system market is positioned for growth due to its dedication to regional and global safety standards, especially in light of strict regulatory compliance.
  • Japan's rising commercial and defense aerospace sectors are integrating aircraft hydraulic systems, which presents potential for creative solutions and represents the industry's shift toward modernization.
  • Japan's commitment to aerospace research and development facilitates the improvement of robust and lightweight aircraft hydraulic systems, which aligns with the trend toward fuel efficiency.

Integration of Smart Technologies Reshapes Aircraft Hydraulic Landscape in China

The China aircraft hydraulic system industry is expected to expand at a 12.6% CAGR through 2034. This is described as follows:

Country China
Market Size (2034) USD 6.1 billion
  • China's dedication to developing a competitive aerospace industry environment opening is shaping the future of the aircraft hydraulic system market, opening opportunities for international partnerships and collaborations.
  • China aircraft hydraulic system manufacturers are incentivized by government backing for domestic aerospace development to allocate resources toward research and development, propelling innovation in hydraulic system technologies.
  • Aircraft hydraulic system efficiency and modernization are receiving more attention due to China's expanding middle class and its consequently expanding demand for air travel.

Sustainable Practices Reshape the Landscape of The United Kingdom Market

The aircraft hydraulic system sector in the United Kingdom is expected to evolve at a 13.0% CAGR through 2034. This is outlined below:

Country United Kingdom
Market Size (2034) USD 1.6 billion
  • The demand for aircraft hydraulic systems that improve fuel efficiency and lower carbon emissions in line with environmental aims is boosted by the United Kingdom's focus on sustainable aviation solutions.
  • Due to its strong aerospace technical capabilities and critical position in the global aerospace market, the United Kingdom is well-positioned to develop and export cutting-edge aircraft hydraulic systems.

Emphasis on Fuel Efficiency Shapes the Future of Aircraft Hydraulic Systems in the United States

The United States aircraft hydraulic system market is anticipated to display a CAGR of 12.1% through 2034. This is explained by:

Country United States
Market Size (2034) USD 6.9 billion
  • With a focus on modernization and operational efficiency, the United States' growing trend of replacing outdated aircraft fleets presents significant opportunities for the aviation hydraulic system industry.
  • The United States aviation industry is moving toward smart and linked hydraulic systems due to the adoption of digital technology. The aircraft hydraulic systems provide predictive maintenance solutions to save operating costs.

Leading Suppliers of Aircraft Hydraulic Systems

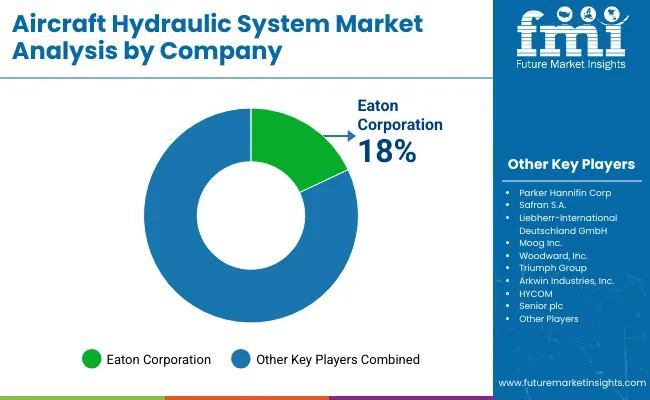
The industry remains competitive with multiple aircraft hydraulic system manufacturers fighting for market share. Technological developments, product innovation, and collaborative efforts are some of the things that fuel fierce rivalry. As dependable and innovative, leading aircraft hydraulic system providers are crucial in determining the market dynamics. Large aircraft companies like Boeing and Airbus are critical in advancing technology.

United Technologies Corporation, Parker Hannifin Corporation, and Safran add diverse aviation hydraulic system market capabilities. Eaton Corporation, Liebherr Group, and Honeywell International Inc. help advance aircraft hydraulic systems by bringing their distinct advantages to the competitive mix. Two prominent aircraft hydraulic system vendors that demonstrate their ability to deliver innovative solutions are Triumph Group and Moog Inc.

Notable Strides

Company Details
AMETEK Inc. AMETEK, Inc. declared in December 2023 that it had successfully acquired Paragon Medical, a prominent supplier of highly engineered medical equipment and components, from American Securities LLC affiliates. The transaction was valued at USD 1.9 billion. With USD 500 million in yearly sales, Paragon becomes a member of AMETEK's Electromechanical Group, which provides automated systems, thermal management, and engineered solutions.
Arkwin Industries Inc. As the sole global aftermarket dealer for rotary wing systems, Arkwin teams up with S3 Aero Defense in June 2023.
A&P Hydraulics A new Series 920 Universal Independent Dual System Hydraulic Test Stand was purchased by Certified Aviation Services, LLC (CAS) in February of 2021. A&P Hydraulics, headquartered in Landrum, South Carolina, produces the Series 920 stand.
Arkwin Industries Inc. Arkwin Industries, Inc. appointed AAR Supply Chain, Inc. in September 2021 as its official worldwide distributor for aftermarket parts for business jets, turboprops, and commercial transport airplanes. By partnering with AAR to handle global customer needs, including a product exchange program for GE engine actuation devices, this relationship improves Arkwin's aftermarket service capabilities as of October 1, 2021.

Key Producers of Aircraft Hydraulic Systems

  • Arkwin Industries, Inc.
  • Eaton Corporation plc
  • HYCOM
  • Liebherr-International Deutschland GmbH
  • Moog Inc.
  • PARKER HANNIFIN CORP
  • Safran S.A.
  • Senior plc
  • Triumph Group
  • Woodward, Inc.

Key Segments Studied in the Aircraft Hydraulic System Market

By Product:

  • Reservoirs
  • Pumps
  • Valves
  • Hydraulic fuses
  • Accumulators
  • Actuators
  • Others

By Fluid Type:

  • Vegetable-based
  • Mineral-based
  • Synthetic-based

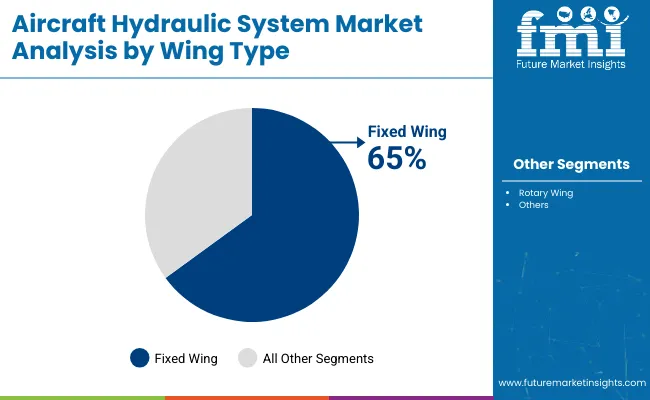
By Wing Type:

  • Fixed Wing
  • Rotary Wing

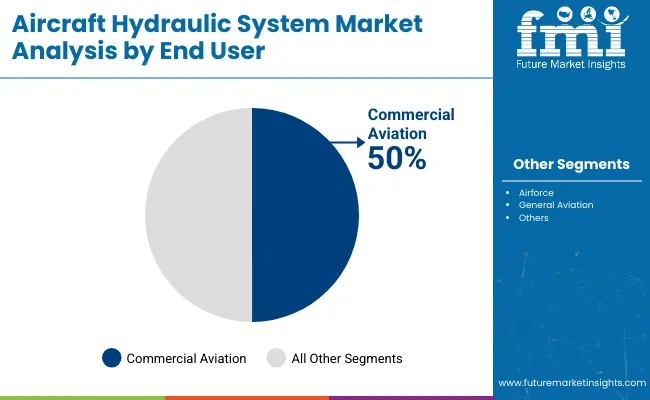
By End User:

  • Airforce
  • General Aviation
  • Commercial Aviation

By Region:

  • North America
  • Europe
  • Asia Pacific
  • The Middle East Asia
  • Latin America

Table of Content

  • 1. Executive Summary
  • 2. Market Overview
  • 3. Market Background
  • 4. Global Market Analysis 2019 to 2023 and Forecast, 2024 to 2034
  • 5. Global Market Analysis 2019 to 2023 and Forecast 2024 to 2034, By Product
    • 5.1. Reservoirs
    • 5.2. Pumps
    • 5.3. Valves
    • 5.4. Hydraulic fuses
    • 5.5. Accumulators
    • 5.6. Actuators
    • 5.7. Others
  • 6. Global Market Analysis 2019 to 2023 and Forecast 2024 to 2034, By Fluid Type
    • 6.1. Vegetable-based
    • 6.2. Mineral-based
    • 6.3. Synthetic-based
  • 7. Global Market Analysis 2019 to 2023 and Forecast 2024 to 2034, By Wing Type
    • 7.1. Fixed Wing
    • 7.2. Rotary Wing
  • 8. Global Market Analysis 2019 to 2023 and Forecast 2024 to 2034, By End User
    • 8.1. Air force
    • 8.2. General Aviation
    • 8.3. Commercial Aviation
  • 9. Global Market Analysis 2019 to 2023 and Forecast 2024 to 2034, By Region
    • 9.1. North America
    • 9.2. Latin America
    • 9.3. Western Europe
    • 9.4. Eastern Europe
    • 9.5. South Asia and Pacific
    • 9.6. East Asia
    • 9.7. Middle East and Africa
  • 10. North America Market Analysis 2019 to 2023 and Forecast 2024 to 2034, By Country
  • 11. Latin America Market Analysis 2019 to 2023 and Forecast 2024 to 2034, By Country
  • 12. Western Europe Market Analysis 2019 to 2023 and Forecast 2024 to 2034, By Country
  • 13. Eastern Europe Market Analysis 2019 to 2023 and Forecast 2024 to 2034, By Country
  • 14. South Asia and Pacific Market Analysis 2019 to 2023 and Forecast 2024 to 2034, By Country
  • 15. East Asia Market Analysis 2019 to 2023 and Forecast 2024 to 2034, By Country
  • 16. Middle East and Africa Market Analysis 2019 to 2023 and Forecast 2024 to 2034, By Country
  • 17. Key Countries Market Analysis
  • 18. Market Structure Analysis
  • 19. Competition Analysis
    • 19.1. Eaton Corporation PLC
    • 19.2. Arkwin Industries Inc
    • 19.3. Safran S.A
    • 19.4. United Technologies Corporation
    • 19.5. Moog Inc
    • 19.6. Beaver Aerospace & Defense
    • 19.7. Dynex/Rivett Inc
    • 19.8. Triumph Group
    • 19.9. Woodward, Inc
    • 19.10. Parker Hannifin Corporation
  • 20. Assumptions & Acronyms Used
  • 21. Research Methodology

List of Tables

Table 1: Global Market Value (US$ Million) Forecast by Region, 2019 to 2034

Table 2: Global Market Volume (Units) Forecast by Region, 2019 to 2034

Table 3: Global Market Value (US$ Million) Forecast by Product, 2019 to 2034

Table 4: Global Market Volume (Units) Forecast by Product, 2019 to 2034

Table 5: Global Market Value (US$ Million) Forecast by Fluid Type, 2019 to 2034

Table 6: Global Market Volume (Units) Forecast by Fluid Type, 2019 to 2034

Table 7: Global Market Value (US$ Million) Forecast by Wing Type, 2019 to 2034

Table 8: Global Market Volume (Units) Forecast by Wing Type, 2019 to 2034

Table 9: Global Market Value (US$ Million) Forecast by End User, 2019 to 2034

Table 10: Global Market Volume (Units) Forecast by End User, 2019 to 2034

Table 11: North America Market Value (US$ Million) Forecast by Country, 2019 to 2034

Table 12: North America Market Volume (Units) Forecast by Country, 2019 to 2034

Table 13: North America Market Value (US$ Million) Forecast by Product, 2019 to 2034

Table 14: North America Market Volume (Units) Forecast by Product, 2019 to 2034

Table 15: North America Market Value (US$ Million) Forecast by Fluid Type, 2019 to 2034

Table 16: North America Market Volume (Units) Forecast by Fluid Type, 2019 to 2034

Table 17: North America Market Value (US$ Million) Forecast by Wing Type, 2019 to 2034

Table 18: North America Market Volume (Units) Forecast by Wing Type, 2019 to 2034

Table 19: North America Market Value (US$ Million) Forecast by End User, 2019 to 2034

Table 20: North America Market Volume (Units) Forecast by End User, 2019 to 2034

Table 21: Latin America Market Value (US$ Million) Forecast by Country, 2019 to 2034

Table 22: Latin America Market Volume (Units) Forecast by Country, 2019 to 2034

Table 23: Latin America Market Value (US$ Million) Forecast by Product, 2019 to 2034

Table 24: Latin America Market Volume (Units) Forecast by Product, 2019 to 2034

Table 25: Latin America Market Value (US$ Million) Forecast by Fluid Type, 2019 to 2034

Table 26: Latin America Market Volume (Units) Forecast by Fluid Type, 2019 to 2034

Table 27: Latin America Market Value (US$ Million) Forecast by Wing Type, 2019 to 2034

Table 28: Latin America Market Volume (Units) Forecast by Wing Type, 2019 to 2034

Table 29: Latin America Market Value (US$ Million) Forecast by End User, 2019 to 2034

Table 30: Latin America Market Volume (Units) Forecast by End User, 2019 to 2034

Table 31: Western Europe Market Value (US$ Million) Forecast by Country, 2019 to 2034

Table 32: Western Europe Market Volume (Units) Forecast by Country, 2019 to 2034

Table 33: Western Europe Market Value (US$ Million) Forecast by Product, 2019 to 2034

Table 34: Western Europe Market Volume (Units) Forecast by Product, 2019 to 2034

Table 35: Western Europe Market Value (US$ Million) Forecast by Fluid Type, 2019 to 2034

Table 36: Western Europe Market Volume (Units) Forecast by Fluid Type, 2019 to 2034

Table 37: Western Europe Market Value (US$ Million) Forecast by Wing Type, 2019 to 2034

Table 38: Western Europe Market Volume (Units) Forecast by Wing Type, 2019 to 2034

Table 39: Western Europe Market Value (US$ Million) Forecast by End User, 2019 to 2034

Table 40: Western Europe Market Volume (Units) Forecast by End User, 2019 to 2034

Table 41: Eastern Europe Market Value (US$ Million) Forecast by Country, 2019 to 2034

Table 42: Eastern Europe Market Volume (Units) Forecast by Country, 2019 to 2034

Table 43: Eastern Europe Market Value (US$ Million) Forecast by Product, 2019 to 2034

Table 44: Eastern Europe Market Volume (Units) Forecast by Product, 2019 to 2034

Table 45: Eastern Europe Market Value (US$ Million) Forecast by Fluid Type, 2019 to 2034

Table 46: Eastern Europe Market Volume (Units) Forecast by Fluid Type, 2019 to 2034

Table 47: Eastern Europe Market Value (US$ Million) Forecast by Wing Type, 2019 to 2034

Table 48: Eastern Europe Market Volume (Units) Forecast by Wing Type, 2019 to 2034

Table 49: Eastern Europe Market Value (US$ Million) Forecast by End User, 2019 to 2034

Table 50: Eastern Europe Market Volume (Units) Forecast by End User, 2019 to 2034

Table 51: South Asia and Pacific Market Value (US$ Million) Forecast by Country, 2019 to 2034

Table 52: South Asia and Pacific Market Volume (Units) Forecast by Country, 2019 to 2034

Table 53: South Asia and Pacific Market Value (US$ Million) Forecast by Product, 2019 to 2034

Table 54: South Asia and Pacific Market Volume (Units) Forecast by Product, 2019 to 2034

Table 55: South Asia and Pacific Market Value (US$ Million) Forecast by Fluid Type, 2019 to 2034

Table 56: South Asia and Pacific Market Volume (Units) Forecast by Fluid Type, 2019 to 2034

Table 57: South Asia and Pacific Market Value (US$ Million) Forecast by Wing Type, 2019 to 2034

Table 58: South Asia and Pacific Market Volume (Units) Forecast by Wing Type, 2019 to 2034

Table 59: South Asia and Pacific Market Value (US$ Million) Forecast by End User, 2019 to 2034

Table 60: South Asia and Pacific Market Volume (Units) Forecast by End User, 2019 to 2034

Table 61: East Asia Market Value (US$ Million) Forecast by Country, 2019 to 2034

Table 62: East Asia Market Volume (Units) Forecast by Country, 2019 to 2034

Table 63: East Asia Market Value (US$ Million) Forecast by Product, 2019 to 2034

Table 64: East Asia Market Volume (Units) Forecast by Product, 2019 to 2034

Table 65: East Asia Market Value (US$ Million) Forecast by Fluid Type, 2019 to 2034

Table 66: East Asia Market Volume (Units) Forecast by Fluid Type, 2019 to 2034

Table 67: East Asia Market Value (US$ Million) Forecast by Wing Type, 2019 to 2034

Table 68: East Asia Market Volume (Units) Forecast by Wing Type, 2019 to 2034

Table 69: East Asia Market Value (US$ Million) Forecast by End User, 2019 to 2034

Table 70: East Asia Market Volume (Units) Forecast by End User, 2019 to 2034

Table 71: Middle East and Africa Market Value (US$ Million) Forecast by Country, 2019 to 2034

Table 72: Middle East and Africa Market Volume (Units) Forecast by Country, 2019 to 2034

Table 73: Middle East and Africa Market Value (US$ Million) Forecast by Product, 2019 to 2034

Table 74: Middle East and Africa Market Volume (Units) Forecast by Product, 2019 to 2034

Table 75: Middle East and Africa Market Value (US$ Million) Forecast by Fluid Type, 2019 to 2034

Table 76: Middle East and Africa Market Volume (Units) Forecast by Fluid Type, 2019 to 2034

Table 77: Middle East and Africa Market Value (US$ Million) Forecast by Wing Type, 2019 to 2034

Table 78: Middle East and Africa Market Volume (Units) Forecast by Wing Type, 2019 to 2034

Table 79: Middle East and Africa Market Value (US$ Million) Forecast by End User, 2019 to 2034

Table 80: Middle East and Africa Market Volume (Units) Forecast by End User, 2019 to 2034

List of Figures

Figure 1: Global Market Value (US$ Million) by Product, 2024 to 2034

Figure 2: Global Market Value (US$ Million) by Fluid Type, 2024 to 2034

Figure 3: Global Market Value (US$ Million) by Wing Type, 2024 to 2034

Figure 4: Global Market Value (US$ Million) by End User, 2024 to 2034

Figure 5: Global Market Value (US$ Million) by Region, 2024 to 2034

Figure 6: Global Market Value (US$ Million) Analysis by Region, 2019 to 2034

Figure 7: Global Market Volume (Units) Analysis by Region, 2019 to 2034

Figure 8: Global Market Value Share (%) and BPS Analysis by Region, 2024 to 2034

Figure 9: Global Market Y-o-Y Growth (%) Projections by Region, 2024 to 2034

Figure 10: Global Market Value (US$ Million) Analysis by Product, 2019 to 2034

Figure 11: Global Market Volume (Units) Analysis by Product, 2019 to 2034

Figure 12: Global Market Value Share (%) and BPS Analysis by Product, 2024 to 2034

Figure 13: Global Market Y-o-Y Growth (%) Projections by Product, 2024 to 2034

Figure 14: Global Market Value (US$ Million) Analysis by Fluid Type, 2019 to 2034

Figure 15: Global Market Volume (Units) Analysis by Fluid Type, 2019 to 2034

Figure 16: Global Market Value Share (%) and BPS Analysis by Fluid Type, 2024 to 2034

Figure 17: Global Market Y-o-Y Growth (%) Projections by Fluid Type, 2024 to 2034

Figure 18: Global Market Value (US$ Million) Analysis by Wing Type, 2019 to 2034

Figure 19: Global Market Volume (Units) Analysis by Wing Type, 2019 to 2034

Figure 20: Global Market Value Share (%) and BPS Analysis by Wing Type, 2024 to 2034

Figure 21: Global Market Y-o-Y Growth (%) Projections by Wing Type, 2024 to 2034

Figure 22: Global Market Value (US$ Million) Analysis by End User, 2019 to 2034

Figure 23: Global Market Volume (Units) Analysis by End User, 2019 to 2034

Figure 24: Global Market Value Share (%) and BPS Analysis by End User, 2024 to 2034

Figure 25: Global Market Y-o-Y Growth (%) Projections by End User, 2024 to 2034

Figure 26: Global Market Attractiveness by Product, 2024 to 2034

Figure 27: Global Market Attractiveness by Fluid Type, 2024 to 2034

Figure 28: Global Market Attractiveness by Wing Type, 2024 to 2034

Figure 29: Global Market Attractiveness by End User, 2024 to 2034

Figure 30: Global Market Attractiveness by Region, 2024 to 2034

Figure 31: North America Market Value (US$ Million) by Product, 2024 to 2034

Figure 32: North America Market Value (US$ Million) by Fluid Type, 2024 to 2034

Figure 33: North America Market Value (US$ Million) by Wing Type, 2024 to 2034

Figure 34: North America Market Value (US$ Million) by End User, 2024 to 2034

Figure 35: North America Market Value (US$ Million) by Country, 2024 to 2034

Figure 36: North America Market Value (US$ Million) Analysis by Country, 2019 to 2034

Figure 37: North America Market Volume (Units) Analysis by Country, 2019 to 2034

Figure 38: North America Market Value Share (%) and BPS Analysis by Country, 2024 to 2034

Figure 39: North America Market Y-o-Y Growth (%) Projections by Country, 2024 to 2034

Figure 40: North America Market Value (US$ Million) Analysis by Product, 2019 to 2034

Figure 41: North America Market Volume (Units) Analysis by Product, 2019 to 2034

Figure 42: North America Market Value Share (%) and BPS Analysis by Product, 2024 to 2034

Figure 43: North America Market Y-o-Y Growth (%) Projections by Product, 2024 to 2034

Figure 44: North America Market Value (US$ Million) Analysis by Fluid Type, 2019 to 2034

Figure 45: North America Market Volume (Units) Analysis by Fluid Type, 2019 to 2034

Figure 46: North America Market Value Share (%) and BPS Analysis by Fluid Type, 2024 to 2034

Figure 47: North America Market Y-o-Y Growth (%) Projections by Fluid Type, 2024 to 2034

Figure 48: North America Market Value (US$ Million) Analysis by Wing Type, 2019 to 2034

Figure 49: North America Market Volume (Units) Analysis by Wing Type, 2019 to 2034

Figure 50: North America Market Value Share (%) and BPS Analysis by Wing Type, 2024 to 2034

Figure 51: North America Market Y-o-Y Growth (%) Projections by Wing Type, 2024 to 2034

Figure 52: North America Market Value (US$ Million) Analysis by End User, 2019 to 2034

Figure 53: North America Market Volume (Units) Analysis by End User, 2019 to 2034

Figure 54: North America Market Value Share (%) and BPS Analysis by End User, 2024 to 2034

Figure 55: North America Market Y-o-Y Growth (%) Projections by End User, 2024 to 2034

Figure 56: North America Market Attractiveness by Product, 2024 to 2034

Figure 57: North America Market Attractiveness by Fluid Type, 2024 to 2034

Figure 58: North America Market Attractiveness by Wing Type, 2024 to 2034

Figure 59: North America Market Attractiveness by End User, 2024 to 2034

Figure 60: North America Market Attractiveness by Country, 2024 to 2034

Figure 61: Latin America Market Value (US$ Million) by Product, 2024 to 2034

Figure 62: Latin America Market Value (US$ Million) by Fluid Type, 2024 to 2034

Figure 63: Latin America Market Value (US$ Million) by Wing Type, 2024 to 2034

Figure 64: Latin America Market Value (US$ Million) by End User, 2024 to 2034

Figure 65: Latin America Market Value (US$ Million) by Country, 2024 to 2034

Figure 66: Latin America Market Value (US$ Million) Analysis by Country, 2019 to 2034

Figure 67: Latin America Market Volume (Units) Analysis by Country, 2019 to 2034

Figure 68: Latin America Market Value Share (%) and BPS Analysis by Country, 2024 to 2034

Figure 69: Latin America Market Y-o-Y Growth (%) Projections by Country, 2024 to 2034

Figure 70: Latin America Market Value (US$ Million) Analysis by Product, 2019 to 2034

Figure 71: Latin America Market Volume (Units) Analysis by Product, 2019 to 2034

Figure 72: Latin America Market Value Share (%) and BPS Analysis by Product, 2024 to 2034

Figure 73: Latin America Market Y-o-Y Growth (%) Projections by Product, 2024 to 2034

Figure 74: Latin America Market Value (US$ Million) Analysis by Fluid Type, 2019 to 2034

Figure 75: Latin America Market Volume (Units) Analysis by Fluid Type, 2019 to 2034

Figure 76: Latin America Market Value Share (%) and BPS Analysis by Fluid Type, 2024 to 2034

Figure 77: Latin America Market Y-o-Y Growth (%) Projections by Fluid Type, 2024 to 2034

Figure 78: Latin America Market Value (US$ Million) Analysis by Wing Type, 2019 to 2034

Figure 79: Latin America Market Volume (Units) Analysis by Wing Type, 2019 to 2034

Figure 80: Latin America Market Value Share (%) and BPS Analysis by Wing Type, 2024 to 2034

Figure 81: Latin America Market Y-o-Y Growth (%) Projections by Wing Type, 2024 to 2034

Figure 82: Latin America Market Value (US$ Million) Analysis by End User, 2019 to 2034

Figure 83: Latin America Market Volume (Units) Analysis by End User, 2019 to 2034

Figure 84: Latin America Market Value Share (%) and BPS Analysis by End User, 2024 to 2034

Figure 85: Latin America Market Y-o-Y Growth (%) Projections by End User, 2024 to 2034

Figure 86: Latin America Market Attractiveness by Product, 2024 to 2034

Figure 87: Latin America Market Attractiveness by Fluid Type, 2024 to 2034

Figure 88: Latin America Market Attractiveness by Wing Type, 2024 to 2034

Figure 89: Latin America Market Attractiveness by End User, 2024 to 2034

Figure 90: Latin America Market Attractiveness by Country, 2024 to 2034

Figure 91: Western Europe Market Value (US$ Million) by Product, 2024 to 2034

Figure 92: Western Europe Market Value (US$ Million) by Fluid Type, 2024 to 2034

Figure 93: Western Europe Market Value (US$ Million) by Wing Type, 2024 to 2034

Figure 94: Western Europe Market Value (US$ Million) by End User, 2024 to 2034

Figure 95: Western Europe Market Value (US$ Million) by Country, 2024 to 2034

Figure 96: Western Europe Market Value (US$ Million) Analysis by Country, 2019 to 2034

Figure 97: Western Europe Market Volume (Units) Analysis by Country, 2019 to 2034

Figure 98: Western Europe Market Value Share (%) and BPS Analysis by Country, 2024 to 2034

Figure 99: Western Europe Market Y-o-Y Growth (%) Projections by Country, 2024 to 2034

Figure 100: Western Europe Market Value (US$ Million) Analysis by Product, 2019 to 2034

Figure 101: Western Europe Market Volume (Units) Analysis by Product, 2019 to 2034

Figure 102: Western Europe Market Value Share (%) and BPS Analysis by Product, 2024 to 2034

Figure 103: Western Europe Market Y-o-Y Growth (%) Projections by Product, 2024 to 2034

Figure 104: Western Europe Market Value (US$ Million) Analysis by Fluid Type, 2019 to 2034

Figure 105: Western Europe Market Volume (Units) Analysis by Fluid Type, 2019 to 2034

Figure 106: Western Europe Market Value Share (%) and BPS Analysis by Fluid Type, 2024 to 2034

Figure 107: Western Europe Market Y-o-Y Growth (%) Projections by Fluid Type, 2024 to 2034

Figure 108: Western Europe Market Value (US$ Million) Analysis by Wing Type, 2019 to 2034

Figure 109: Western Europe Market Volume (Units) Analysis by Wing Type, 2019 to 2034

Figure 110: Western Europe Market Value Share (%) and BPS Analysis by Wing Type, 2024 to 2034

Figure 111: Western Europe Market Y-o-Y Growth (%) Projections by Wing Type, 2024 to 2034

Figure 112: Western Europe Market Value (US$ Million) Analysis by End User, 2019 to 2034

Figure 113: Western Europe Market Volume (Units) Analysis by End User, 2019 to 2034

Figure 114: Western Europe Market Value Share (%) and BPS Analysis by End User, 2024 to 2034

Figure 115: Western Europe Market Y-o-Y Growth (%) Projections by End User, 2024 to 2034

Figure 116: Western Europe Market Attractiveness by Product, 2024 to 2034

Figure 117: Western Europe Market Attractiveness by Fluid Type, 2024 to 2034

Figure 118: Western Europe Market Attractiveness by Wing Type, 2024 to 2034

Figure 119: Western Europe Market Attractiveness by End User, 2024 to 2034

Figure 120: Western Europe Market Attractiveness by Country, 2024 to 2034

Figure 121: Eastern Europe Market Value (US$ Million) by Product, 2024 to 2034

Figure 122: Eastern Europe Market Value (US$ Million) by Fluid Type, 2024 to 2034

Figure 123: Eastern Europe Market Value (US$ Million) by Wing Type, 2024 to 2034

Figure 124: Eastern Europe Market Value (US$ Million) by End User, 2024 to 2034

Figure 125: Eastern Europe Market Value (US$ Million) by Country, 2024 to 2034

Figure 126: Eastern Europe Market Value (US$ Million) Analysis by Country, 2019 to 2034

Figure 127: Eastern Europe Market Volume (Units) Analysis by Country, 2019 to 2034

Figure 128: Eastern Europe Market Value Share (%) and BPS Analysis by Country, 2024 to 2034

Figure 129: Eastern Europe Market Y-o-Y Growth (%) Projections by Country, 2024 to 2034

Figure 130: Eastern Europe Market Value (US$ Million) Analysis by Product, 2019 to 2034

Figure 131: Eastern Europe Market Volume (Units) Analysis by Product, 2019 to 2034

Figure 132: Eastern Europe Market Value Share (%) and BPS Analysis by Product, 2024 to 2034

Figure 133: Eastern Europe Market Y-o-Y Growth (%) Projections by Product, 2024 to 2034

Figure 134: Eastern Europe Market Value (US$ Million) Analysis by Fluid Type, 2019 to 2034

Figure 135: Eastern Europe Market Volume (Units) Analysis by Fluid Type, 2019 to 2034

Figure 136: Eastern Europe Market Value Share (%) and BPS Analysis by Fluid Type, 2024 to 2034

Figure 137: Eastern Europe Market Y-o-Y Growth (%) Projections by Fluid Type, 2024 to 2034

Figure 138: Eastern Europe Market Value (US$ Million) Analysis by Wing Type, 2019 to 2034

Figure 139: Eastern Europe Market Volume (Units) Analysis by Wing Type, 2019 to 2034

Figure 140: Eastern Europe Market Value Share (%) and BPS Analysis by Wing Type, 2024 to 2034

Figure 141: Eastern Europe Market Y-o-Y Growth (%) Projections by Wing Type, 2024 to 2034

Figure 142: Eastern Europe Market Value (US$ Million) Analysis by End User, 2019 to 2034

Figure 143: Eastern Europe Market Volume (Units) Analysis by End User, 2019 to 2034

Figure 144: Eastern Europe Market Value Share (%) and BPS Analysis by End User, 2024 to 2034

Figure 145: Eastern Europe Market Y-o-Y Growth (%) Projections by End User, 2024 to 2034

Figure 146: Eastern Europe Market Attractiveness by Product, 2024 to 2034

Figure 147: Eastern Europe Market Attractiveness by Fluid Type, 2024 to 2034

Figure 148: Eastern Europe Market Attractiveness by Wing Type, 2024 to 2034

Figure 149: Eastern Europe Market Attractiveness by End User, 2024 to 2034

Figure 150: Eastern Europe Market Attractiveness by Country, 2024 to 2034

Figure 151: South Asia and Pacific Market Value (US$ Million) by Product, 2024 to 2034

Figure 152: South Asia and Pacific Market Value (US$ Million) by Fluid Type, 2024 to 2034

Figure 153: South Asia and Pacific Market Value (US$ Million) by Wing Type, 2024 to 2034

Figure 154: South Asia and Pacific Market Value (US$ Million) by End User, 2024 to 2034

Figure 155: South Asia and Pacific Market Value (US$ Million) by Country, 2024 to 2034

Figure 156: South Asia and Pacific Market Value (US$ Million) Analysis by Country, 2019 to 2034

Figure 157: South Asia and Pacific Market Volume (Units) Analysis by Country, 2019 to 2034

Figure 158: South Asia and Pacific Market Value Share (%) and BPS Analysis by Country, 2024 to 2034

Figure 159: South Asia and Pacific Market Y-o-Y Growth (%) Projections by Country, 2024 to 2034

Figure 160: South Asia and Pacific Market Value (US$ Million) Analysis by Product, 2019 to 2034

Figure 161: South Asia and Pacific Market Volume (Units) Analysis by Product, 2019 to 2034

Figure 162: South Asia and Pacific Market Value Share (%) and BPS Analysis by Product, 2024 to 2034

Figure 163: South Asia and Pacific Market Y-o-Y Growth (%) Projections by Product, 2024 to 2034

Figure 164: South Asia and Pacific Market Value (US$ Million) Analysis by Fluid Type, 2019 to 2034

Figure 165: South Asia and Pacific Market Volume (Units) Analysis by Fluid Type, 2019 to 2034

Figure 166: South Asia and Pacific Market Value Share (%) and BPS Analysis by Fluid Type, 2024 to 2034

Figure 167: South Asia and Pacific Market Y-o-Y Growth (%) Projections by Fluid Type, 2024 to 2034

Figure 168: South Asia and Pacific Market Value (US$ Million) Analysis by Wing Type, 2019 to 2034

Figure 169: South Asia and Pacific Market Volume (Units) Analysis by Wing Type, 2019 to 2034

Figure 170: South Asia and Pacific Market Value Share (%) and BPS Analysis by Wing Type, 2024 to 2034

Figure 171: South Asia and Pacific Market Y-o-Y Growth (%) Projections by Wing Type, 2024 to 2034

Figure 172: South Asia and Pacific Market Value (US$ Million) Analysis by End User, 2019 to 2034

Figure 173: South Asia and Pacific Market Volume (Units) Analysis by End User, 2019 to 2034

Figure 174: South Asia and Pacific Market Value Share (%) and BPS Analysis by End User, 2024 to 2034

Figure 175: South Asia and Pacific Market Y-o-Y Growth (%) Projections by End User, 2024 to 2034

Figure 176: South Asia and Pacific Market Attractiveness by Product, 2024 to 2034

Figure 177: South Asia and Pacific Market Attractiveness by Fluid Type, 2024 to 2034

Figure 178: South Asia and Pacific Market Attractiveness by Wing Type, 2024 to 2034

Figure 179: South Asia and Pacific Market Attractiveness by End User, 2024 to 2034

Figure 180: South Asia and Pacific Market Attractiveness by Country, 2024 to 2034

Figure 181: East Asia Market Value (US$ Million) by Product, 2024 to 2034

Figure 182: East Asia Market Value (US$ Million) by Fluid Type, 2024 to 2034

Figure 183: East Asia Market Value (US$ Million) by Wing Type, 2024 to 2034

Figure 184: East Asia Market Value (US$ Million) by End User, 2024 to 2034

Figure 185: East Asia Market Value (US$ Million) by Country, 2024 to 2034

Figure 186: East Asia Market Value (US$ Million) Analysis by Country, 2019 to 2034

Figure 187: East Asia Market Volume (Units) Analysis by Country, 2019 to 2034

Figure 188: East Asia Market Value Share (%) and BPS Analysis by Country, 2024 to 2034

Figure 189: East Asia Market Y-o-Y Growth (%) Projections by Country, 2024 to 2034

Figure 190: East Asia Market Value (US$ Million) Analysis by Product, 2019 to 2034

Figure 191: East Asia Market Volume (Units) Analysis by Product, 2019 to 2034

Figure 192: East Asia Market Value Share (%) and BPS Analysis by Product, 2024 to 2034

Figure 193: East Asia Market Y-o-Y Growth (%) Projections by Product, 2024 to 2034

Figure 194: East Asia Market Value (US$ Million) Analysis by Fluid Type, 2019 to 2034

Figure 195: East Asia Market Volume (Units) Analysis by Fluid Type, 2019 to 2034

Figure 196: East Asia Market Value Share (%) and BPS Analysis by Fluid Type, 2024 to 2034

Figure 197: East Asia Market Y-o-Y Growth (%) Projections by Fluid Type, 2024 to 2034

Figure 198: East Asia Market Value (US$ Million) Analysis by Wing Type, 2019 to 2034

Figure 199: East Asia Market Volume (Units) Analysis by Wing Type, 2019 to 2034

Figure 200: East Asia Market Value Share (%) and BPS Analysis by Wing Type, 2024 to 2034

Figure 201: East Asia Market Y-o-Y Growth (%) Projections by Wing Type, 2024 to 2034

Figure 202: East Asia Market Value (US$ Million) Analysis by End User, 2019 to 2034

Figure 203: East Asia Market Volume (Units) Analysis by End User, 2019 to 2034

Figure 204: East Asia Market Value Share (%) and BPS Analysis by End User, 2024 to 2034

Figure 205: East Asia Market Y-o-Y Growth (%) Projections by End User, 2024 to 2034

Figure 206: East Asia Market Attractiveness by Product, 2024 to 2034

Figure 207: East Asia Market Attractiveness by Fluid Type, 2024 to 2034

Figure 208: East Asia Market Attractiveness by Wing Type, 2024 to 2034

Figure 209: East Asia Market Attractiveness by End User, 2024 to 2034

Figure 210: East Asia Market Attractiveness by Country, 2024 to 2034

Figure 211: Middle East and Africa Market Value (US$ Million) by Product, 2024 to 2034

Figure 212: Middle East and Africa Market Value (US$ Million) by Fluid Type, 2024 to 2034

Figure 213: Middle East and Africa Market Value (US$ Million) by Wing Type, 2024 to 2034

Figure 214: Middle East and Africa Market Value (US$ Million) by End User, 2024 to 2034

Figure 215: Middle East and Africa Market Value (US$ Million) by Country, 2024 to 2034

Figure 216: Middle East and Africa Market Value (US$ Million) Analysis by Country, 2019 to 2034

Figure 217: Middle East and Africa Market Volume (Units) Analysis by Country, 2019 to 2034

Figure 218: Middle East and Africa Market Value Share (%) and BPS Analysis by Country, 2024 to 2034

Figure 219: Middle East and Africa Market Y-o-Y Growth (%) Projections by Country, 2024 to 2034

Figure 220: Middle East and Africa Market Value (US$ Million) Analysis by Product, 2019 to 2034

Figure 221: Middle East and Africa Market Volume (Units) Analysis by Product, 2019 to 2034

Figure 222: Middle East and Africa Market Value Share (%) and BPS Analysis by Product, 2024 to 2034

Figure 223: Middle East and Africa Market Y-o-Y Growth (%) Projections by Product, 2024 to 2034

Figure 224: Middle East and Africa Market Value (US$ Million) Analysis by Fluid Type, 2019 to 2034

Figure 225: Middle East and Africa Market Volume (Units) Analysis by Fluid Type, 2019 to 2034

Figure 226: Middle East and Africa Market Value Share (%) and BPS Analysis by Fluid Type, 2024 to 2034

Figure 227: Middle East and Africa Market Y-o-Y Growth (%) Projections by Fluid Type, 2024 to 2034

Figure 228: Middle East and Africa Market Value (US$ Million) Analysis by Wing Type, 2019 to 2034

Figure 229: Middle East and Africa Market Volume (Units) Analysis by Wing Type, 2019 to 2034

Figure 230: Middle East and Africa Market Value Share (%) and BPS Analysis by Wing Type, 2024 to 2034

Figure 231: Middle East and Africa Market Y-o-Y Growth (%) Projections by Wing Type, 2024 to 2034

Figure 232: Middle East and Africa Market Value (US$ Million) Analysis by End User, 2019 to 2034

Figure 233: Middle East and Africa Market Volume (Units) Analysis by End User, 2019 to 2034

Figure 234: Middle East and Africa Market Value Share (%) and BPS Analysis by End User, 2024 to 2034

Figure 235: Middle East and Africa Market Y-o-Y Growth (%) Projections by End User, 2024 to 2034

Figure 236: Middle East and Africa Market Attractiveness by Product, 2024 to 2034

Figure 237: Middle East and Africa Market Attractiveness by Fluid Type, 2024 to 2034

Figure 238: Middle East and Africa Market Attractiveness by Wing Type, 2024 to 2034

Figure 239: Middle East and Africa Market Attractiveness by End User, 2024 to 2034

Figure 240: Middle East and Africa Market Attractiveness by Country, 2024 to 2034

Frequently Asked Questions

What is the Current Aircraft Hydraulic System Market Valuation?

The aviation hydraulic system market to secure a valuation of USD 12.6 billion in 2024.

How Big Can the Aircraft Hydraulic System Market Be by 2034?

The airplane hydraulic system market is estimated to reach USD 25.9 billion by 2034.

What is the Growth Potential of the Aircraft Hydraulic System Market?

Through 2034, the aircraft hydraulic system industry is anticipated to expand at an 11.8% CAGR.

What Was the Historical Outlook of the Aircraft Hydraulic System Market?

From 2019 to 2023, the aircraft hydraulic technology market recorded a 15.5% HCAGR.

Which Product Segment to Dominate in the Aircraft Hydraulic System Market?

The reservoir sector is likely to exhibit a CAGR of 11.60% between 2024 and 2034.

Which Fluid Type Segment to Lead the Aircraft Hydraulic System Market?

The vegetable-based sector is anticipated to accelerate at a CAGR of 11.4% from 2024 to 2034.

Explore Aerospace Insights

Future Market Insights

Aircraft Hydraulic System Market