The MENASA Commercial Vehicle Market is estimated to be valued at USD 363.3 million in 2025 and is projected to reach USD 723.1 million by 2035, registering a compound annual growth rate (CAGR) of 7.1% over the forecast period.
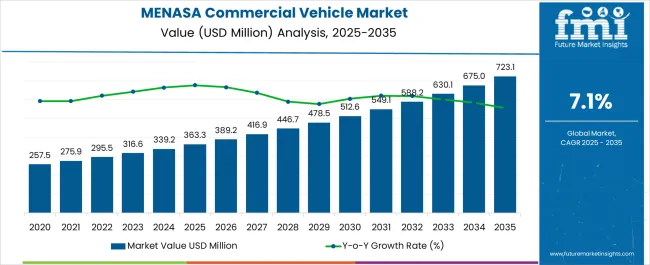
| Metric | Value |
|---|---|
| MENASA Commercial Vehicle Market Estimated Value in (2025 E) | USD 363.3 million |
| MENASA Commercial Vehicle Market Forecast Value in (2035 F) | USD 723.1 million |
| Forecast CAGR (2025 to 2035) | 7.1% |
The MENASA commercial vehicle market is witnessing steady expansion. Growth is being driven by increasing industrialization, urbanization, and the expansion of logistics and transportation networks across the region.
Current market dynamics are characterized by rising demand for efficient and durable commercial vehicles that can meet the needs of diverse sectors such as e-commerce, construction, and last-mile delivery. Regulatory frameworks focusing on safety standards and emissions compliance are influencing product development, while technological advancements in vehicle design, telematics, and fleet management are enhancing operational efficiency.
The future outlook is supported by infrastructure development, government incentives for commercial transportation, and increasing adoption of modern fleet solutions Growth rationale is anchored on the rising requirement for fuel-efficient and cost-effective vehicles, continued investments in regional transport infrastructure, and the need to meet evolving industrial and commercial logistics demands, collectively driving consistent market expansion and encouraging manufacturers to optimize product offerings to suit diverse operational requirements across MENASA countries.
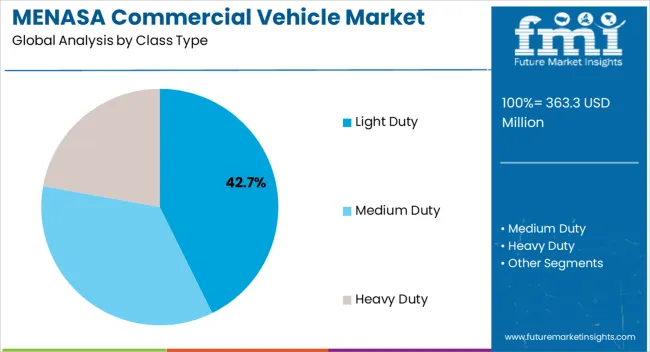
The light-duty segment, holding 42.70% of the class type category, has maintained its leading position due to its versatility in urban and semi-urban transport applications. Demand has been supported by the segment’s cost-effectiveness, fuel efficiency, and ease of maneuverability in congested city environments. Adoption has been reinforced by widespread use in last-mile delivery, small-scale logistics, and commercial services.
Technological improvements in suspension, safety features, and payload optimization have enhanced operational reliability. Fleet operators have preferred light-duty vehicles for their adaptability to diverse load requirements and reduced maintenance costs.
Regulatory compliance in key MENASA markets has further strengthened confidence in this segment Continuous investments in design enhancements, emission control technologies, and telematics integration are expected to sustain its market share and support incremental growth across regional commercial vehicle fleets.
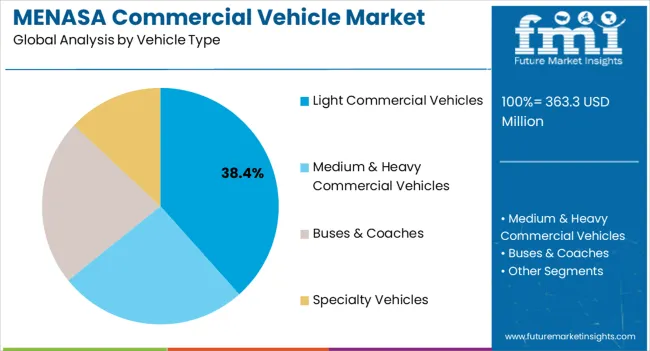
The light commercial vehicles segment, accounting for 38.40% of the vehicle type category, has been dominant due to its essential role in goods transportation and intra-city logistics operations. Market adoption has been driven by high demand from small and medium enterprises, retail distribution networks, and courier services.
Operational efficiency, reliability under varied load conditions, and cost-effective maintenance have reinforced preference among fleet operators. The segment’s growth has been facilitated by advancements in payload capacity, vehicle durability, and integration of telematics for route optimization and fuel monitoring.
Emerging urban centers with expanding commercial activity are further supporting demand Technological upgrades, combined with increasing fleet modernization initiatives, are expected to sustain the segment’s market share and promote long-term growth across the MENASA commercial vehicle landscape.
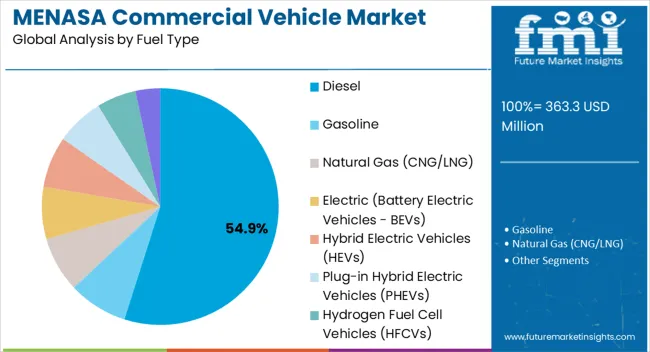
The diesel segment, representing 54.90% of the fuel type category, has remained the leading choice due to its high energy efficiency, cost-effectiveness, and compatibility with heavy usage in commercial operations. Adoption has been reinforced by diesel engines’ durability, torque performance, and suitability for long-distance transportation.
Availability of refueling infrastructure across MENASA countries has further supported market preference. Operational reliability under varied climatic and road conditions has ensured sustained demand from fleet operators and logistics companies.
Ongoing improvements in emission control and compliance with regional environmental regulations have enhanced segment acceptance Continued reliance on diesel for commercial transport, particularly in high-load and long-haul applications, is expected to maintain the segment’s market share and contribute to overall market growth.
India Remains at the Epicenter of Growth in MENASA
India is becoming an ideal destination for commercial vehicle manufacturers. This is due to rising usage of commercial vehicles in a wide variety of applications, including public transportation, retail & e-commerce freight, and bulk freight handling.
Public Transport: The country's diverse demands for public transport depend heavily on commercial vehicles. These vehicles offer essential connections for a variety of urban mobility solutions, from inter-city alternatives like cabs to intra-city transit solutions like buses. Given India's rapidly growing population and urbanization, commercial vehicles are essential to meeting the country's expanding need for accessible and effective passenger transportation options.
Medium Duty Vehicles Dominate While Light Duty Ones will Witness Higher Demand
As per the report, medium duty commercial vehicles are expected to dominate the MENASA commercial vehicle industry with a volume share of about 48.3% in 2025. This is attributable to the rising usage of medium duty vehicles for goods transportation due to their effective & quick features.
Medium-duty vehicles have become highly popular in emerging nations, including India and Turkiye. Due to their efficiency and adaptability, they are widely used for transporting goods like dairy items, medicines, agriculture products, raw materials, and oil and gas.
The adaptability of medium duty vehicles creates a balance between the strength to support heavy loads and the dexterity needed for rapid and effective transit. Growing preference for medium duty vehicles in the delivery of products like dairy items, medicine, and agriculture products is expected to boost the target segment.
On the other hand, light-duty vehicles are anticipated to witness a higher demand, rising at 8.6% CAGR during the forecast period. This is because they are more cost-effective and can be used in any geographical region.
The demand for commercial vehicles in MENASA is projected to rise rapidly, with a noteworthy emphasis on the medium-duty segment. The surge in demand for light duty & medium-duty commercial trucks is closely tied to the expanding logistics sector, notably in Middle Eastern nations.
Commercial vehicles are witnessing substantial demand from industries like construction, agriculture, medical, manufacturing, and petrochemicals. Hence, expansion of these industries will eventually bolster sales of commercial vehicles in MENASA.
The application of commercial vehicles in construction, mining, petrochemicals, and waste management industries is rapidly increasing. Their preference over other transportation vehicles is attributed to their productivity and versatility for the region's diverse pick-up and drop-off operations.
The rise of e-commerce and e-retail has led to increased productivity and cost-efficiency in the logistics sector. Automation, exemplified by initiatives in Saudi Arabia and the United Arab Emirates, is playing a crucial role in warehouse management systems. This trend, coupled with rising consumption, is expected to drive demand for material handling and lifting machines, including commercial vehicles.
Commercial vehicles play a pivotal role in the economies of the GCC (Gulf Cooperation Council) countries, including Bahrain, Saudi Arabia, and the United Arab Emirates, as well as in North Africa. In the GCC, these vehicles are extensively used in the construction sector to transport materials and heavy machinery, supporting the region's rapid urbanization.
Commercial vehicles also play a crucial role in the oil and gas industry for the transportation of crude oil and refined products. In North Africa, commercial vehicles find applications in agriculture, mining, trade, tourism, and construction, serving diverse economic activities and contributing to the region's development.
Sales of commercial vehicles in MENASA grew at a CAGR of 2.0% between 2020 and 2025. Total revenue reached about USD 363.3 billion at the end of 2025. In the assessment period, the commercial vehicle industry is set to thrive at a CAGR of 7.5%.
| Historical CAGR (2020 to 2025) | 2.0% |
|---|---|
| Forecast CAGR (2025 to 2035) | 7.5% |
Consistent demand for light and medium-duty vehicles, particularly for 4.5 T to 6.5 T capacity vehicles, was seen in the commercial vehicle industry during the historical period. These vehicles were employed for transporting emergency medical supplies during the COVID-19 pandemic.
Over the forecast period, the MENASA commercial vehicle sector is set to see a significant change totaling a valuation of USD 723.1.0 billion by 2035. This is attributable to growing need for commercial vehicles in the logistics, construction, and transportation sectors.
Increasing investments in public infrastructure projects across MENASA will positively impact commercial vehicle demand through 2035. Subsequently, increasing need for cost-effective and environmentally friendly means of transportation is expected to foster sales growth.
Rising Infrastructure Investment in the Middle East to Uplift Demand
The infrastructure sector is playing a crucial role in driving growth of the commercial automotive industry. This is due to growing importance of commercial vehicles in infrastructural development projects.
Saudi Arabia is investing rigorously in several infrastructure projects, elevating demand for commercial vehicles. For instance, it recently planned a massive program of infrastructure development.
Saudi Arabia’s Vision 2035, along with a significant investment in housing and infrastructure development, is revitalizing the transportation and construction industries. It is also generating interest among international commercial vehicle manufacturers to establish their facilities in the country.
The United Arab Emirates (UAE) is at the forefront of creating the modern skylines of the future. Transportation and road infrastructure development continues to be important across the country.
The United Arab Emirates has a number of transportation and road infrastructure projects currently in the pipeline, such as the USD 2.7 billion Sheikh Zayed double-deck road scheme. These massive infrastructure projects are expected to generate high demand for commercial vehicles.
Increased Private-public Partnerships Fostering Industry Growth
An important factor that is expected to have a significant impact on industry growth is the increase in private-public partnerships in the MENASA region. The fund allocated is more than a billion dollars, and this form of partnership is observed in almost every sector in the region, which is anticipated to drive the demand for commercial vehicles over the forecast period.
Factors such as population growth, rapid urbanization, and economic expansion are creating infrastructure demand across MENASA. This is putting pressure on governments to increase living standards and improve the business environment.
One main benefit of PPP is the transfer of certain risks to the counterparty in the private sector. Fixed-price, fixed-date construction contracts mean that the public authority should not face the risk of over-budget construction costs or the financial costs of delays. This key benefit is fueling the strong PPP over the forecast period through numerous transportation and energy infrastructure projects.
Multi-functional Characteristics of Commercial Vehicles Fueling their Demand
The use of commercial trucks, especially where manual transportation of materials and goods is impossible, is expected to create many opportunities for the target industry. These vehicles are very powerful and strong on any terrain. They have the capability to perform different tasks.
The multi-functional skills to perform all the tasks effectively and with increased accuracy will drive the commercial trucks industry throughout the forecast period. Moreover, even after the machine's life is over to perform heavy operations due to overloading of goods, the vehicle can still be used for odd jobs such as in agricultural fields and construction sites. This raises consumer attractiveness and supports industry expansion.
Soaring Government Regulations and Rules For Vehicles
Air pollution levels in the leading cities of the Middle East and North Africa (MENA) and South Asia regions are rising sharply. For instance, according to the World Health Organization (WHO), air pollution contributes to about 270,000 deaths annually, surpassing the combined fatalities from traffic accidents, diabetes, malaria, tuberculosis, HIV/AIDS, and acute hepatitis.
On average, residents in the MENA and South Asia regions experience at least 60 days of illness throughout their lifetime due to exposure to elevated air pollution levels. The primary culprits behind this alarming air pollution are commercial vehicles and trucks, emitting significant quantities of carbon monoxide, nitrogen oxides, and other pollutants into the atmosphere.
Transportation, especially from these vehicles, is responsible for more than half of the nitrogen oxides and carbon monoxide emissions, along with nearly a quarter of released hydrocarbons. This rising pollution level is prompting countries to implement strict rules and regulations, thereby restraining growth of the target industry.
Countries such as Iran, Oman, and the United Arab Emirates, where the automotive sector is strong, are grappling with escalating air pollution issues beyond manageable limits. To address this concern, authorities are encouraging using emission-free or low-emission vehicles as alternatives to mitigate pollution.
The proactive approach is aimed at promoting environmentally friendly transportation and reducing complications associated with prolonged exposure to air pollution. However, this will negatively impact the growth of the commercial vehicle industry during the forecast period.
Adoption of Used Cars in Africa
In Africa, several countries heavily import used or second-hand vehicles from OECD countries. The key barrier to new commercial vehicle sales in Africa is the rising import of cheap second-hand cars from the United States, Japan, and Europe.
Large numbers of imported cars in Ethiopia and Nigeria are used ones, which is the key cause of air pollution. At least 40% of Africa’s vehicle fleet is made up of used vehicles, some of which are obsolete with outdated technologies.
In several African countries, inflation is also surging the prices of new trucks, which in turn is pushing demand for used trucks. The availability of financing for new motor vehicles is virtually non-existent in most African countries, which support the used truck sector.
The table below highlights key countries’ commercial vehicle industry revenues. India, Thailand, and Turkiye are expected to remain the top three consumers of commercial vehicles, with anticipated valuations of USD 723.1 billion, USD 59.1 billion & USD 58.6 billion, respectively, in 2035.
| Countries | Projected Commercial Vehicle Industry Revenue (2035) |
|---|---|
| India | USD 723.1 billion |
| Turkiye | USD 59.1 billion |
| Thailand | USD 58.6 billion |
| Indonesia | USD 35.2 billion |
India’s commercial vehicle industry size is projected to reach USD 723.1 billion in 2035. Over the assessment period, demand for commercial vehicles in India is anticipated to increase at a CAGR of 6.9%.
Several factors are expected to drive the commercial vehicle industry in India. These include continuous economic growth, expanding industrialization, and ongoing infrastructure development.
The thriving e-commerce sector and the increasing needs of retail and manufacturing industries further bolster this demand. High adoption of commercial vehicles in these industries emphasizes their crucial role in ensuring efficient logistics and last-mile delivery services.
Government investments in road infrastructure projects and the continuous expansion of highways contribute significantly to sustaining the demand. The construction and mining sectors rely heavily on commercial vehicles to transport raw materials and heavy equipment.
The adaptability and versatility of commercial vehicles position them as essential contributors to India's dynamic and evolving economic landscape. As the nation moves swiftly towards progress, the importance of commercial vehicles is set to increase dramatically through 2035.
India is also home to several leading commercial vehicle manufacturers including Tata Motor Limited. These companies are striving to develop new cost-effective solutions to meet growing end user demand. Availability of several brands including Tata Motors commercial vehicles will improve India’s commercial vehicle industry share through 2035.
Sales of commercial vehicles in Thailand are projected to soar at a CAGR of around 5.5% during the assessment period. Total valuation in the country is anticipated to reach USD 58.6 billion by 2035.
Thailand is known for its thriving economy and strong manufacturing sector, which drives the country's constant need for an extensive range of commercial vehicles. These vehicles are essential to the logistics and transportation sector since they facilitate the smooth flow of goods and enable trade operations and supply chain networks.
The need for commercial vehicles is mostly driven by the construction and agricultural sectors, which have continuous infrastructure projects and rural transportation requirements. As these industries continue to expand, demand for commercial vehicles is predicted to rise significantly.
Thailand's strategic position as a regional trade hub further underscores the indispensability of commercial vehicles in cross-border transportation and international trade. The automotive industry, a linchpin in the Thai economy, relies heavily on commercial vehicles for transporting auto parts and finished vehicles.
Turkiye commercial vehicle industry is witnessing substantial growth, particularly in the medium-duty segment. This is attributable to the rising need for these vehicles in bulk freight, automotive freight, and construction and heavy equipment freight applications.
In the bulk freight sector, the versatility and cost-effectiveness of medium duty vehicles are becoming increasingly vital for efficient transportation of bulk goods. Also, in automotive freight, the optimal balance of payload capacity and fuel efficiency in medium duty vehicles aligns seamlessly with the growing production and export demands of the automotive industry.
As per the latest report, the commercial vehicle industry in Turkiye is poised to exhibit an impressive CAGR of 9.7% throughout the assessment period. It will likely attain a valuation of USD 59.1 billion by 2035.
The below section shows the light duty segment dominating based on class type. It is projected to advance at an 8.6% CAGR between 2025 and 2035. Based on application type, the bulk freight segment is set to exhibit a CAGR of 6.4% during the forecast period.
| Top Segment (Class Type) | Light Duty |
|---|---|
| Predicted CAGR (2025 to 2035) | 8.6% |
As per the latest analysis, demand is expected to remain high for light duty commercial vehicles (LDCVs) across the MENASA. This is attributable to growing adoption of LDCVs like cargo vans and mini busses for carrying smaller loads and passengers over shorter distances.
From construction to delivery services, light duty commercial vehicles are becoming workhouses of businesses in several sectors. They are more maneuverable and fuel-efficient than heavy-duty commercial vehicles.
The increasing demand for light duty vehicles in South Asia & MENA region is driven by their multifunctional versatility, providing a distinct edge over both medium and heavy vehicle counterparts. The target segment is anticipated to witness a robust 8.6% CAGR, reaching an estimated valuation of USD 723.1.0 billion by 2035.
In the agriculture industry, light-duty vehicles play a pivotal role in transporting produce and equipment and enhancing the efficiency of farm operations. Similarly, the versatility of light-duty vehicles in the construction industry is harnessed for transporting construction materials and equipment to job sites, contributing to streamlined logistics.
Light duty vehicles (up to 5 tons) find extensive use in urban transport, last-mile deliveries, and small-scale logistics. They are gaining immense traction in medicine transport, where their nimbleness facilitates swift delivery of medical supplies.
| Top Segment (Application Type) | Bulk Freight |
|---|---|
| Projected CAGR (2025 to 2035) | 6.4% |
Based on application type, bulk freight segment is projected to thrive at a 6.4% CAGR during the forecast period. It is set to attain a valuation of USD 155.0 billion by 2035. This is due to growing demand for commercial vehicles for bulk freight applications.
Bulk freight trucks play a crucial role in the building industry of India and other Asian nations. This is because they carry bulk raw materials such as aggregates, sand, and gravel to construction sites, allowing infrastructure projects to be rapidly completed.
Bulk freight trucks help agriculture by facilitating the efficient flow of huge quantities of agricultural produce, including grains and fruits, from farms to processing facilities and markets. These vehicles are also essential for the manufacturing industry because they transport completed items and raw materials between distribution and production locations.
Bulk freight trucks' adaptability is essential to maintaining a seamless and productive material flow. Hence, they help in boosting the operational effectiveness and expansion of important industries in South Asia and the Middle East and North Africa (MENA) regions.
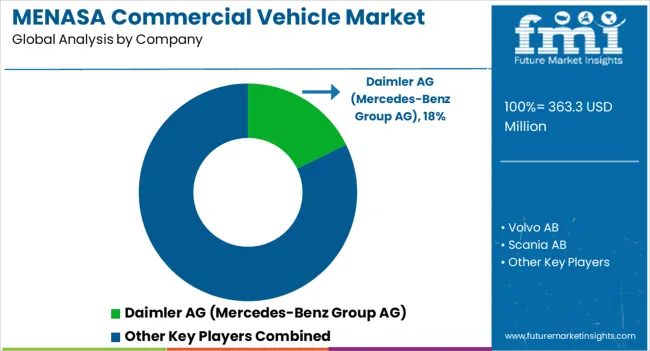
The commercial vehicle landscape in MENASA is fragmented, with leading players accounting for about 70% to 75% of the share. Tata Motors, Daimler AG (Mercedes-Benz Group AG), Volvo AB, Hino Motors Ltd., Scania AB, Paccar Inc., MAN SE, Isuzu Motors Ltd., Sinotruk, Dongfeng Motor Corporation, Toyota Motor Corporation, Ford Motor Company, General Motor Company, , Ashok Leyland, Iveco S.p.A., Kenworth, Peterbilt Motors Company, Mahindra & Mahindra, JAC Motors, Eicher Motors Limited & UD Trucks Corporation are the leading manufacturers of commercial vehicles listed in the report.
Key commercial vehicle companies are investing in continuous research for producing new vehicles integrated with advanced safety technologies, including ADAS and collision avoidance systems. They are also shifting their preference towards developing commercial electric vehicles to meet growing end user demand for eco-friendly commercial vehicles across MENASA.
Several companies are adopting strategies like acquisitions, partnerships, mergers, and facility expansions to strengthen their presence across South Asia and MENA regions. These strategies can also help them to solidify their positions at the regional as well as global levels.
Recent Developments in the MENASA Commercial Vehicle Industry
| Attribute | Details |
|---|---|
| Estimated Value (2025) | USD 363.3 million |
| Projected Value (2035) | USD 723.1 million |
| Anticipated Growth Rate (2025 to 2035) | 7.1% |
| Historical Data | 2020 to 2025 |
| Forecast Period | 2025 to 2035 |
| Quantitative Units | Value (USD billion) and Volume (Th. units) |
| Report Coverage | Revenue Forecast, Volume Forecast, Company Ranking, Competitive Landscape, Growth Factors, Trends, and Pricing Analysis |
| Key Segments Covered | Class Type, Vehicle Type, Fuel Type, Application, Region |
| Regions Covered | GCC Countries; Northern Africa; Turkiye; India; ASEAN; Other MENASA |
| Key Countries Covered | Kingdom of Saudi Arabia, United Arab Emirates, Oman, Qatar, Bahrain, Kuwait, Egypt, Algeria, Morocco, Libya, Turkiye, India, Indonesia, Malaysia, Philippines, Vietnam, Singapore, Thailand |
| Key Companies Profiled | Daimler AG (Mercedes-Benz Group AG); Volvo AB; Scania AB; Paccar Inc.; MAN SE; Hino Motors Ltd.; Isuzu Motors Ltd.; Dongfeng Motor Corporation; Toyota Motor Corporation; Ford Motor Company; General Motor Company; Tata Motors; Ashok Leyland; Iveco S.p.A.; Kenworth; Peterbilt Motors Company; Mahindra & Mahindra; JAC Motors; Sinotruk; Eicher Motors Limited; UD Trucks Corporation |
The global MENASA commercial vehicle market is estimated to be valued at USD 363.3 million in 2025.
The market size for the MENASA commercial vehicle market is projected to reach USD 725.9 million by 2035.
The MENASA commercial vehicle market is expected to grow at a 7.2% CAGR between 2025 and 2035.
The key product types in MENASA commercial vehicle market are light duty, _up to 2.5 tons, _2.5 t to 4.5 t, _4.5 t to 6.5 t, medium duty, _6.5 t to 7.5 t, _7.5 t to 9 t, _9 t to 12 t, heavy duty, _12 t to 15 t and _15 t & above.
In terms of vehicle type, light commercial vehicles segment to command 38.4% share in the MENASA commercial vehicle market in 2025.


Full Research Suite comprises of:
Market outlook & trends analysis
Interviews & case studies
Strategic recommendations
Vendor profiles & capabilities analysis
5-year forecasts
8 regions and 60+ country-level data splits
Market segment data splits
12 months of continuous data updates
DELIVERED AS:
PDF EXCEL ONLINE
Commercial Water Heater Market Size and Share Forecast Outlook 2025 to 2035
Commercial High-Speed Oven Market Size and Share Forecast Outlook 2025 to 2035
Commercial Turboprop Aircrafts Market Size and Share Forecast Outlook 2025 to 2035
Commercial Greenhouse Market Size and Share Forecast Outlook 2025 to 2035
Commercial Vessel Market Size and Share Forecast Outlook 2025 to 2035
Commercial Slush Machine Market Size and Share Forecast Outlook 2025 to 2035
Commercial Medium Voltage Distribution Panel Market Size and Share Forecast Outlook 2025 to 2035
Commercial Earth Observation (CEO) Market Size and Share Forecast Outlook 2025 to 2035
Commercial Ozone Generator Market Size and Share Forecast Outlook 2025 to 2035
Commercial Gas-Fired Boiler Market Size and Share Forecast Outlook 2025 to 2035
Commercial Deep Fryer Parts & Accessories Market Size and Share Forecast Outlook 2025 to 2035
Commercial Gas Restaurant Ranges Market Size and Share Forecast Outlook 2025 to 2035
Commercial Heat Pump Market Size and Share Forecast Outlook 2025 to 2035
Commercial Countertop Ranges Market Size and Share Forecast Outlook 2025 to 2035
Commercial Electric Restaurant Ranges Market Size and Share Forecast Outlook 2025 to 2035
Commercial Distribution Panel Market Size and Share Forecast Outlook 2025 to 2035
Commercial Liquid-Tight Flexible Non-Metallic Conduit Market Size and Share Forecast Outlook 2025 to 2035
Commercial Solar Cable Market Size and Share Forecast Outlook 2025 to 2035
Commercial Food Refrigeration Equipment Market Size and Share Forecast Outlook 2025 to 2035
Commercial Flexible Electrical Conduit Market Size and Share Forecast Outlook 2025 to 2035

Thank you!
You will receive an email from our Business Development Manager. Please be sure to check your SPAM/JUNK folder too.
Chat With
MaRIA