Reports

- Global Locations -

Headquarters

Future Market Insights, Inc.

Christiana Corporate, 200
Continental Drive, Suite 401,
Newark, Delaware - 19713,
United States

T: +1-845-579-5705

Americas

Future Market Insights, Inc.

616 Corporate Way, Suite 2-9018,
Valley Cottage, NY 10989, United States

T: +1-347-918-3531

MEA

Future Market Insights

1602-6 Jumeirah Bay X2 Tower, Plot No: JLT-PH2-X2A,
Jumeirah Lakes Towers, Dubai,
United Arab Emirates

Europe

Future Market Insights

3rd Floor, 207 Regent Street,
W1B 3HH London
United Kingdom

T: + 44 (0) 20 8123 9659
D: +44 (0) 20 3287 4268

Asia Pacific

Future Market Insights

IndiaLand Global Tech Park, Unit UG-1, Behind Grand HighStreet, Phase 1, Hinjawadi, MH, Pune – 411057, India

Commercial Greenhouse Market Outlook for 2024 to 2034

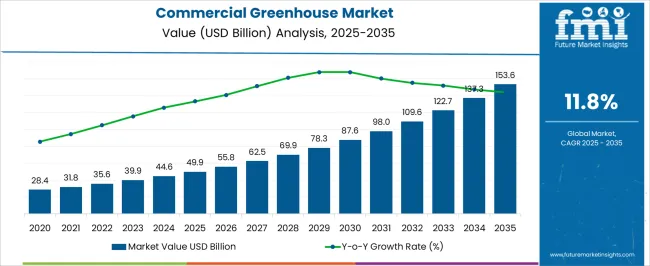
The global commercial greenhouse market is expected to be valued at US$ 44.6 billion in 2024 and is projected to be worth US$ 137 billion by 2034. The market is anticipated to expand at a CAGR of 11.9% on average between 2024 and 2034. The commercial greenhouse industry is growing rapidly due to the rising demand for sustainable food production and controlled environment agriculture.

Customers in the commercial greenhouse sector place a higher value on environmentally friendly and energy-efficient solutions. For precision farming, they are looking for cutting-edge technology, such as automated systems and intelligent controls. An emphasis on year-round production, crop diversity, and the capacity to satisfy local and fresh supply requirements further drive demand.

Consumption Analysis of the Commercial Greenhouse

  • A commercial greenhouse lets farmers control light, humidity, and temperature, allowing for year-round cultivation and higher crop yields.
  • The fall in cultivable land per capita and the capacity of commercial greenhouses to provide greater yields than traditional agricultural methods are driving the commercial greenhouse demand.
  • Farmers can cultivate flowers, vegetables, fruits, and transplants for general planting in the highly regulated and stable settings offered by the commercial greenhouse. In spite of the difficulties with the local temperature, soil, or topography, this makes greenhouse plant development durable.
  • The market is expanding rapidly due to technological advancements, including automation and smart controls. These cutting-edge technologies assist greenhouse firms in optimizing their operations, increasing efficiency, and improving crop yields, ultimately fueling the industry's growth.
  • Year-round production and a diverse range of crops are driving the adoption of new agricultural techniques and contributing to the enormous expansion of the commercial greenhouse sector.
  • In the forthcoming decade, growing and supplying greenhouses has become more profitable due to expanded demand for various products, such as fruits, vegetables, flowers, and decorative plants.
Attributes Details
Commercial Greenhouse Market Value for 2024 US$ 44.6 billion
Commercial Greenhouse Market Size for 2034 US$ 137 billion
Commercial Greenhouse Market Forecast CAGR for 2024 to 2034 11.9%

Don't pay for what you don't need

Customize your report by selecting specific countries or regions and save 30%!

Historical Performance and Future Growth of the Commercial Greenhouse Market

The current section thoroughly examines the sector throughout the preceding five years, emphasizing the anticipated trends in the commercial greenhouse market's growth. A solid 15.8% historical compound annual growth rate suggests the market is gradually declining. Through 2034, the industry is expected to endure growth at a stable 11.9% CAGR.

Historical CAGR 15.8%
Forecast CAGR 11.9%

Economic downturns, customer preferences shifting toward outdoor farming and traditional methods, and new problems such as shifting market dynamics or external causes such as disease and climate change are all likely to reduce the demand for commercial greenhouses.

Crucial factors that are anticipated to affect the demand for industrial greenhouse through 2034.

  • The need for commercial greenhouses is declining amid emerging barriers such as illnesses, climatic concerns, and shifting market dynamics.
  • The recession is affecting investments in agricultural production.
  • Customer preferences are moving in favor of conventional and outdoor cultivation methods.
  • Growing incidences of greenhouse gases and their influence on the climate hinder the growth of the demand for commercial greenhouses.

Key Trends Influencing the Commercial Greenhouse Market

Popularity of the Horticultural Crops in the Majority Demand

Horticultural crops are in high demand for various factors in the commercial greenhouse business. Fresh, locally produced fruit is becoming increasingly important to consumers, so year-round growing in regulated circumstances is required. Growers are implementing greenhouse technology due to growing public awareness of environmentally friendly and sustainable farming techniques.

Greenhouse-regulated environments promote optimal development, increased yield, and less environmental impact. This increased need is consistent with trends toward better eating habits, requiring the commercial greenhouse sector to play an important part in supplying the rising demand for high-quality horticulture crops.

Reduced Amount of Water and Land Improves Greenhouse Yields

Greenhouse farming offers a significant advantage over conventional farming methods by utilizing less water and land to produce the same food. Since urbanization displaces arable land and diminishes the total quantity of agricultural area, greenhouse farming may help meet the growing population's demand for food. Water is wasted less in organic farming than in standard agriculture.

Greenhouse farming requires 95% less water than conventional agriculture for the same amount of crops. Farmers may reuse the water for irrigation in vertical greenhouses since transpiration occurs during the production of goods or plants. Less water and land consumption in greenhouse farming promotes market growth.

Increasing Demand for Controlled Environment Agriculture

The industry is experiencing increased demand for controlled environment agriculture (CEA) due to various causes. Controlled environment agriculture optimizes crop growth and resource usage by giving farmers exact control over temperature, humidity, and light. Because of this technology, fresh food can be grown all year round, providing a consistent and dependable supply regardless of the weather.

Controlled environment agriculture (CEA) minimizes environmental influence and focuses on sustainable practices and efficient resource management. Moreover, it is becoming increasingly popular as customers prefer high-quality, pesticide-free, and locally-produced produce.

Sudip Saha
Sudip Saha

Principal Consultant

Talk to Analyst

Find your sweet spots for generating winning opportunities in this market.

Comparative View of the Adjacent Commercial Greenhouse Market

The commercial greenhouse industry, the indoor farming market, and the smart agriculture solution market are compared in this section. The research spans 2024 to 2034 and focuses on each market's key trends, prospects, and compound annual growth rate.

Commercial Greenhouse Market:

Attributes Commercial Greenhouse Market
CAGR (2024 to 2034) 11.9%
Opportunity Fresh food requirements, crop diversity, and year-round production create novel opportunities
Key Trends Adoption of advanced technologies such as automation and smart controls in commercial greenhouses

Indoor Farming Market:

Attributes Indoor Farming Market
CAGR (2024 to 2034) 9.8%
Opportunity Energy innovation and hydroponic systems are likely to present opportunities for market players
Key Trends Growing adoption of rare and exotic crops in indoor farming

Smart Agriculture Solution Market:

Attributes Smart Agriculture Solution Market
CAGR (2024 to 2034) 6.9%
Opportunity Implementation of IoT and artificial intelligence in agriculture for real-time updates
Key Trends Wearable, smart sensors, and cloud-based applications

Category-wise Insights

In-depth analyses of certain commercial greenhouse industry segments are presented in this section. The two main subjects of the current research are the heating systems equipment market and the crops that produce fruits and vegetables.

The Heating Systems Cultivates the Commercial Greenhouse Farming

Attributes Details
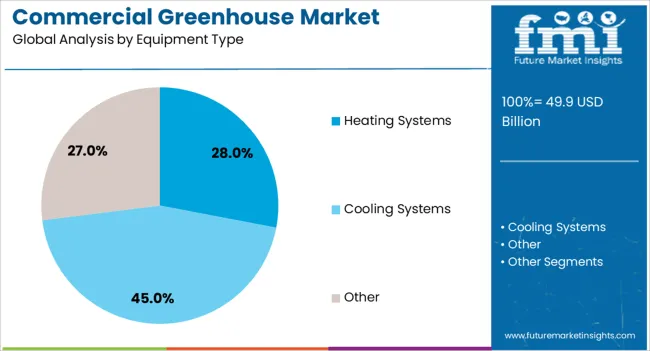
Top Equipment Type Heating Systems
CAGR from 2024 to 2034 11.7%

The heating systems types of equipment category are estimated to rule the commercial greenhouse market, with an impressive CAGR of 11.7%. There are several reasons for this inclination for heating systems for the commercial greenhouses:

  • The development of crops is aided by systems that maintain a steady temperature and release no toxic materials into the atmosphere.
  • The method used to keep the temperature at the desired level is called a heating system. These systems can be distributed or managed centrally.
  • In order to heat their interiors throughout the winter, greenhouses frequently employ radiant hot water heating systems. Since mixing valves efficiently control flow, they are used in these heating systems to manage the temperature of the heating pipes.

Fruit and Vegetables Blossoms the Commercial Greenhouse Industry

Attributes Details
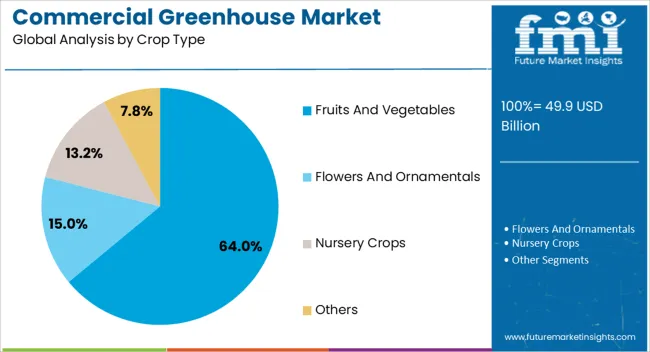
Top Crop Type Fruits and Vegetables
CAGR from 2024 to 2034 11.6%

With a noteworthy CAGR of 11.6%, fruit and vegetables emerged as a popular crop category. The following is a description of this supremacy:

  • Vegetables and fruits may be grown in greenhouses year-round because of their versatility and ability to withstand fluctuations in temperature, weather, and other factors.
  • Regardless of the outside weather, year-round and consistent production of fruits and vegetables is made possible by extending growing seasons through controlled surroundings.
  • When fruits and vegetables are grown in greenhouses, they are shielded from extreme weather, wind, pests, drought, scorching heat, and animals that may try to devour them.
  • Growing emphasis is being placed on developing a wide range of fruits and vegetables in commercial greenhouses to satisfy consumers' varied needs and tastes.

Get the data you need at a Fraction of the cost

Personalize your report by choosing insights you need
and save 40%!

Country-wise Insights

This section examines the markets for commercial greenhouses in many important nations, such as the United States, China, Japan, South Korea, and the United Kingdom. The section explores the aspects influencing commercial greenhouses' demand, acceptance, and sales in particular countries.

Country CAGR from 2024 to 2034
United States 24.7%
Japan 15.4%
United Kingdom 5.6%
South Korea 8.2%
China 20.8%

Modern Commercial Greenhouse Farming Blooms In the United States

In the United States, the demand for commercial greenhouses is anticipated to expand at a staggering compound annual growth rate of 24.7% through 2034. The following factors fuel this rapid growth:

  • Supplying the growing need for locally grown produce, cutting down on shipping expenses, and encouraging community-focused and sustainable farming in the United States.
  • Increased use of automation and robotics for tasks such as planting, harvesting, and monitoring environmental conditions has enhanced productivity and reduced labor costs in the modern greenhouse industry in the United States.
  • Employing cutting-edge techniques for effective resource optimization and space efficiency in the United States, including hydroponics, aeroponics, and vertical farming.

Japanese Industry Grows Found of Advanced Commercial Greenhouse

Japan is experiencing a surge in demand for commercial greenhouses for farming, with a predicted CAGR of 15.4% through 2034. Some of the primary drivers include:

  • Japan uses precision farming methods using sensors and Internet of Things devices to monitor and modify factors such as temperature, humidity, and nutrient levels for the best development of the crops.
  • Japanese producers consistently push the boundaries of innovation in greenhouse agriculture products by employing state-of-the-art farming methods and other innovative approaches to satisfy a wide range of taste preferences.
  • Japanese have increased harvests and produced ideal growth conditions because of advanced technology, including CO2 supplementation, computerized climate control systems, and artificial lighting.
  • To accommodate a diverse variety of palates, Japanese farmers have also been experimenting with novel and inventive methods, such as employing certain soil mixtures, growing plants in unusual forms, and adding particular nutrients to their harvests.

China Commercial Greenhouse Farming Cultivates Crofting Culture

China is seeing an increase in demand for commercial greenhouses, with a predicted CAGR of 20.8% through 2034. Among the main trends are:

  • Significant growth in the China greenhouse crofting industry, driven by increasing demand for fresh produce and the need for year-round cultivation.
  • Chinese market players embrace advanced greenhouse technologies, such as hydroponics and precision farming, to enhance efficiency and optimize resource utilization.
  • Continued government initiatives and policies supporting greenhouse development in China to ensure food security, promote sustainable agriculture, and address environmental concerns.
  • Shift toward cultivating diverse crops within greenhouses, including vegetables, fruits, and herbs, to meet evolving consumer preferences in China.

The United Kingdom Fancies the Conservatory Agribusiness

The market for commercial greenhouses is expanding in the United Kingdom with an estimated CAGR of 5.6% through 2034. Here are a few of the key trends:

  • Modern agricultural techniques and infrastructural upgrades can increase output, lessen their negative effects on the environment, and raise the competitiveness of the United Kingdom's commercial greenhouse sector.
  • An increasing emphasis is on exporting products grown in greenhouses, taking advantage of foreign markets, and strengthening the United Kingdom's agro-farming industry's supply network.
  • To be at the forefront of industry improvements in the United Kingdom, research and development should be prioritized for innovation in greenhouse technology, crop types, and cultivating practices.

South Korea Farming Industry Indulges the Industrialization of the Greenhouses

Through 2034, the market for commercial greenhouses in South Korea is anticipated to increase at a promising CAGR of 8.2%. Several of the key trends are as follows:
  • Encouraging sustainable and community-focused agriculture in South Korea, lowering transportation costs, and satisfying the growing demand for products obtained locally.
  • There is an increasing emphasis on urban agriculture and rooftop greenhouse farming to overcome the scarcity of arable land and meet the rising demand for locally produced products in South Korea's metropolitan regions.
  • In order to support the nation's economic development, Korean market participants are looking at export potential and foreign demand for products grown in greenhouses.

Establishments Shaping the Outlook of the Commercial Greenhouse Industry

The leading players in the market are expanding their businesses, creating a standardization of the best practices in greenhouse farming. Industry leaders such as Sotrafa and Berry Global prioritize sustainability by adopting eco-friendly practices, promoting resource-efficient technologies, and adhering to environmental standards, thus influencing the overall outlook of greenhouse agriculture.

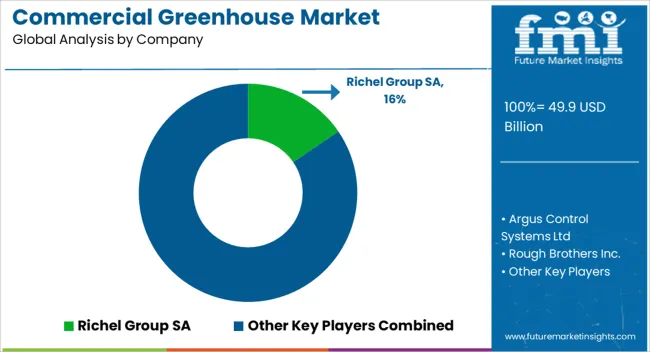
Influential companies such as Richel Group and Argus Control Systems Ltd are also crucial in educating stakeholders, including farmers and consumers, about the advantages of commercial greenhouses, influencing market perceptions, and driving acceptance.

Investments in research and development activities contribute to developing advanced greenhouse solutions, crop varieties, and cultivation methods, which positively impact the industry's overall productivity and sustainability.

The top players in the market, such as Certho and Logiq 's BV, are driving the adoption of innovative technologies, including precision farming, automation, and climate control systems, shaping the industry's modernization and efficiency. Collaborations and partnerships with technology providers, agricultural research institutions, and government bodies facilitate knowledge exchange, driving advancements and industry growth.

Leading players are also actively advocating supportive policies at national and international levels, influencing regulatory frameworks that impact the growth and development of the commercial greenhouse industry.

Recent Developments in the Commercial Greenhouse Industry:

  • In January 2024, Centuria Capital Group acquired a greenhouse and glasshouse facility in Adelaide Plains, South Australia, for its open-ended, unlisted agriculture fund from P'Petual Holdings.
  • In January 2024, Lassana Agri cultivated 10,000 hectares of land using advanced greenhouse solutions to help farmers transition to modern agriculture and secure financial support for production expansion.
  • In October 2023, VidaWool formed a distribution agreement with Hawthorne Gardening to implement their flagship strings, plugs, blocks, and slabs designed to optimize nutrient distribution throughout the plant in indoor horticulture.
  • In May 2023, IIITB and IIHR developed an automated greenhouse system for precision agriculture featuring hydroponics, open-grow farming, and vertical setup configurations with an experimental hardware component.

Key Companies in the Commercial Greenhouse Market

  • Richel Group SA
  • Argus Control Systems Ltd
  • Rough Brothers Inc.
  • Certhon
  • Logiqs BV
  • Sotrafa
  • Berry Global
  • NETAFIM
  • Stuppy Greenhouse
  • Poly-Tex, Inc.
  • The Glasshouse Company
  • Luiten Greenhouses BV
  • Agra Tech, Inc.

Key Segments

By Equipment Type:

  • Heating Systems
  • Cooling Systems
  • Other

By Crop Type:

  • Fruits and Vegetables
  • Flowers and Ornamentals
  • Nursery Crops
  • Others

Greenhouse Type:

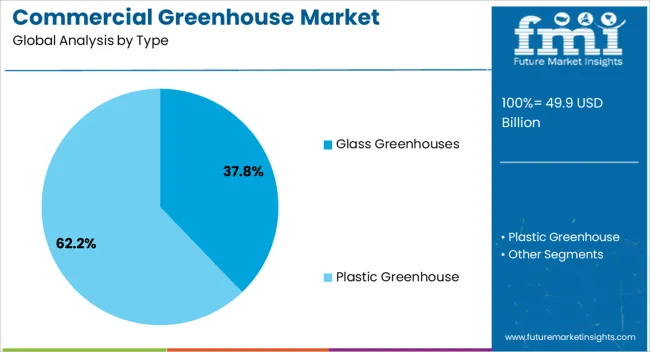
  • Glass Greenhouses
  • Plastic Greenhouse

By Region:

  • North America
  • Latin America
  • Europe
  • East Asia
  • South Asia
  • Oceania
  • The Middle East and Africa

Frequently Asked Questions

How Big is the Commercial Greenhouse Market?

The commercial greenhouse market is expected to have a value of US$ 44.6 billion in 2024.

Which Countries Dominate the Commercial Greenhouse Market?

The United States, with a 24.7% CAGR, is likely to dominate the market through 2034.

What is the Commercial Greenhouse Market Growth Outlook for 2034?

The commercial greenhouse market is anticipated to surpass US$ 137 billion by 2034.

What is the Sales Outlook for the Commercial Greenhouse Market?

The commercial greenhouse industry is anticipated to evolve at a CAGR of 11.9% from 2024 to 2034.

Which Equipment Type is Expected to Lead in the Commercial Greenhouse Market?

The heating system is estimated to lead with a growth rate of 11.7% through 2034.

Table of Content

1. Executive Summary

    1.1. Global Market Outlook

    1.2. Demand-side Trends

    1.3. Supply-side Trends

    1.4. Technology Roadmap Analysis

    1.5. Analysis and Recommendations

2. Market Overview

    2.1. Market Coverage / Taxonomy

    2.2. Market Definition / Scope / Limitations

3. Market Background

    3.1. Market Dynamics

        3.1.1. Drivers

        3.1.2. Restraints

        3.1.3. Opportunity

        3.1.4. Trends

    3.2. Scenario Forecast

        3.2.1. Demand in Optimistic Scenario

        3.2.2. Demand in Likely Scenario

        3.2.3. Demand in Conservative Scenario

    3.3. Opportunity Map Analysis

    3.4. Investment Feasibility Matrix

    3.5. PESTLE and Porter’s Analysis

    3.6. Regulatory Landscape

        3.6.1. By Key Regions

        3.6.2. By Key Countries

    3.7. Regional Parent Market Outlook

4. Global Market Analysis 2019 to 2023 and Forecast, 2024 to 2034

    4.1. Historical Market Size Value (US$ Million) Analysis, 2019 to 2023

    4.2. Current and Future Market Size Value (US$ Million) Projections, 2024 to 2034

        4.2.1. Y-o-Y Growth Trend Analysis

        4.2.2. Absolute $ Opportunity Analysis

5. Global Market Analysis 2019 to 2023 and Forecast 2024 to 2034, By Equipment

    5.1. Introduction / Key Findings

    5.2. Historical Market Size Value (US$ Million) Analysis By Equipment, 2019 to 2023

    5.3. Current and Future Market Size Value (US$ Million) Analysis and Forecast By Equipment, 2024 to 2034

        5.3.1. Heating Systems

        5.3.2. Cooling Systems

        5.3.3. Others

    5.4. Y-o-Y Growth Trend Analysis By Equipment, 2019 to 2023

    5.5. Absolute $ Opportunity Analysis By Equipment, 2024 to 2034

6. Global Market Analysis 2019 to 2023 and Forecast 2024 to 2034, By Type

    6.1. Introduction / Key Findings

    6.2. Historical Market Size Value (US$ Million) Analysis By Type, 2019 to 2023

    6.3. Current and Future Market Size Value (US$ Million) Analysis and Forecast By Type, 2024 to 2034

        6.3.1. Glass Greenhouses

        6.3.2. Plastics Greenhouses

    6.4. Y-o-Y Growth Trend Analysis By Type, 2019 to 2023

    6.5. Absolute $ Opportunity Analysis By Type, 2024 to 2034

7. Global Market Analysis 2019 to 2023 and Forecast 2024 to 2034, By Crop Type

    7.1. Introduction / Key Findings

    7.2. Historical Market Size Value (US$ Million) Analysis By Crop Type, 2019 to 2023

    7.3. Current and Future Market Size Value (US$ Million) Analysis and Forecast By Crop Type, 2024 to 2034

        7.3.1. Flowers & Ornamentals

        7.3.2. Nursery Crops

        7.3.3. Fruits & Vegetables

        7.3.4. Others

    7.4. Y-o-Y Growth Trend Analysis By Crop Type, 2019 to 2023

    7.5. Absolute $ Opportunity Analysis By Crop Type, 2024 to 2034

8. Global Market Analysis 2019 to 2023 and Forecast 2024 to 2034, By Region

    8.1. Introduction

    8.2. Historical Market Size Value (US$ Million) Analysis By Region, 2019 to 2023

    8.3. Current Market Size Value (US$ Million) Analysis and Forecast By Region, 2024 to 2034

        8.3.1. North America

        8.3.2. Latin America

        8.3.3. Western Europe

        8.3.4. Eastern Europe

        8.3.5. South Asia and Pacific

        8.3.6. East Asia

        8.3.7. Middle East and Africa

    8.4. Market Attractiveness Analysis By Region

9. North America Market Analysis 2019 to 2023 and Forecast 2024 to 2034, By Country

    9.1. Historical Market Size Value (US$ Million) Trend Analysis By Market Taxonomy, 2019 to 2023

    9.2. Market Size Value (US$ Million) Forecast By Market Taxonomy, 2024 to 2034

        9.2.1. By Country

            9.2.1.1. USA

            9.2.1.2. Canada

        9.2.2. By Equipment

        9.2.3. By Type

        9.2.4. By Crop Type

    9.3. Market Attractiveness Analysis

        9.3.1. By Country

        9.3.2. By Equipment

        9.3.3. By Type

        9.3.4. By Crop Type

    9.4. Key Takeaways

10. Latin America Market Analysis 2019 to 2023 and Forecast 2024 to 2034, By Country

    10.1. Historical Market Size Value (US$ Million) Trend Analysis By Market Taxonomy, 2019 to 2023

    10.2. Market Size Value (US$ Million) Forecast By Market Taxonomy, 2024 to 2034

        10.2.1. By Country

            10.2.1.1. Brazil

            10.2.1.2. Mexico

            10.2.1.3. Rest of Latin America

        10.2.2. By Equipment

        10.2.3. By Type

        10.2.4. By Crop Type

    10.3. Market Attractiveness Analysis

        10.3.1. By Country

        10.3.2. By Equipment

        10.3.3. By Type

        10.3.4. By Crop Type

    10.4. Key Takeaways

11. Western Europe Market Analysis 2019 to 2023 and Forecast 2024 to 2034, By Country

    11.1. Historical Market Size Value (US$ Million) Trend Analysis By Market Taxonomy, 2019 to 2023

    11.2. Market Size Value (US$ Million) Forecast By Market Taxonomy, 2024 to 2034

        11.2.1. By Country

            11.2.1.1. Germany

            11.2.1.2. UK

            11.2.1.3. France

            11.2.1.4. Spain

            11.2.1.5. Italy

            11.2.1.6. Rest of Western Europe

        11.2.2. By Equipment

        11.2.3. By Type

        11.2.4. By Crop Type

    11.3. Market Attractiveness Analysis

        11.3.1. By Country

        11.3.2. By Equipment

        11.3.3. By Type

        11.3.4. By Crop Type

    11.4. Key Takeaways

12. Eastern Europe Market Analysis 2019 to 2023 and Forecast 2024 to 2034, By Country

    12.1. Historical Market Size Value (US$ Million) Trend Analysis By Market Taxonomy, 2019 to 2023

    12.2. Market Size Value (US$ Million) Forecast By Market Taxonomy, 2024 to 2034

        12.2.1. By Country

            12.2.1.1. Poland

            12.2.1.2. Russia

            12.2.1.3. Czech Republic

            12.2.1.4. Romania

            12.2.1.5. Rest of Eastern Europe

        12.2.2. By Equipment

        12.2.3. By Type

        12.2.4. By Crop Type

    12.3. Market Attractiveness Analysis

        12.3.1. By Country

        12.3.2. By Equipment

        12.3.3. By Type

        12.3.4. By Crop Type

    12.4. Key Takeaways

13. South Asia and Pacific Market Analysis 2019 to 2023 and Forecast 2024 to 2034, By Country

    13.1. Historical Market Size Value (US$ Million) Trend Analysis By Market Taxonomy, 2019 to 2023

    13.2. Market Size Value (US$ Million) Forecast By Market Taxonomy, 2024 to 2034

        13.2.1. By Country

            13.2.1.1. India

            13.2.1.2. Bangladesh

            13.2.1.3. Australia

            13.2.1.4. New Zealand

            13.2.1.5. Rest of South Asia and Pacific

        13.2.2. By Equipment

        13.2.3. By Type

        13.2.4. By Crop Type

    13.3. Market Attractiveness Analysis

        13.3.1. By Country

        13.3.2. By Equipment

        13.3.3. By Type

        13.3.4. By Crop Type

    13.4. Key Takeaways

14. East Asia Market Analysis 2019 to 2023 and Forecast 2024 to 2034, By Country

    14.1. Historical Market Size Value (US$ Million) Trend Analysis By Market Taxonomy, 2019 to 2023

    14.2. Market Size Value (US$ Million) Forecast By Market Taxonomy, 2024 to 2034

        14.2.1. By Country

            14.2.1.1. China

            14.2.1.2. Japan

            14.2.1.3. South Korea

        14.2.2. By Equipment

        14.2.3. By Type

        14.2.4. By Crop Type

    14.3. Market Attractiveness Analysis

        14.3.1. By Country

        14.3.2. By Equipment

        14.3.3. By Type

        14.3.4. By Crop Type

    14.4. Key Takeaways

15. Middle East and Africa Market Analysis 2019 to 2023 and Forecast 2024 to 2034, By Country

    15.1. Historical Market Size Value (US$ Million) Trend Analysis By Market Taxonomy, 2019 to 2023

    15.2. Market Size Value (US$ Million) Forecast By Market Taxonomy, 2024 to 2034

        15.2.1. By Country

            15.2.1.1. GCC Countries

            15.2.1.2. South Africa

            15.2.1.3. Israel

            15.2.1.4. Rest of MEA

        15.2.2. By Equipment

        15.2.3. By Type

        15.2.4. By Crop Type

    15.3. Market Attractiveness Analysis

        15.3.1. By Country

        15.3.2. By Equipment

        15.3.3. By Type

        15.3.4. By Crop Type

    15.4. Key Takeaways

16. Key Countries Market Analysis

    16.1. USA

        16.1.1. Pricing Analysis

        16.1.2. Market Share Analysis, 2023

            16.1.2.1. By Equipment

            16.1.2.2. By Type

            16.1.2.3. By Crop Type

    16.2. Canada

        16.2.1. Pricing Analysis

        16.2.2. Market Share Analysis, 2023

            16.2.2.1. By Equipment

            16.2.2.2. By Type

            16.2.2.3. By Crop Type

    16.3. Brazil

        16.3.1. Pricing Analysis

        16.3.2. Market Share Analysis, 2023

            16.3.2.1. By Equipment

            16.3.2.2. By Type

            16.3.2.3. By Crop Type

    16.4. Mexico

        16.4.1. Pricing Analysis

        16.4.2. Market Share Analysis, 2023

            16.4.2.1. By Equipment

            16.4.2.2. By Type

            16.4.2.3. By Crop Type

    16.5. Germany

        16.5.1. Pricing Analysis

        16.5.2. Market Share Analysis, 2023

            16.5.2.1. By Equipment

            16.5.2.2. By Type

            16.5.2.3. By Crop Type

    16.6. UK

        16.6.1. Pricing Analysis

        16.6.2. Market Share Analysis, 2023

            16.6.2.1. By Equipment

            16.6.2.2. By Type

            16.6.2.3. By Crop Type

    16.7. France

        16.7.1. Pricing Analysis

        16.7.2. Market Share Analysis, 2023

            16.7.2.1. By Equipment

            16.7.2.2. By Type

            16.7.2.3. By Crop Type

    16.8. Spain

        16.8.1. Pricing Analysis

        16.8.2. Market Share Analysis, 2023

            16.8.2.1. By Equipment

            16.8.2.2. By Type

            16.8.2.3. By Crop Type

    16.9. Italy

        16.9.1. Pricing Analysis

        16.9.2. Market Share Analysis, 2023

            16.9.2.1. By Equipment

            16.9.2.2. By Type

            16.9.2.3. By Crop Type

    16.10. Poland

        16.10.1. Pricing Analysis

        16.10.2. Market Share Analysis, 2023

            16.10.2.1. By Equipment

            16.10.2.2. By Type

            16.10.2.3. By Crop Type

    16.11. Russia

        16.11.1. Pricing Analysis

        16.11.2. Market Share Analysis, 2023

            16.11.2.1. By Equipment

            16.11.2.2. By Type

            16.11.2.3. By Crop Type

    16.12. Czech Republic

        16.12.1. Pricing Analysis

        16.12.2. Market Share Analysis, 2023

            16.12.2.1. By Equipment

            16.12.2.2. By Type

            16.12.2.3. By Crop Type

    16.13. Romania

        16.13.1. Pricing Analysis

        16.13.2. Market Share Analysis, 2023

            16.13.2.1. By Equipment

            16.13.2.2. By Type

            16.13.2.3. By Crop Type

    16.14. India

        16.14.1. Pricing Analysis

        16.14.2. Market Share Analysis, 2023

            16.14.2.1. By Equipment

            16.14.2.2. By Type

            16.14.2.3. By Crop Type

    16.15. Bangladesh

        16.15.1. Pricing Analysis

        16.15.2. Market Share Analysis, 2023

            16.15.2.1. By Equipment

            16.15.2.2. By Type

            16.15.2.3. By Crop Type

    16.16. Australia

        16.16.1. Pricing Analysis

        16.16.2. Market Share Analysis, 2023

            16.16.2.1. By Equipment

            16.16.2.2. By Type

            16.16.2.3. By Crop Type

    16.17. New Zealand

        16.17.1. Pricing Analysis

        16.17.2. Market Share Analysis, 2023

            16.17.2.1. By Equipment

            16.17.2.2. By Type

            16.17.2.3. By Crop Type

    16.18. China

        16.18.1. Pricing Analysis

        16.18.2. Market Share Analysis, 2023

            16.18.2.1. By Equipment

            16.18.2.2. By Type

            16.18.2.3. By Crop Type

    16.19. Japan

        16.19.1. Pricing Analysis

        16.19.2. Market Share Analysis, 2023

            16.19.2.1. By Equipment

            16.19.2.2. By Type

            16.19.2.3. By Crop Type

    16.20. South Korea

        16.20.1. Pricing Analysis

        16.20.2. Market Share Analysis, 2023

            16.20.2.1. By Equipment

            16.20.2.2. By Type

            16.20.2.3. By Crop Type

    16.21. GCC Countries

        16.21.1. Pricing Analysis

        16.21.2. Market Share Analysis, 2023

            16.21.2.1. By Equipment

            16.21.2.2. By Type

            16.21.2.3. By Crop Type

    16.22. South Africa

        16.22.1. Pricing Analysis

        16.22.2. Market Share Analysis, 2023

            16.22.2.1. By Equipment

            16.22.2.2. By Type

            16.22.2.3. By Crop Type

    16.23. Israel

        16.23.1. Pricing Analysis

        16.23.2. Market Share Analysis, 2023

            16.23.2.1. By Equipment

            16.23.2.2. By Type

            16.23.2.3. By Crop Type

17. Market Structure Analysis

    17.1. Competition Dashboard

    17.2. Competition Benchmarking

    17.3. Market Share Analysis of Top Players

        17.3.1. By Regional

        17.3.2. By Equipment

        17.3.3. By Type

        17.3.4. By Crop Type

18. Competition Analysis

    18.1. Competition Deep Dive

        18.1.1. Berry Global

            18.1.1.1. Overview

            18.1.1.2. Product Portfolio

            18.1.1.3. Profitability by Market Segments

            18.1.1.4. Sales Footprint

            18.1.1.5. Strategy Overview

                18.1.1.5.1. Marketing Strategy

        18.1.2. Signify Holding

            18.1.2.1. Overview

            18.1.2.2. Product Portfolio

            18.1.2.3. Profitability by Market Segments

            18.1.2.4. Sales Footprint

            18.1.2.5. Strategy Overview

                18.1.2.5.1. Marketing Strategy

        18.1.3. Heliospectra AB

            18.1.3.1. Overview

            18.1.3.2. Product Portfolio

            18.1.3.3. Profitability by Market Segments

            18.1.3.4. Sales Footprint

            18.1.3.5. Strategy Overview

                18.1.3.5.1. Marketing Strategy

        18.1.4. Plastika Kritis

            18.1.4.1. Overview

            18.1.4.2. Product Portfolio

            18.1.4.3. Profitability by Market Segments

            18.1.4.4. Sales Footprint

            18.1.4.5. Strategy Overview

                18.1.4.5.1. Marketing Strategy

        18.1.5. Everlight Electronics

            18.1.5.1. Overview

            18.1.5.2. Product Portfolio

            18.1.5.3. Profitability by Market Segments

            18.1.5.4. Sales Footprint

            18.1.5.5. Strategy Overview

                18.1.5.5.1. Marketing Strategy

        18.1.6. Richel Group

            18.1.6.1. Overview

            18.1.6.2. Product Portfolio

            18.1.6.3. Profitability by Market Segments

            18.1.6.4. Sales Footprint

            18.1.6.5. Strategy Overview

                18.1.6.5.1. Marketing Strategy

        18.1.7. Argus Control Systems

            18.1.7.1. Overview

            18.1.7.2. Product Portfolio

            18.1.7.3. Profitability by Market Segments

            18.1.7.4. Sales Footprint

            18.1.7.5. Strategy Overview

                18.1.7.5.1. Marketing Strategy

        18.1.8. Certhon

            18.1.8.1. Overview

            18.1.8.2. Product Portfolio

            18.1.8.3. Profitability by Market Segments

            18.1.8.4. Sales Footprint

            18.1.8.5. Strategy Overview

                18.1.8.5.1. Marketing Strategy

        18.1.9. Logiqs BV

            18.1.9.1. Overview

            18.1.9.2. Product Portfolio

            18.1.9.3. Profitability by Market Segments

            18.1.9.4. Sales Footprint

            18.1.9.5. Strategy Overview

                18.1.9.5.1. Marketing Strategy

        18.1.10. LumiGrow

            18.1.10.1. Overview

            18.1.10.2. Product Portfolio

            18.1.10.3. Profitability by Market Segments

            18.1.10.4. Sales Footprint

            18.1.10.5. Strategy Overview

                18.1.10.5.1. Marketing Strategy

        18.1.11. Agra-tech, Inc

            18.1.11.1. Overview

            18.1.11.2. Product Portfolio

            18.1.11.3. Profitability by Market Segments

            18.1.11.4. Sales Footprint

            18.1.11.5. Strategy Overview

                18.1.11.5.1. Marketing Strategy

19. Assumptions & Acronyms Used

20. Research Methodology

List of Tables

Table 1: Global Market Value (US$ Million) Forecast by Region, 2019 to 2034

Table 2: Global Market Value (US$ Million) Forecast by Equipment, 2019 to 2034

Table 3: Global Market Value (US$ Million) Forecast by Type, 2019 to 2034

Table 4: Global Market Value (US$ Million) Forecast by Crop Type, 2019 to 2034

Table 5: North America Market Value (US$ Million) Forecast by Country, 2019 to 2034

Table 6: North America Market Value (US$ Million) Forecast by Equipment, 2019 to 2034

Table 7: North America Market Value (US$ Million) Forecast by Type, 2019 to 2034

Table 8: North America Market Value (US$ Million) Forecast by Crop Type, 2019 to 2034

Table 9: Latin America Market Value (US$ Million) Forecast by Country, 2019 to 2034

Table 10: Latin America Market Value (US$ Million) Forecast by Equipment, 2019 to 2034

Table 11: Latin America Market Value (US$ Million) Forecast by Type, 2019 to 2034

Table 12: Latin America Market Value (US$ Million) Forecast by Crop Type, 2019 to 2034

Table 13: Western Europe Market Value (US$ Million) Forecast by Country, 2019 to 2034

Table 14: Western Europe Market Value (US$ Million) Forecast by Equipment, 2019 to 2034

Table 15: Western Europe Market Value (US$ Million) Forecast by Type, 2019 to 2034

Table 16: Western Europe Market Value (US$ Million) Forecast by Crop Type, 2019 to 2034

Table 17: Eastern Europe Market Value (US$ Million) Forecast by Country, 2019 to 2034

Table 18: Eastern Europe Market Value (US$ Million) Forecast by Equipment, 2019 to 2034

Table 19: Eastern Europe Market Value (US$ Million) Forecast by Type, 2019 to 2034

Table 20: Eastern Europe Market Value (US$ Million) Forecast by Crop Type, 2019 to 2034

Table 21: South Asia and Pacific Market Value (US$ Million) Forecast by Country, 2019 to 2034

Table 22: South Asia and Pacific Market Value (US$ Million) Forecast by Equipment, 2019 to 2034

Table 23: South Asia and Pacific Market Value (US$ Million) Forecast by Type, 2019 to 2034

Table 24: South Asia and Pacific Market Value (US$ Million) Forecast by Crop Type, 2019 to 2034

Table 25: East Asia Market Value (US$ Million) Forecast by Country, 2019 to 2034

Table 26: East Asia Market Value (US$ Million) Forecast by Equipment, 2019 to 2034

Table 27: East Asia Market Value (US$ Million) Forecast by Type, 2019 to 2034

Table 28: East Asia Market Value (US$ Million) Forecast by Crop Type, 2019 to 2034

Table 29: Middle East and Africa Market Value (US$ Million) Forecast by Country, 2019 to 2034

Table 30: Middle East and Africa Market Value (US$ Million) Forecast by Equipment, 2019 to 2034

Table 31: Middle East and Africa Market Value (US$ Million) Forecast by Type, 2019 to 2034

Table 32: Middle East and Africa Market Value (US$ Million) Forecast by Crop Type, 2019 to 2034

List of Charts

Figure 1: Global Market Value (US$ Million) by Equipment, 2024 to 2034

Figure 2: Global Market Value (US$ Million) by Type, 2024 to 2034

Figure 3: Global Market Value (US$ Million) by Crop Type, 2024 to 2034

Figure 4: Global Market Value (US$ Million) by Region, 2024 to 2034

Figure 5: Global Market Value (US$ Million) Analysis by Region, 2019 to 2034

Figure 6: Global Market Value Share (%) and BPS Analysis by Region, 2024 to 2034

Figure 7: Global Market Y-o-Y Growth (%) Projections by Region, 2024 to 2034

Figure 8: Global Market Value (US$ Million) Analysis by Equipment, 2019 to 2034

Figure 9: Global Market Value Share (%) and BPS Analysis by Equipment, 2024 to 2034

Figure 10: Global Market Y-o-Y Growth (%) Projections by Equipment, 2024 to 2034

Figure 11: Global Market Value (US$ Million) Analysis by Type, 2019 to 2034

Figure 12: Global Market Value Share (%) and BPS Analysis by Type, 2024 to 2034

Figure 13: Global Market Y-o-Y Growth (%) Projections by Type, 2024 to 2034

Figure 14: Global Market Value (US$ Million) Analysis by Crop Type, 2019 to 2034

Figure 15: Global Market Value Share (%) and BPS Analysis by Crop Type, 2024 to 2034

Figure 16: Global Market Y-o-Y Growth (%) Projections by Crop Type, 2024 to 2034

Figure 17: Global Market Attractiveness by Equipment, 2024 to 2034

Figure 18: Global Market Attractiveness by Type, 2024 to 2034

Figure 19: Global Market Attractiveness by Crop Type, 2024 to 2034

Figure 20: Global Market Attractiveness by Region, 2024 to 2034

Figure 21: North America Market Value (US$ Million) by Equipment, 2024 to 2034

Figure 22: North America Market Value (US$ Million) by Type, 2024 to 2034

Figure 23: North America Market Value (US$ Million) by Crop Type, 2024 to 2034

Figure 24: North America Market Value (US$ Million) by Country, 2024 to 2034

Figure 25: North America Market Value (US$ Million) Analysis by Country, 2019 to 2034

Figure 26: North America Market Value Share (%) and BPS Analysis by Country, 2024 to 2034

Figure 27: North America Market Y-o-Y Growth (%) Projections by Country, 2024 to 2034

Figure 28: North America Market Value (US$ Million) Analysis by Equipment, 2019 to 2034

Figure 29: North America Market Value Share (%) and BPS Analysis by Equipment, 2024 to 2034

Figure 30: North America Market Y-o-Y Growth (%) Projections by Equipment, 2024 to 2034

Figure 31: North America Market Value (US$ Million) Analysis by Type, 2019 to 2034

Figure 32: North America Market Value Share (%) and BPS Analysis by Type, 2024 to 2034

Figure 33: North America Market Y-o-Y Growth (%) Projections by Type, 2024 to 2034

Figure 34: North America Market Value (US$ Million) Analysis by Crop Type, 2019 to 2034

Figure 35: North America Market Value Share (%) and BPS Analysis by Crop Type, 2024 to 2034

Figure 36: North America Market Y-o-Y Growth (%) Projections by Crop Type, 2024 to 2034

Figure 37: North America Market Attractiveness by Equipment, 2024 to 2034

Figure 38: North America Market Attractiveness by Type, 2024 to 2034

Figure 39: North America Market Attractiveness by Crop Type, 2024 to 2034

Figure 40: North America Market Attractiveness by Country, 2024 to 2034

Figure 41: Latin America Market Value (US$ Million) by Equipment, 2024 to 2034

Figure 42: Latin America Market Value (US$ Million) by Type, 2024 to 2034

Figure 43: Latin America Market Value (US$ Million) by Crop Type, 2024 to 2034

Figure 44: Latin America Market Value (US$ Million) by Country, 2024 to 2034

Figure 45: Latin America Market Value (US$ Million) Analysis by Country, 2019 to 2034

Figure 46: Latin America Market Value Share (%) and BPS Analysis by Country, 2024 to 2034

Figure 47: Latin America Market Y-o-Y Growth (%) Projections by Country, 2024 to 2034

Figure 48: Latin America Market Value (US$ Million) Analysis by Equipment, 2019 to 2034

Figure 49: Latin America Market Value Share (%) and BPS Analysis by Equipment, 2024 to 2034

Figure 50: Latin America Market Y-o-Y Growth (%) Projections by Equipment, 2024 to 2034

Figure 51: Latin America Market Value (US$ Million) Analysis by Type, 2019 to 2034

Figure 52: Latin America Market Value Share (%) and BPS Analysis by Type, 2024 to 2034

Figure 53: Latin America Market Y-o-Y Growth (%) Projections by Type, 2024 to 2034

Figure 54: Latin America Market Value (US$ Million) Analysis by Crop Type, 2019 to 2034

Figure 55: Latin America Market Value Share (%) and BPS Analysis by Crop Type, 2024 to 2034

Figure 56: Latin America Market Y-o-Y Growth (%) Projections by Crop Type, 2024 to 2034

Figure 57: Latin America Market Attractiveness by Equipment, 2024 to 2034

Figure 58: Latin America Market Attractiveness by Type, 2024 to 2034

Figure 59: Latin America Market Attractiveness by Crop Type, 2024 to 2034

Figure 60: Latin America Market Attractiveness by Country, 2024 to 2034

Figure 61: Western Europe Market Value (US$ Million) by Equipment, 2024 to 2034

Figure 62: Western Europe Market Value (US$ Million) by Type, 2024 to 2034

Figure 63: Western Europe Market Value (US$ Million) by Crop Type, 2024 to 2034

Figure 64: Western Europe Market Value (US$ Million) by Country, 2024 to 2034

Figure 65: Western Europe Market Value (US$ Million) Analysis by Country, 2019 to 2034

Figure 66: Western Europe Market Value Share (%) and BPS Analysis by Country, 2024 to 2034

Figure 67: Western Europe Market Y-o-Y Growth (%) Projections by Country, 2024 to 2034

Figure 68: Western Europe Market Value (US$ Million) Analysis by Equipment, 2019 to 2034

Figure 69: Western Europe Market Value Share (%) and BPS Analysis by Equipment, 2024 to 2034

Figure 70: Western Europe Market Y-o-Y Growth (%) Projections by Equipment, 2024 to 2034

Figure 71: Western Europe Market Value (US$ Million) Analysis by Type, 2019 to 2034

Figure 72: Western Europe Market Value Share (%) and BPS Analysis by Type, 2024 to 2034

Figure 73: Western Europe Market Y-o-Y Growth (%) Projections by Type, 2024 to 2034

Figure 74: Western Europe Market Value (US$ Million) Analysis by Crop Type, 2019 to 2034

Figure 75: Western Europe Market Value Share (%) and BPS Analysis by Crop Type, 2024 to 2034

Figure 76: Western Europe Market Y-o-Y Growth (%) Projections by Crop Type, 2024 to 2034

Figure 77: Western Europe Market Attractiveness by Equipment, 2024 to 2034

Figure 78: Western Europe Market Attractiveness by Type, 2024 to 2034

Figure 79: Western Europe Market Attractiveness by Crop Type, 2024 to 2034

Figure 80: Western Europe Market Attractiveness by Country, 2024 to 2034

Figure 81: Eastern Europe Market Value (US$ Million) by Equipment, 2024 to 2034

Figure 82: Eastern Europe Market Value (US$ Million) by Type, 2024 to 2034

Figure 83: Eastern Europe Market Value (US$ Million) by Crop Type, 2024 to 2034

Figure 84: Eastern Europe Market Value (US$ Million) by Country, 2024 to 2034

Figure 85: Eastern Europe Market Value (US$ Million) Analysis by Country, 2019 to 2034

Figure 86: Eastern Europe Market Value Share (%) and BPS Analysis by Country, 2024 to 2034

Figure 87: Eastern Europe Market Y-o-Y Growth (%) Projections by Country, 2024 to 2034

Figure 88: Eastern Europe Market Value (US$ Million) Analysis by Equipment, 2019 to 2034

Figure 89: Eastern Europe Market Value Share (%) and BPS Analysis by Equipment, 2024 to 2034

Figure 90: Eastern Europe Market Y-o-Y Growth (%) Projections by Equipment, 2024 to 2034

Figure 91: Eastern Europe Market Value (US$ Million) Analysis by Type, 2019 to 2034

Figure 92: Eastern Europe Market Value Share (%) and BPS Analysis by Type, 2024 to 2034

Figure 93: Eastern Europe Market Y-o-Y Growth (%) Projections by Type, 2024 to 2034

Figure 94: Eastern Europe Market Value (US$ Million) Analysis by Crop Type, 2019 to 2034

Figure 95: Eastern Europe Market Value Share (%) and BPS Analysis by Crop Type, 2024 to 2034

Figure 96: Eastern Europe Market Y-o-Y Growth (%) Projections by Crop Type, 2024 to 2034

Figure 97: Eastern Europe Market Attractiveness by Equipment, 2024 to 2034

Figure 98: Eastern Europe Market Attractiveness by Type, 2024 to 2034

Figure 99: Eastern Europe Market Attractiveness by Crop Type, 2024 to 2034

Figure 100: Eastern Europe Market Attractiveness by Country, 2024 to 2034

Figure 101: South Asia and Pacific Market Value (US$ Million) by Equipment, 2024 to 2034

Figure 102: South Asia and Pacific Market Value (US$ Million) by Type, 2024 to 2034

Figure 103: South Asia and Pacific Market Value (US$ Million) by Crop Type, 2024 to 2034

Figure 104: South Asia and Pacific Market Value (US$ Million) by Country, 2024 to 2034

Figure 105: South Asia and Pacific Market Value (US$ Million) Analysis by Country, 2019 to 2034

Figure 106: South Asia and Pacific Market Value Share (%) and BPS Analysis by Country, 2024 to 2034

Figure 107: South Asia and Pacific Market Y-o-Y Growth (%) Projections by Country, 2024 to 2034

Figure 108: South Asia and Pacific Market Value (US$ Million) Analysis by Equipment, 2019 to 2034

Figure 109: South Asia and Pacific Market Value Share (%) and BPS Analysis by Equipment, 2024 to 2034

Figure 110: South Asia and Pacific Market Y-o-Y Growth (%) Projections by Equipment, 2024 to 2034

Figure 111: South Asia and Pacific Market Value (US$ Million) Analysis by Type, 2019 to 2034

Figure 112: South Asia and Pacific Market Value Share (%) and BPS Analysis by Type, 2024 to 2034

Figure 113: South Asia and Pacific Market Y-o-Y Growth (%) Projections by Type, 2024 to 2034

Figure 114: South Asia and Pacific Market Value (US$ Million) Analysis by Crop Type, 2019 to 2034

Figure 115: South Asia and Pacific Market Value Share (%) and BPS Analysis by Crop Type, 2024 to 2034

Figure 116: South Asia and Pacific Market Y-o-Y Growth (%) Projections by Crop Type, 2024 to 2034

Figure 117: South Asia and Pacific Market Attractiveness by Equipment, 2024 to 2034

Figure 118: South Asia and Pacific Market Attractiveness by Type, 2024 to 2034

Figure 119: South Asia and Pacific Market Attractiveness by Crop Type, 2024 to 2034

Figure 120: South Asia and Pacific Market Attractiveness by Country, 2024 to 2034

Figure 121: East Asia Market Value (US$ Million) by Equipment, 2024 to 2034

Figure 122: East Asia Market Value (US$ Million) by Type, 2024 to 2034

Figure 123: East Asia Market Value (US$ Million) by Crop Type, 2024 to 2034

Figure 124: East Asia Market Value (US$ Million) by Country, 2024 to 2034

Figure 125: East Asia Market Value (US$ Million) Analysis by Country, 2019 to 2034

Figure 126: East Asia Market Value Share (%) and BPS Analysis by Country, 2024 to 2034

Figure 127: East Asia Market Y-o-Y Growth (%) Projections by Country, 2024 to 2034

Figure 128: East Asia Market Value (US$ Million) Analysis by Equipment, 2019 to 2034

Figure 129: East Asia Market Value Share (%) and BPS Analysis by Equipment, 2024 to 2034

Figure 130: East Asia Market Y-o-Y Growth (%) Projections by Equipment, 2024 to 2034

Figure 131: East Asia Market Value (US$ Million) Analysis by Type, 2019 to 2034

Figure 132: East Asia Market Value Share (%) and BPS Analysis by Type, 2024 to 2034

Figure 133: East Asia Market Y-o-Y Growth (%) Projections by Type, 2024 to 2034

Figure 134: East Asia Market Value (US$ Million) Analysis by Crop Type, 2019 to 2034

Figure 135: East Asia Market Value Share (%) and BPS Analysis by Crop Type, 2024 to 2034

Figure 136: East Asia Market Y-o-Y Growth (%) Projections by Crop Type, 2024 to 2034

Figure 137: East Asia Market Attractiveness by Equipment, 2024 to 2034

Figure 138: East Asia Market Attractiveness by Type, 2024 to 2034

Figure 139: East Asia Market Attractiveness by Crop Type, 2024 to 2034

Figure 140: East Asia Market Attractiveness by Country, 2024 to 2034

Figure 141: Middle East and Africa Market Value (US$ Million) by Equipment, 2024 to 2034

Figure 142: Middle East and Africa Market Value (US$ Million) by Type, 2024 to 2034

Figure 143: Middle East and Africa Market Value (US$ Million) by Crop Type, 2024 to 2034

Figure 144: Middle East and Africa Market Value (US$ Million) by Country, 2024 to 2034

Figure 145: Middle East and Africa Market Value (US$ Million) Analysis by Country, 2019 to 2034

Figure 146: Middle East and Africa Market Value Share (%) and BPS Analysis by Country, 2024 to 2034

Figure 147: Middle East and Africa Market Y-o-Y Growth (%) Projections by Country, 2024 to 2034

Figure 148: Middle East and Africa Market Value (US$ Million) Analysis by Equipment, 2019 to 2034

Figure 149: Middle East and Africa Market Value Share (%) and BPS Analysis by Equipment, 2024 to 2034

Figure 150: Middle East and Africa Market Y-o-Y Growth (%) Projections by Equipment, 2024 to 2034

Figure 151: Middle East and Africa Market Value (US$ Million) Analysis by Type, 2019 to 2034

Figure 152: Middle East and Africa Market Value Share (%) and BPS Analysis by Type, 2024 to 2034

Figure 153: Middle East and Africa Market Y-o-Y Growth (%) Projections by Type, 2024 to 2034

Figure 154: Middle East and Africa Market Value (US$ Million) Analysis by Crop Type, 2019 to 2034

Figure 155: Middle East and Africa Market Value Share (%) and BPS Analysis by Crop Type, 2024 to 2034

Figure 156: Middle East and Africa Market Y-o-Y Growth (%) Projections by Crop Type, 2024 to 2034

Figure 157: Middle East and Africa Market Attractiveness by Equipment, 2024 to 2034

Figure 158: Middle East and Africa Market Attractiveness by Type, 2024 to 2034

Figure 159: Middle East and Africa Market Attractiveness by Crop Type, 2024 to 2034

Figure 160: Middle East and Africa Market Attractiveness by Country, 2024 to 2034

Recommendations

Consumer Product

Indoor Farming Market

Published : November 2023

Technology

Smart Agriculture Solution Market

Published : June 2023

Explore Technology Insights

View Reports

Commercial Greenhouse Market