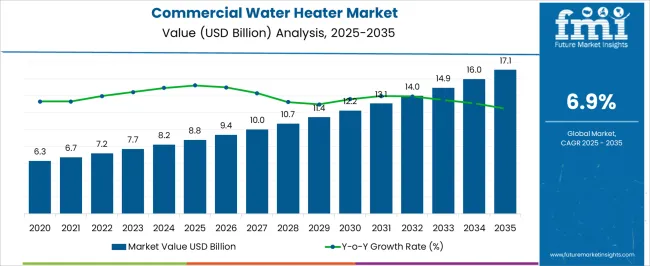
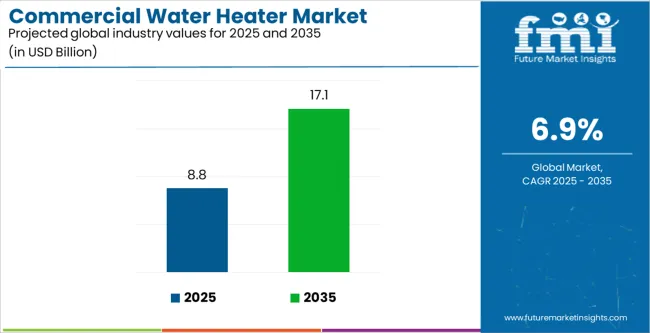
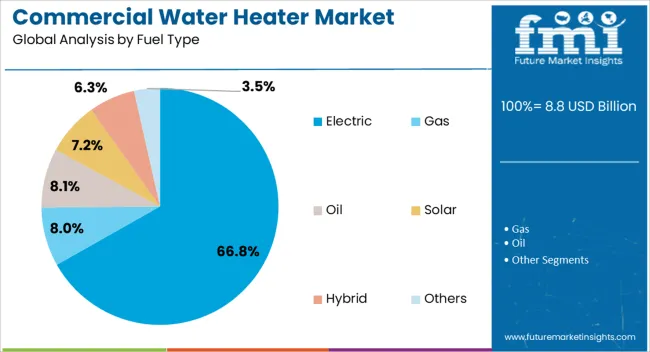
The Commercial Water Heater Market is estimated to be valued at USD 8.2 billion in 2024. The commercial water heater is predicted to rise at a CAGR of 6.9% from 2024 to 2034. The global commercial water heater market is anticipated to reach USD 16 billion by 2034.
One of the defining trends in the commercial water heater market is a growing emphasis on energy efficiency and environmental sustainability. Manufacturers are developing high-efficiency water heaters to meet increasingly stringent energy regulations and to address the demand for eco-friendly solutions. Governments and organizations may offer incentives to encourage the adoption of energy-efficient technologies, further influencing market dynamics.
Technological advancements play a significant role in shaping the market, with the integration of smart features into commercial water heaters. Remote monitoring, control capabilities, and digital controls contribute to operational efficiency and convenience for businesses.
The market also reflects trends in space optimization, with a demand for more compact and space-saving water heater solutions in commercial settings. Additionally, hybrid water heaters, combining features of different types such as tank and tankless systems, have gained traction, offering flexibility and improved efficiency.
Attributes | Key Insights |
---|---|
Estimated Market Size in 2024 | USD 8.2 billion |
Projected Market Value in 2034 | USD 16 billion |
Value-based CAGR from 2024 to 2034 | 6.9% |
From 2019 to 2023, the commercial water heater industry experienced a CAGR of 8.6% in market value. Commercial water heaters find applications across various industries, including hospitality, healthcare, manufacturing, and education. The growth of these industries, along with infrastructure development and urbanization, influences the demand for commercial water heaters on a global scale.
Businesses are increasingly prioritizing sustainability, leading to a demand for water heaters with lower environmental impact. This includes the use of renewable energy sources, heat pump technology, and overall eco-friendly designs. Projections indicate that the global commercial water heater market is expected to experience a CAGR of 6.9% from 2024 to 2034.
Historical CAGR from 2019 to 2023 | 8.6% |
---|---|
Forecast CAGR from 2024 to 2034 | 6.9% |
The following table shows the top five countries by revenue, led by Japan and South Korea. The demand for commercial water heaters in Japan is influenced by the needs of sectors such as hospitality, healthcare, manufacturing, and more. The growth of commercial buildings, hotels, and industrial facilities contributes to a sustained demand for commercial water heating solutions in South Korea.
Countries | The Forecast CAGRs from 2024 to 2034 |
---|---|
United States | 7.2% |
United Kingdom | 8.1% |
China | 7.7% |
Japan | 8.0% |
South Korea | 9.0% |
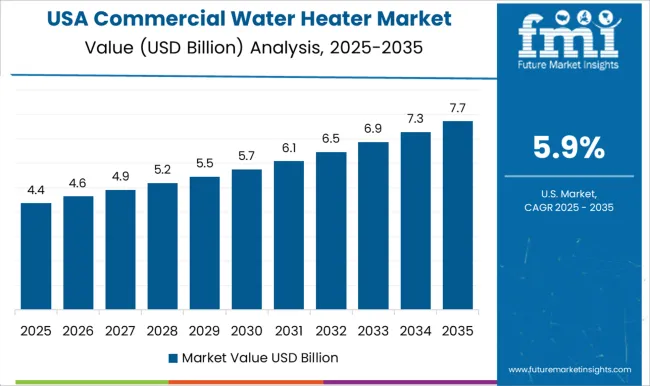
The commercial water heater market in the United States is expected to grow with a CAGR of 7.2% from 2024 to 2034. The growth of the market is attributed to the growth in commercial construction and infrastructure projects, there is an increased need for reliable and energy-efficient water heating solutions.
The United States has been placing a growing emphasis on energy efficiency and environmental sustainability. Federal and state regulations promoting the use of energy-efficient appliances, including water heaters, have driven the adoption of high-efficiency models in the commercial sector.
The commercial water heater market in the United Kingdom is expected to grow with a CAGR of 8.1% from 2024 to 2034. The United Kingdom has been actively working to reduce carbon emissions and improve energy efficiency. Regulations and initiatives aimed at promoting sustainable practices and reducing the carbon footprint influence the adoption of energy-efficient commercial water heaters.
The government has implemented various energy performance standards for commercial buildings. These standards often influence the choice of heating systems, including water heaters, to meet the required energy efficiency criteria.
The commercial water heater market in China is expected to grow with a CAGR of 7.7% from 2024 to 2034. China's ongoing urbanization and infrastructure development contribute significantly to the demand for commercial water heaters. As new commercial buildings, hotels, and industrial facilities are constructed, there is a growing need for efficient water heating systems.
Government initiatives in China play a crucial role in driving market growth. Policies promoting energy efficiency, environmental sustainability, and the use of clean technologies encourage the adoption of advanced and eco-friendly commercial water heaters.
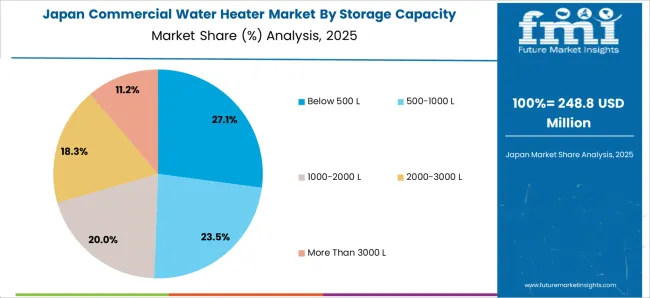
The commercial water heater market in Japan is expected to grow with a CAGR of 8.0% from 2024 to 2034. Japan's interest in renewable energy sources may lead to increased adoption of solar thermal water heaters and other eco-friendly technologies in the commercial sector. Government incentives and initiatives to promote renewable energy can drive this trend.
Different industries in Japan have specific requirements for hot water. The demand for commercial water heaters is influenced by the needs of sectors such as hospitality, healthcare, manufacturing, and more.
Government incentives and subsidies for businesses adopting energy-efficient technologies can stimulate the commercial water heater market. Financial support from the government may encourage businesses to invest in more sustainable heating solutions.
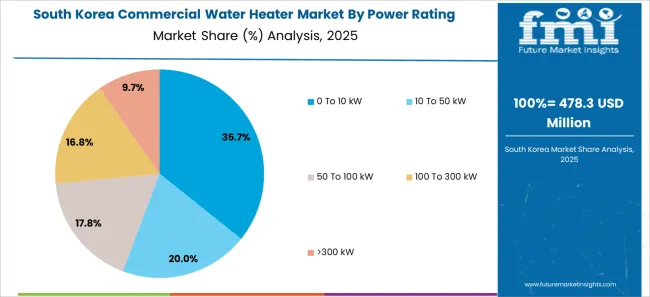
The commercial water heater market in South Korea is expected to grow with a CAGR of 9.0% from 2024 to 2034. South Korea has experienced rapid urbanization and construction activities. The growth of commercial buildings, hotels, and industrial facilities contributes to a sustained demand for water-heating solutions in these spaces.
South Korea is known for its advanced technology and innovation. The integration of smart features, energy-efficient technologies, and improved control systems in commercial water heaters can contribute to market growth as businesses seek modern and efficient solutions.
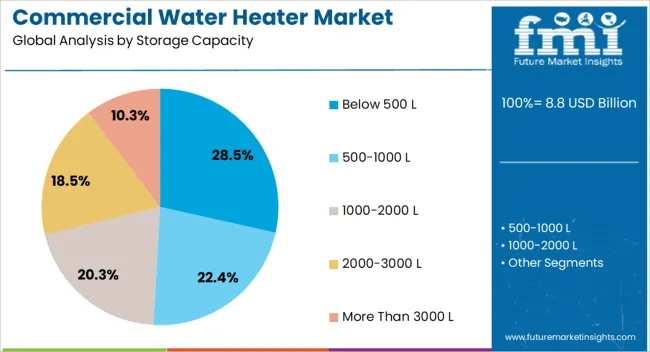
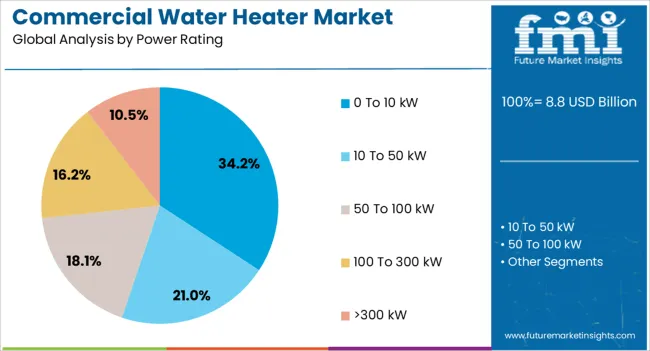
The below section shows the leading segment. The below 500 L segment is to grow at a CAGR of 6.6% from 2024 to 2034. Based on power rating, the 0 to 10 kW segment is anticipated to hold a dominant share through 2034. It is set to exhibit a CAGR of 6.3% from 2024 to 2034.
Category | CAGR |
---|---|
Below 500 L | 6.6% |
0 to 10 kW | 6.3% |
Based on storage capacity, the below 500 L segment is anticipated to grow at a CAGR of 6.6% from 2024 to 2034. Businesses with limited space, such as small restaurants, cafes, or offices, may not have the physical space to accommodate larger water heaters.
Water heaters with capacities below 500L are often more compact and can be installed in areas with space restrictions. Smaller capacity water heaters are generally more energy-efficient for businesses with lower hot water demand. Operating a larger water heater for a small-scale operation could lead to energy wastage, making smaller-capacity heaters more cost-effective and environmentally friendly.
Some regions or industries may have regulations or standards that recommend or mandate the use of water heaters with specific capacities based on the scale of the business. Choosing a below 500L capacity aligns with compliance requirements in such cases.
Based on power rating the 0 to 10 kW segment is anticipated to register a CAGR of 6.3% from 2024 to 2034. Businesses with relatively low hot water requirements, such as small offices, clinics, or retail shops, often find water heaters with 0 to 10 kW power ratings sufficient for their needs. These businesses may not need the high capacities or power outputs of larger heaters.
Smaller commercial water heaters are generally more energy-efficient when the hot water demand is modest. Operating a lower power rating heater for applications with lower requirements helps businesses optimize energy usage and reduce operational costs.
Commercial water heaters with power ratings in the 0 to 10 kW range are often more affordable both in terms of the initial purchase cost and ongoing operational expenses. For businesses with lower hot water demands, investing in a smaller and less powerful unit can be a cost-effective solution.
Businesses with limited physical space for equipment installation may find smaller water heaters more suitable. Water heaters with lower power ratings tend to be more compact, making them easier to install in tight spaces.
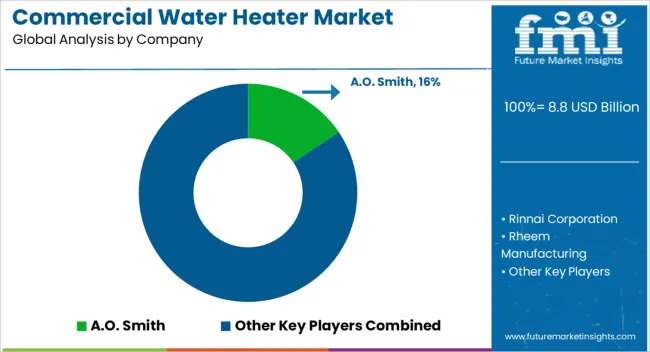
Market players invest in research and development to introduce energy-efficient, smart, and environmentally friendly commercial water heaters. Market players collaborating with other industry players, technology providers, or energy efficiency organizations can help market players enhance their offerings and broaden their market reach.
Attributes | Details |
---|---|
Estimated Market Size in 2024 | USD 8.2 billion |
Projected Market Valuation in 2034 | USD 16 billion |
Value-based CAGR 2024 to 2034 | 6.9% |
Forecast Period | 2024 to 2034 |
Historical Data Available for | 2019 to 2023 |
Market Analysis | Value in USD billion |
Key Regions Covered | North America; Latin America; Western Europe; Eastern Europe; South Asia and Pacific; East Asia; Middle East and Africa |
Key Market Segments Covered | Storage Capacity, Power Rating, Fuel Type, Application, Region |
Key Countries Profiled | The United States, Canada, Brazil, Mexico, Germany, The United Kingdom, France, Spain, Italy, Russia, Poland, Czech Republic, Romania, India, Bangladesh, Australia, New Zealand, China, Japan, South Korea, GCC countries, South Africa, Israel |
Key Companies Profiled | A.O. Smith; Rinnai Corporation; Rheem Manufacturing; Ariston Thermo S.p.A; Racold; Midea Group; Nibe Corporation; Nortiz Corporation; Hubbell; Valliant; Lowe’s; Bradford White Corporation; Flexiheat UK Ltd; Daikin Industries |
Table 1: Global Market Value (US$ Million) Forecast by Region, 2019 to 2034
Table 2: Global Market Volume (Units) Forecast by Region, 2019 to 2034
Table 3: Global Market Value (US$ Million) Forecast by Storage Capacity, 2019 to 2034
Table 4: Global Market Volume (Units) Forecast by Storage Capacity, 2019 to 2034
Table 5: Global Market Value (US$ Million) Forecast by Power Rating, 2019 to 2034
Table 6: Global Market Volume (Units) Forecast by Power Rating, 2019 to 2034
Table 7: Global Market Value (US$ Million) Forecast by Fuel Type, 2019 to 2034
Table 8: Global Market Volume (Units) Forecast by Fuel Type, 2019 to 2034
Table 9: Global Market Value (US$ Million) Forecast by Applications, 2019 to 2034
Table 10: Global Market Volume (Units) Forecast by Applications, 2019 to 2034
Table 11: North America Market Value (US$ Million) Forecast by Country, 2019 to 2034
Table 12: North America Market Volume (Units) Forecast by Country, 2019 to 2034
Table 13: North America Market Value (US$ Million) Forecast by Storage Capacity, 2019 to 2034
Table 14: North America Market Volume (Units) Forecast by Storage Capacity, 2019 to 2034
Table 15: North America Market Value (US$ Million) Forecast by Power Rating, 2019 to 2034
Table 16: North America Market Volume (Units) Forecast by Power Rating, 2019 to 2034
Table 17: North America Market Value (US$ Million) Forecast by Fuel Type, 2019 to 2034
Table 18: North America Market Volume (Units) Forecast by Fuel Type, 2019 to 2034
Table 19: North America Market Value (US$ Million) Forecast by Applications, 2019 to 2034
Table 20: North America Market Volume (Units) Forecast by Applications, 2019 to 2034
Table 21: Latin America Market Value (US$ Million) Forecast by Country, 2019 to 2034
Table 22: Latin America Market Volume (Units) Forecast by Country, 2019 to 2034
Table 23: Latin America Market Value (US$ Million) Forecast by Storage Capacity, 2019 to 2034
Table 24: Latin America Market Volume (Units) Forecast by Storage Capacity, 2019 to 2034
Table 25: Latin America Market Value (US$ Million) Forecast by Power Rating, 2019 to 2034
Table 26: Latin America Market Volume (Units) Forecast by Power Rating, 2019 to 2034
Table 27: Latin America Market Value (US$ Million) Forecast by Fuel Type, 2019 to 2034
Table 28: Latin America Market Volume (Units) Forecast by Fuel Type, 2019 to 2034
Table 29: Latin America Market Value (US$ Million) Forecast by Applications, 2019 to 2034
Table 30: Latin America Market Volume (Units) Forecast by Applications, 2019 to 2034
Table 31: Western Europe Market Value (US$ Million) Forecast by Country, 2019 to 2034
Table 32: Western Europe Market Volume (Units) Forecast by Country, 2019 to 2034
Table 33: Western Europe Market Value (US$ Million) Forecast by Storage Capacity, 2019 to 2034
Table 34: Western Europe Market Volume (Units) Forecast by Storage Capacity, 2019 to 2034
Table 35: Western Europe Market Value (US$ Million) Forecast by Power Rating, 2019 to 2034
Table 36: Western Europe Market Volume (Units) Forecast by Power Rating, 2019 to 2034
Table 37: Western Europe Market Value (US$ Million) Forecast by Fuel Type, 2019 to 2034
Table 38: Western Europe Market Volume (Units) Forecast by Fuel Type, 2019 to 2034
Table 39: Western Europe Market Value (US$ Million) Forecast by Applications, 2019 to 2034
Table 40: Western Europe Market Volume (Units) Forecast by Applications, 2019 to 2034
Table 41: Eastern Europe Market Value (US$ Million) Forecast by Country, 2019 to 2034
Table 42: Eastern Europe Market Volume (Units) Forecast by Country, 2019 to 2034
Table 43: Eastern Europe Market Value (US$ Million) Forecast by Storage Capacity, 2019 to 2034
Table 44: Eastern Europe Market Volume (Units) Forecast by Storage Capacity, 2019 to 2034
Table 45: Eastern Europe Market Value (US$ Million) Forecast by Power Rating, 2019 to 2034
Table 46: Eastern Europe Market Volume (Units) Forecast by Power Rating, 2019 to 2034
Table 47: Eastern Europe Market Value (US$ Million) Forecast by Fuel Type, 2019 to 2034
Table 48: Eastern Europe Market Volume (Units) Forecast by Fuel Type, 2019 to 2034
Table 49: Eastern Europe Market Value (US$ Million) Forecast by Applications, 2019 to 2034
Table 50: Eastern Europe Market Volume (Units) Forecast by Applications, 2019 to 2034
Table 51: South Asia and Pacific Market Value (US$ Million) Forecast by Country, 2019 to 2034
Table 52: South Asia and Pacific Market Volume (Units) Forecast by Country, 2019 to 2034
Table 53: South Asia and Pacific Market Value (US$ Million) Forecast by Storage Capacity, 2019 to 2034
Table 54: South Asia and Pacific Market Volume (Units) Forecast by Storage Capacity, 2019 to 2034
Table 55: South Asia and Pacific Market Value (US$ Million) Forecast by Power Rating, 2019 to 2034
Table 56: South Asia and Pacific Market Volume (Units) Forecast by Power Rating, 2019 to 2034
Table 57: South Asia and Pacific Market Value (US$ Million) Forecast by Fuel Type, 2019 to 2034
Table 58: South Asia and Pacific Market Volume (Units) Forecast by Fuel Type, 2019 to 2034
Table 59: South Asia and Pacific Market Value (US$ Million) Forecast by Applications, 2019 to 2034
Table 60: South Asia and Pacific Market Volume (Units) Forecast by Applications, 2019 to 2034
Table 61: East Asia Market Value (US$ Million) Forecast by Country, 2019 to 2034
Table 62: East Asia Market Volume (Units) Forecast by Country, 2019 to 2034
Table 63: East Asia Market Value (US$ Million) Forecast by Storage Capacity, 2019 to 2034
Table 64: East Asia Market Volume (Units) Forecast by Storage Capacity, 2019 to 2034
Table 65: East Asia Market Value (US$ Million) Forecast by Power Rating, 2019 to 2034
Table 66: East Asia Market Volume (Units) Forecast by Power Rating, 2019 to 2034
Table 67: East Asia Market Value (US$ Million) Forecast by Fuel Type, 2019 to 2034
Table 68: East Asia Market Volume (Units) Forecast by Fuel Type, 2019 to 2034
Table 69: East Asia Market Value (US$ Million) Forecast by Applications, 2019 to 2034
Table 70: East Asia Market Volume (Units) Forecast by Applications, 2019 to 2034
Table 71: Middle East and Africa Market Value (US$ Million) Forecast by Country, 2019 to 2034
Table 72: Middle East and Africa Market Volume (Units) Forecast by Country, 2019 to 2034
Table 73: Middle East and Africa Market Value (US$ Million) Forecast by Storage Capacity, 2019 to 2034
Table 74: Middle East and Africa Market Volume (Units) Forecast by Storage Capacity, 2019 to 2034
Table 75: Middle East and Africa Market Value (US$ Million) Forecast by Power Rating, 2019 to 2034
Table 76: Middle East and Africa Market Volume (Units) Forecast by Power Rating, 2019 to 2034
Table 77: Middle East and Africa Market Value (US$ Million) Forecast by Fuel Type, 2019 to 2034
Table 78: Middle East and Africa Market Volume (Units) Forecast by Fuel Type, 2019 to 2034
Table 79: Middle East and Africa Market Value (US$ Million) Forecast by Applications, 2019 to 2034
Table 80: Middle East and Africa Market Volume (Units) Forecast by Applications, 2019 to 2034
Figure 1: Global Market Value (US$ Million) by Storage Capacity, 2024 to 2034
Figure 2: Global Market Value (US$ Million) by Power Rating, 2024 to 2034
Figure 3: Global Market Value (US$ Million) by Fuel Type, 2024 to 2034
Figure 4: Global Market Value (US$ Million) by Applications, 2024 to 2034
Figure 5: Global Market Value (US$ Million) by Region, 2024 to 2034
Figure 6: Global Market Value (US$ Million) Analysis by Region, 2019 to 2034
Figure 7: Global Market Volume (Units) Analysis by Region, 2019 to 2034
Figure 8: Global Market Value Share (%) and BPS Analysis by Region, 2024 to 2034
Figure 9: Global Market Y-o-Y Growth (%) Projections by Region, 2024 to 2034
Figure 10: Global Market Value (US$ Million) Analysis by Storage Capacity, 2019 to 2034
Figure 11: Global Market Volume (Units) Analysis by Storage Capacity, 2019 to 2034
Figure 12: Global Market Value Share (%) and BPS Analysis by Storage Capacity, 2024 to 2034
Figure 13: Global Market Y-o-Y Growth (%) Projections by Storage Capacity, 2024 to 2034
Figure 14: Global Market Value (US$ Million) Analysis by Power Rating, 2019 to 2034
Figure 15: Global Market Volume (Units) Analysis by Power Rating, 2019 to 2034
Figure 16: Global Market Value Share (%) and BPS Analysis by Power Rating, 2024 to 2034
Figure 17: Global Market Y-o-Y Growth (%) Projections by Power Rating, 2024 to 2034
Figure 18: Global Market Value (US$ Million) Analysis by Fuel Type, 2019 to 2034
Figure 19: Global Market Volume (Units) Analysis by Fuel Type, 2019 to 2034
Figure 20: Global Market Value Share (%) and BPS Analysis by Fuel Type, 2024 to 2034
Figure 21: Global Market Y-o-Y Growth (%) Projections by Fuel Type, 2024 to 2034
Figure 22: Global Market Value (US$ Million) Analysis by Applications, 2019 to 2034
Figure 23: Global Market Volume (Units) Analysis by Applications, 2019 to 2034
Figure 24: Global Market Value Share (%) and BPS Analysis by Applications, 2024 to 2034
Figure 25: Global Market Y-o-Y Growth (%) Projections by Applications, 2024 to 2034
Figure 26: Global Market Attractiveness by Storage Capacity, 2024 to 2034
Figure 27: Global Market Attractiveness by Power Rating, 2024 to 2034
Figure 28: Global Market Attractiveness by Fuel Type, 2024 to 2034
Figure 29: Global Market Attractiveness by Applications, 2024 to 2034
Figure 30: Global Market Attractiveness by Region, 2024 to 2034
Figure 31: North America Market Value (US$ Million) by Storage Capacity, 2024 to 2034
Figure 32: North America Market Value (US$ Million) by Power Rating, 2024 to 2034
Figure 33: North America Market Value (US$ Million) by Fuel Type, 2024 to 2034
Figure 34: North America Market Value (US$ Million) by Applications, 2024 to 2034
Figure 35: North America Market Value (US$ Million) by Country, 2024 to 2034
Figure 36: North America Market Value (US$ Million) Analysis by Country, 2019 to 2034
Figure 37: North America Market Volume (Units) Analysis by Country, 2019 to 2034
Figure 38: North America Market Value Share (%) and BPS Analysis by Country, 2024 to 2034
Figure 39: North America Market Y-o-Y Growth (%) Projections by Country, 2024 to 2034
Figure 40: North America Market Value (US$ Million) Analysis by Storage Capacity, 2019 to 2034
Figure 41: North America Market Volume (Units) Analysis by Storage Capacity, 2019 to 2034
Figure 42: North America Market Value Share (%) and BPS Analysis by Storage Capacity, 2024 to 2034
Figure 43: North America Market Y-o-Y Growth (%) Projections by Storage Capacity, 2024 to 2034
Figure 44: North America Market Value (US$ Million) Analysis by Power Rating, 2019 to 2034
Figure 45: North America Market Volume (Units) Analysis by Power Rating, 2019 to 2034
Figure 46: North America Market Value Share (%) and BPS Analysis by Power Rating, 2024 to 2034
Figure 47: North America Market Y-o-Y Growth (%) Projections by Power Rating, 2024 to 2034
Figure 48: North America Market Value (US$ Million) Analysis by Fuel Type, 2019 to 2034
Figure 49: North America Market Volume (Units) Analysis by Fuel Type, 2019 to 2034
Figure 50: North America Market Value Share (%) and BPS Analysis by Fuel Type, 2024 to 2034
Figure 51: North America Market Y-o-Y Growth (%) Projections by Fuel Type, 2024 to 2034
Figure 52: North America Market Value (US$ Million) Analysis by Applications, 2019 to 2034
Figure 53: North America Market Volume (Units) Analysis by Applications, 2019 to 2034
Figure 54: North America Market Value Share (%) and BPS Analysis by Applications, 2024 to 2034
Figure 55: North America Market Y-o-Y Growth (%) Projections by Applications, 2024 to 2034
Figure 56: North America Market Attractiveness by Storage Capacity, 2024 to 2034
Figure 57: North America Market Attractiveness by Power Rating, 2024 to 2034
Figure 58: North America Market Attractiveness by Fuel Type, 2024 to 2034
Figure 59: North America Market Attractiveness by Applications, 2024 to 2034
Figure 60: North America Market Attractiveness by Country, 2024 to 2034
Figure 61: Latin America Market Value (US$ Million) by Storage Capacity, 2024 to 2034
Figure 62: Latin America Market Value (US$ Million) by Power Rating, 2024 to 2034
Figure 63: Latin America Market Value (US$ Million) by Fuel Type, 2024 to 2034
Figure 64: Latin America Market Value (US$ Million) by Applications, 2024 to 2034
Figure 65: Latin America Market Value (US$ Million) by Country, 2024 to 2034
Figure 66: Latin America Market Value (US$ Million) Analysis by Country, 2019 to 2034
Figure 67: Latin America Market Volume (Units) Analysis by Country, 2019 to 2034
Figure 68: Latin America Market Value Share (%) and BPS Analysis by Country, 2024 to 2034
Figure 69: Latin America Market Y-o-Y Growth (%) Projections by Country, 2024 to 2034
Figure 70: Latin America Market Value (US$ Million) Analysis by Storage Capacity, 2019 to 2034
Figure 71: Latin America Market Volume (Units) Analysis by Storage Capacity, 2019 to 2034
Figure 72: Latin America Market Value Share (%) and BPS Analysis by Storage Capacity, 2024 to 2034
Figure 73: Latin America Market Y-o-Y Growth (%) Projections by Storage Capacity, 2024 to 2034
Figure 74: Latin America Market Value (US$ Million) Analysis by Power Rating, 2019 to 2034
Figure 75: Latin America Market Volume (Units) Analysis by Power Rating, 2019 to 2034
Figure 76: Latin America Market Value Share (%) and BPS Analysis by Power Rating, 2024 to 2034
Figure 77: Latin America Market Y-o-Y Growth (%) Projections by Power Rating, 2024 to 2034
Figure 78: Latin America Market Value (US$ Million) Analysis by Fuel Type, 2019 to 2034
Figure 79: Latin America Market Volume (Units) Analysis by Fuel Type, 2019 to 2034
Figure 80: Latin America Market Value Share (%) and BPS Analysis by Fuel Type, 2024 to 2034
Figure 81: Latin America Market Y-o-Y Growth (%) Projections by Fuel Type, 2024 to 2034
Figure 82: Latin America Market Value (US$ Million) Analysis by Applications, 2019 to 2034
Figure 83: Latin America Market Volume (Units) Analysis by Applications, 2019 to 2034
Figure 84: Latin America Market Value Share (%) and BPS Analysis by Applications, 2024 to 2034
Figure 85: Latin America Market Y-o-Y Growth (%) Projections by Applications, 2024 to 2034
Figure 86: Latin America Market Attractiveness by Storage Capacity, 2024 to 2034
Figure 87: Latin America Market Attractiveness by Power Rating, 2024 to 2034
Figure 88: Latin America Market Attractiveness by Fuel Type, 2024 to 2034
Figure 89: Latin America Market Attractiveness by Applications, 2024 to 2034
Figure 90: Latin America Market Attractiveness by Country, 2024 to 2034
Figure 91: Western Europe Market Value (US$ Million) by Storage Capacity, 2024 to 2034
Figure 92: Western Europe Market Value (US$ Million) by Power Rating, 2024 to 2034
Figure 93: Western Europe Market Value (US$ Million) by Fuel Type, 2024 to 2034
Figure 94: Western Europe Market Value (US$ Million) by Applications, 2024 to 2034
Figure 95: Western Europe Market Value (US$ Million) by Country, 2024 to 2034
Figure 96: Western Europe Market Value (US$ Million) Analysis by Country, 2019 to 2034
Figure 97: Western Europe Market Volume (Units) Analysis by Country, 2019 to 2034
Figure 98: Western Europe Market Value Share (%) and BPS Analysis by Country, 2024 to 2034
Figure 99: Western Europe Market Y-o-Y Growth (%) Projections by Country, 2024 to 2034
Figure 100: Western Europe Market Value (US$ Million) Analysis by Storage Capacity, 2019 to 2034
Figure 101: Western Europe Market Volume (Units) Analysis by Storage Capacity, 2019 to 2034
Figure 102: Western Europe Market Value Share (%) and BPS Analysis by Storage Capacity, 2024 to 2034
Figure 103: Western Europe Market Y-o-Y Growth (%) Projections by Storage Capacity, 2024 to 2034
Figure 104: Western Europe Market Value (US$ Million) Analysis by Power Rating, 2019 to 2034
Figure 105: Western Europe Market Volume (Units) Analysis by Power Rating, 2019 to 2034
Figure 106: Western Europe Market Value Share (%) and BPS Analysis by Power Rating, 2024 to 2034
Figure 107: Western Europe Market Y-o-Y Growth (%) Projections by Power Rating, 2024 to 2034
Figure 108: Western Europe Market Value (US$ Million) Analysis by Fuel Type, 2019 to 2034
Figure 109: Western Europe Market Volume (Units) Analysis by Fuel Type, 2019 to 2034
Figure 110: Western Europe Market Value Share (%) and BPS Analysis by Fuel Type, 2024 to 2034
Figure 111: Western Europe Market Y-o-Y Growth (%) Projections by Fuel Type, 2024 to 2034
Figure 112: Western Europe Market Value (US$ Million) Analysis by Applications, 2019 to 2034
Figure 113: Western Europe Market Volume (Units) Analysis by Applications, 2019 to 2034
Figure 114: Western Europe Market Value Share (%) and BPS Analysis by Applications, 2024 to 2034
Figure 115: Western Europe Market Y-o-Y Growth (%) Projections by Applications, 2024 to 2034
Figure 116: Western Europe Market Attractiveness by Storage Capacity, 2024 to 2034
Figure 117: Western Europe Market Attractiveness by Power Rating, 2024 to 2034
Figure 118: Western Europe Market Attractiveness by Fuel Type, 2024 to 2034
Figure 119: Western Europe Market Attractiveness by Applications, 2024 to 2034
Figure 120: Western Europe Market Attractiveness by Country, 2024 to 2034
Figure 121: Eastern Europe Market Value (US$ Million) by Storage Capacity, 2024 to 2034
Figure 122: Eastern Europe Market Value (US$ Million) by Power Rating, 2024 to 2034
Figure 123: Eastern Europe Market Value (US$ Million) by Fuel Type, 2024 to 2034
Figure 124: Eastern Europe Market Value (US$ Million) by Applications, 2024 to 2034
Figure 125: Eastern Europe Market Value (US$ Million) by Country, 2024 to 2034
Figure 126: Eastern Europe Market Value (US$ Million) Analysis by Country, 2019 to 2034
Figure 127: Eastern Europe Market Volume (Units) Analysis by Country, 2019 to 2034
Figure 128: Eastern Europe Market Value Share (%) and BPS Analysis by Country, 2024 to 2034
Figure 129: Eastern Europe Market Y-o-Y Growth (%) Projections by Country, 2024 to 2034
Figure 130: Eastern Europe Market Value (US$ Million) Analysis by Storage Capacity, 2019 to 2034
Figure 131: Eastern Europe Market Volume (Units) Analysis by Storage Capacity, 2019 to 2034
Figure 132: Eastern Europe Market Value Share (%) and BPS Analysis by Storage Capacity, 2024 to 2034
Figure 133: Eastern Europe Market Y-o-Y Growth (%) Projections by Storage Capacity, 2024 to 2034
Figure 134: Eastern Europe Market Value (US$ Million) Analysis by Power Rating, 2019 to 2034
Figure 135: Eastern Europe Market Volume (Units) Analysis by Power Rating, 2019 to 2034
Figure 136: Eastern Europe Market Value Share (%) and BPS Analysis by Power Rating, 2024 to 2034
Figure 137: Eastern Europe Market Y-o-Y Growth (%) Projections by Power Rating, 2024 to 2034
Figure 138: Eastern Europe Market Value (US$ Million) Analysis by Fuel Type, 2019 to 2034
Figure 139: Eastern Europe Market Volume (Units) Analysis by Fuel Type, 2019 to 2034
Figure 140: Eastern Europe Market Value Share (%) and BPS Analysis by Fuel Type, 2024 to 2034
Figure 141: Eastern Europe Market Y-o-Y Growth (%) Projections by Fuel Type, 2024 to 2034
Figure 142: Eastern Europe Market Value (US$ Million) Analysis by Applications, 2019 to 2034
Figure 143: Eastern Europe Market Volume (Units) Analysis by Applications, 2019 to 2034
Figure 144: Eastern Europe Market Value Share (%) and BPS Analysis by Applications, 2024 to 2034
Figure 145: Eastern Europe Market Y-o-Y Growth (%) Projections by Applications, 2024 to 2034
Figure 146: Eastern Europe Market Attractiveness by Storage Capacity, 2024 to 2034
Figure 147: Eastern Europe Market Attractiveness by Power Rating, 2024 to 2034
Figure 148: Eastern Europe Market Attractiveness by Fuel Type, 2024 to 2034
Figure 149: Eastern Europe Market Attractiveness by Applications, 2024 to 2034
Figure 150: Eastern Europe Market Attractiveness by Country, 2024 to 2034
Figure 151: South Asia and Pacific Market Value (US$ Million) by Storage Capacity, 2024 to 2034
Figure 152: South Asia and Pacific Market Value (US$ Million) by Power Rating, 2024 to 2034
Figure 153: South Asia and Pacific Market Value (US$ Million) by Fuel Type, 2024 to 2034
Figure 154: South Asia and Pacific Market Value (US$ Million) by Applications, 2024 to 2034
Figure 155: South Asia and Pacific Market Value (US$ Million) by Country, 2024 to 2034
Figure 156: South Asia and Pacific Market Value (US$ Million) Analysis by Country, 2019 to 2034
Figure 157: South Asia and Pacific Market Volume (Units) Analysis by Country, 2019 to 2034
Figure 158: South Asia and Pacific Market Value Share (%) and BPS Analysis by Country, 2024 to 2034
Figure 159: South Asia and Pacific Market Y-o-Y Growth (%) Projections by Country, 2024 to 2034
Figure 160: South Asia and Pacific Market Value (US$ Million) Analysis by Storage Capacity, 2019 to 2034
Figure 161: South Asia and Pacific Market Volume (Units) Analysis by Storage Capacity, 2019 to 2034
Figure 162: South Asia and Pacific Market Value Share (%) and BPS Analysis by Storage Capacity, 2024 to 2034
Figure 163: South Asia and Pacific Market Y-o-Y Growth (%) Projections by Storage Capacity, 2024 to 2034
Figure 164: South Asia and Pacific Market Value (US$ Million) Analysis by Power Rating, 2019 to 2034
Figure 165: South Asia and Pacific Market Volume (Units) Analysis by Power Rating, 2019 to 2034
Figure 166: South Asia and Pacific Market Value Share (%) and BPS Analysis by Power Rating, 2024 to 2034
Figure 167: South Asia and Pacific Market Y-o-Y Growth (%) Projections by Power Rating, 2024 to 2034
Figure 168: South Asia and Pacific Market Value (US$ Million) Analysis by Fuel Type, 2019 to 2034
Figure 169: South Asia and Pacific Market Volume (Units) Analysis by Fuel Type, 2019 to 2034
Figure 170: South Asia and Pacific Market Value Share (%) and BPS Analysis by Fuel Type, 2024 to 2034
Figure 171: South Asia and Pacific Market Y-o-Y Growth (%) Projections by Fuel Type, 2024 to 2034
Figure 172: South Asia and Pacific Market Value (US$ Million) Analysis by Applications, 2019 to 2034
Figure 173: South Asia and Pacific Market Volume (Units) Analysis by Applications, 2019 to 2034
Figure 174: South Asia and Pacific Market Value Share (%) and BPS Analysis by Applications, 2024 to 2034
Figure 175: South Asia and Pacific Market Y-o-Y Growth (%) Projections by Applications, 2024 to 2034
Figure 176: South Asia and Pacific Market Attractiveness by Storage Capacity, 2024 to 2034
Figure 177: South Asia and Pacific Market Attractiveness by Power Rating, 2024 to 2034
Figure 178: South Asia and Pacific Market Attractiveness by Fuel Type, 2024 to 2034
Figure 179: South Asia and Pacific Market Attractiveness by Applications, 2024 to 2034
Figure 180: South Asia and Pacific Market Attractiveness by Country, 2024 to 2034
Figure 181: East Asia Market Value (US$ Million) by Storage Capacity, 2024 to 2034
Figure 182: East Asia Market Value (US$ Million) by Power Rating, 2024 to 2034
Figure 183: East Asia Market Value (US$ Million) by Fuel Type, 2024 to 2034
Figure 184: East Asia Market Value (US$ Million) by Applications, 2024 to 2034
Figure 185: East Asia Market Value (US$ Million) by Country, 2024 to 2034
Figure 186: East Asia Market Value (US$ Million) Analysis by Country, 2019 to 2034
Figure 187: East Asia Market Volume (Units) Analysis by Country, 2019 to 2034
Figure 188: East Asia Market Value Share (%) and BPS Analysis by Country, 2024 to 2034
Figure 189: East Asia Market Y-o-Y Growth (%) Projections by Country, 2024 to 2034
Figure 190: East Asia Market Value (US$ Million) Analysis by Storage Capacity, 2019 to 2034
Figure 191: East Asia Market Volume (Units) Analysis by Storage Capacity, 2019 to 2034
Figure 192: East Asia Market Value Share (%) and BPS Analysis by Storage Capacity, 2024 to 2034
Figure 193: East Asia Market Y-o-Y Growth (%) Projections by Storage Capacity, 2024 to 2034
Figure 194: East Asia Market Value (US$ Million) Analysis by Power Rating, 2019 to 2034
Figure 195: East Asia Market Volume (Units) Analysis by Power Rating, 2019 to 2034
Figure 196: East Asia Market Value Share (%) and BPS Analysis by Power Rating, 2024 to 2034
Figure 197: East Asia Market Y-o-Y Growth (%) Projections by Power Rating, 2024 to 2034
Figure 198: East Asia Market Value (US$ Million) Analysis by Fuel Type, 2019 to 2034
Figure 199: East Asia Market Volume (Units) Analysis by Fuel Type, 2019 to 2034
Figure 200: East Asia Market Value Share (%) and BPS Analysis by Fuel Type, 2024 to 2034
Figure 201: East Asia Market Y-o-Y Growth (%) Projections by Fuel Type, 2024 to 2034
Figure 202: East Asia Market Value (US$ Million) Analysis by Applications, 2019 to 2034
Figure 203: East Asia Market Volume (Units) Analysis by Applications, 2019 to 2034
Figure 204: East Asia Market Value Share (%) and BPS Analysis by Applications, 2024 to 2034
Figure 205: East Asia Market Y-o-Y Growth (%) Projections by Applications, 2024 to 2034
Figure 206: East Asia Market Attractiveness by Storage Capacity, 2024 to 2034
Figure 207: East Asia Market Attractiveness by Power Rating, 2024 to 2034
Figure 208: East Asia Market Attractiveness by Fuel Type, 2024 to 2034
Figure 209: East Asia Market Attractiveness by Applications, 2024 to 2034
Figure 210: East Asia Market Attractiveness by Country, 2024 to 2034
Figure 211: Middle East and Africa Market Value (US$ Million) by Storage Capacity, 2024 to 2034
Figure 212: Middle East and Africa Market Value (US$ Million) by Power Rating, 2024 to 2034
Figure 213: Middle East and Africa Market Value (US$ Million) by Fuel Type, 2024 to 2034
Figure 214: Middle East and Africa Market Value (US$ Million) by Applications, 2024 to 2034
Figure 215: Middle East and Africa Market Value (US$ Million) by Country, 2024 to 2034
Figure 216: Middle East and Africa Market Value (US$ Million) Analysis by Country, 2019 to 2034
Figure 217: Middle East and Africa Market Volume (Units) Analysis by Country, 2019 to 2034
Figure 218: Middle East and Africa Market Value Share (%) and BPS Analysis by Country, 2024 to 2034
Figure 219: Middle East and Africa Market Y-o-Y Growth (%) Projections by Country, 2024 to 2034
Figure 220: Middle East and Africa Market Value (US$ Million) Analysis by Storage Capacity, 2019 to 2034
Figure 221: Middle East and Africa Market Volume (Units) Analysis by Storage Capacity, 2019 to 2034
Figure 222: Middle East and Africa Market Value Share (%) and BPS Analysis by Storage Capacity, 2024 to 2034
Figure 223: Middle East and Africa Market Y-o-Y Growth (%) Projections by Storage Capacity, 2024 to 2034
Figure 224: Middle East and Africa Market Value (US$ Million) Analysis by Power Rating, 2019 to 2034
Figure 225: Middle East and Africa Market Volume (Units) Analysis by Power Rating, 2019 to 2034
Figure 226: Middle East and Africa Market Value Share (%) and BPS Analysis by Power Rating, 2024 to 2034
Figure 227: Middle East and Africa Market Y-o-Y Growth (%) Projections by Power Rating, 2024 to 2034
Figure 228: Middle East and Africa Market Value (US$ Million) Analysis by Fuel Type, 2019 to 2034
Figure 229: Middle East and Africa Market Volume (Units) Analysis by Fuel Type, 2019 to 2034
Figure 230: Middle East and Africa Market Value Share (%) and BPS Analysis by Fuel Type, 2024 to 2034
Figure 231: Middle East and Africa Market Y-o-Y Growth (%) Projections by Fuel Type, 2024 to 2034
Figure 232: Middle East and Africa Market Value (US$ Million) Analysis by Applications, 2019 to 2034
Figure 233: Middle East and Africa Market Volume (Units) Analysis by Applications, 2019 to 2034
Figure 234: Middle East and Africa Market Value Share (%) and BPS Analysis by Applications, 2024 to 2034
Figure 235: Middle East and Africa Market Y-o-Y Growth (%) Projections by Applications, 2024 to 2034
Figure 236: Middle East and Africa Market Attractiveness by Storage Capacity, 2024 to 2034
Figure 237: Middle East and Africa Market Attractiveness by Power Rating, 2024 to 2034
Figure 238: Middle East and Africa Market Attractiveness by Fuel Type, 2024 to 2034
Figure 239: Middle East and Africa Market Attractiveness by Applications, 2024 to 2034
Figure 240: Middle East and Africa Market Attractiveness by Country, 2024 to 2034
As of 2024, the market for commercial water heaters is expected to be valued at USD 8.2 billion.
By 2034, the market value of commercial water heaters is expected to reach USD 16 billion.
From 2024 to 2034, commercial water heaters are expected to flourish at a CAGR of 6.9%
The below 500 L segment is expected to grow at a CAGR of 6.6% from 2024 to 2034.
South Korea is likely the top-performing market, with a CAGR of 9.0%.
Explore Similar Insights
Thank you!
You will receive an email from our Business Development Manager. Please be sure to check your SPAM/JUNK folder too.