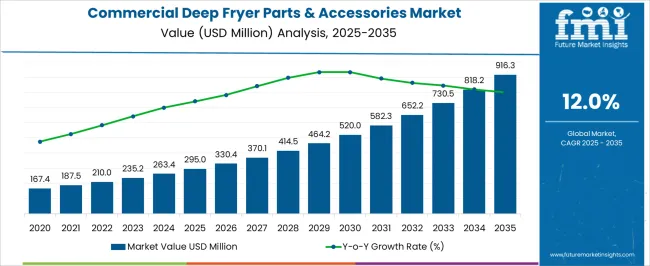
The Commercial Deep Fryer Parts & Accessories Market is estimated to be valued at USD 295.0 million in 2025 and is projected to reach USD 916.3 million by 2035, registering a compound annual growth rate (CAGR) of 12.0% over the forecast period.
| Metric | Value |
|---|---|
| Commercial Deep Fryer Parts & Accessories Market Estimated Value in (2025 E) | USD 295.0 million |
| Commercial Deep Fryer Parts & Accessories Market Forecast Value in (2035 F) | USD 916.3 million |
| Forecast CAGR (2025 to 2035) | 12.0% |
The commercial deep fryer parts and accessories market is experiencing consistent growth driven by the expansion of quick service restaurants, rising demand for fried foods, and the modernization of commercial kitchen infrastructure. Operators are increasingly focusing on energy efficiency, safety, and extended equipment life, which has boosted demand for replacement parts and functional accessories.
Innovations in durable fryer components and accessories such as advanced oil filtration systems, insulated covers, and safety features are enhancing operational performance and lowering maintenance costs. Additionally, regulatory emphasis on food safety and energy standards is encouraging adoption of upgraded fryer parts to ensure compliance.
The market outlook remains positive as foodservice operators continue to invest in reliable equipment solutions that improve productivity, extend fryer longevity, and meet evolving culinary demands across global foodservice chains.
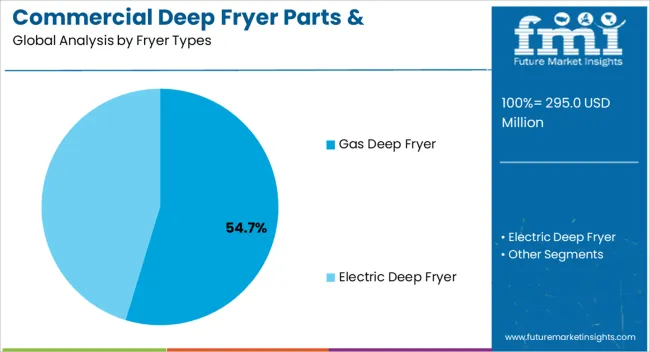
The gas deep fryer type segment is expected to account for 54.70% of total revenue by 2025 within the fryer type category, making it the dominant segment. This position is supported by the high efficiency and lower operating costs associated with gas powered fryers compared to electric models.
Their ability to deliver faster heating times and consistent temperature control has been valued in high volume commercial kitchens. Additionally, gas fryers are often preferred in regions with lower natural gas prices, further driving adoption.
Their compatibility with a wide range of accessories and parts has strengthened their market leadership within the fryer type category.
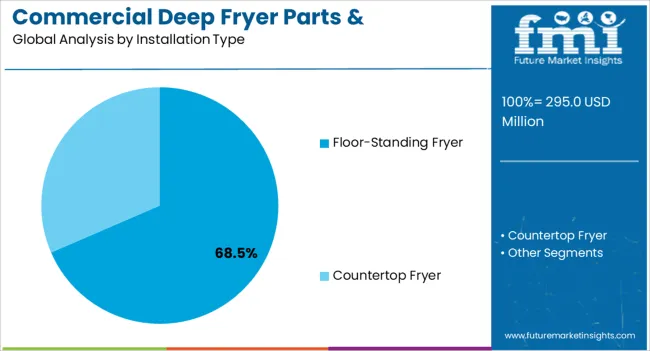
The floor standing fryer segment is projected to represent 68.50% of total market revenue by 2025 within the installation type category, establishing it as the leading segment. This dominance is driven by their suitability for high capacity cooking and ability to handle continuous frying operations in busy commercial kitchens.
Their larger oil capacity and robust construction allow for longer cooking cycles and reduced downtime, which is highly valued by restaurants, hotels, and institutional kitchens. The integration of advanced filtration systems and compatibility with multiple accessories further enhance their efficiency.
As demand for large scale frying solutions continues to expand, floor standing fryers remain the preferred installation type.
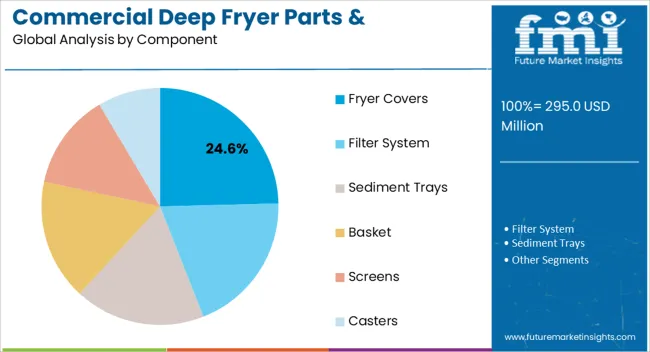
The fryer covers segment is anticipated to hold 24.60% of total market revenue by 2025 under the component category, positioning it as a significant contributor to the market. This share is supported by the role fryer covers play in maintaining oil quality, improving energy efficiency, and enhancing safety by preventing contamination and accidental spills.
Operators increasingly view fryer covers as an essential accessory to extend oil life and reduce operational costs. Their adoption is also driven by food safety standards that emphasize contamination control.
As commercial kitchens continue to focus on efficiency, safety, and quality, fryer covers are expected to maintain steady demand within the overall accessories category.
According to Future Market Insights (FMI), global demand for deep fryers parts & accessories is expected to grow at a CAGR of 12% between 2025 and 2035, reaching a value of USD 916.3 million in 2035, according to a report from Future Market Insights (FMI). From 2020 to 2025, sales witnessed significant growth, registering a CAGR of 12.1%.
Fast food vendors in the suburbs are increasingly opting for deep fryers. The modern deep fryer is equipped with food odor filters that prevent the smell of the food from spreading throughout the house.
The demand for floor fryers that are able to handle the constant supply of deep-fried food in high quantities is expected to continue.
It is not uncommon for some brands to be equipped with built-in filtration devices which will increase the oil's durability and improve the food's quality. Restaurants with high volumes and fast food chains benefit from these fryers.
A range of technologies is being employed by manufacturers to develop new deep fryer parts that are more durable, efficient, and cost-effective, including robotics, 3D printing, and advanced sensors. With the development of these technologies, it is expected in the coming years that deep fryers constructed for commercial use will be more energy efficient as well as more reliable.
Commercial Deep Fryer Parts and Accessories will grow as the Market for Deep Fryers Grows
The growing popularity of fast food, energy-efficient equipment, and rising disposable incomes will drive the demand for commercial deep fryer parts. Moreover, the rising interest in health and wellness is fueling the demand for low-fat fried foods, which fuels commercial deep fryer parts sales in the market.
Due to increased demand from the food and beverage industry as well as the consumption of fast food and the growing trend of at-home dining, manufacturers are expecting their commercial deep fryer parts demand to increase greatly in the coming years. A new generation of technologies, like smart fryers, is helping to drive growth in the commercial deep fryer parts market.
The growing need for eco-efficient and health-conscious commercial deep fryers and their parts will continue to grow their market share in the coming years. Numerous manufacturers have launched their own websites where they are retailing their products online in a continuous process. Additionally, they have established relationships with distributors globally to ensure maximum product penetration. As a result, they are able to increase the reach of their product and the number of consumers they serve.
Also, the growing internet penetration in developing and developed countries will lead to a positive impact on the market's growth, resulting in excellent opportunities for the market to thrive in the coming years. Furthermore, the demand is expected to be sparked by experts that regularly post videos on video showing their use of deep fryers and other devices.
A New Wave of Technologies Presents Lucrative Opportunities for Commercial Deep Fryer Parts
Increasing consumption of fast foods is propelling market growth because of the growing penetration of QSRs, restaurants, and food trucks. As part of the market growth, e-commerce channels are becoming increasingly popular among consumers. The developments of innovative fryers with advanced features are being placed with increasing emphasis, which will result in lucrative market opportunities in the future for manufacturers.
Parts and accessories for commercial deep fryers are being developed using advanced technologies such as 3D printing, robotics, and artificial intelligence. By leveraging these technologies, manufacturers can produce higher-quality and more efficient components at a lower cost. Besides AI-based automation systems, deep fryers, and their parts are also being monitored and controlled by AI-based systems that are based on artificial intelligence.
Growth is stifled by High Development Costs for Commercial Deep Fryers and Accessories
There are several players competing for market share in a highly competitive market. As a result, manufacturers may struggle to maintain profitability as a result of the price conflict in the market.
Costs of raw materials and manufacturing can be high, which can affect the pricing of the products in terms of their cost of manufacture. Keeping costs low and maintaining quality may be challenging for manufacturers.
There are several regulations on the market, including those pertaining to health and safety. Regulations can have an impact on the design and production of products, so manufacturers must make sure their products comply with them.
Investing in commercial deep fryers requires regular maintenance and repairs. Manufacturers must ensure their products are easy to maintain and repair in order to prevent customers from switching to competitors who offer products that are more accessible.
High Number of Restaurants Will Drive Growth for Commercial Deep Fryers Parts & Accessories
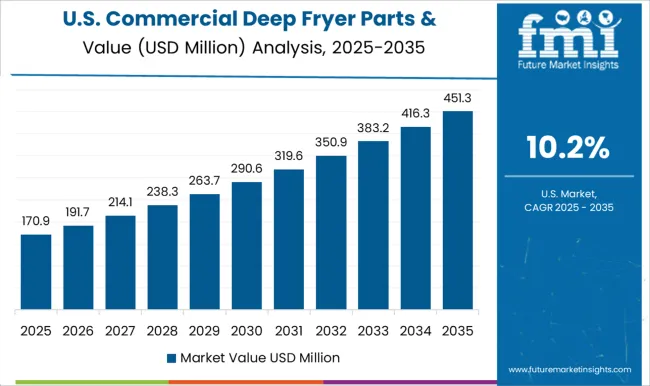
An expanding hospitality industry, rising food production, and the prevalence of relevant infrastructure are expected to fuel North America’s growth in the commercial deep fryer parts & accessories market. As per FMI, the region is expected to contribute 67% of revenue in 2025.
North America is experiencing robust demand for deep fryer parts for commercial deep fryers in the market. Since the North American market has become one of the largest markets for commercial deep fryers, there has been an increase in demand for parts and accessories.
Manufacturers of commercial deep fryers offer a range of parts and accessories to meet the needs of their customers, ranging from replacement filters, baskets, lids, and heating elements order to meet their needs in a timely manner.
A substantial part of these parts is designed to increase the efficiency and safety of commercial deep fryers, thus increasing the demand for these parts. In addition, the availability of a wide variety of aftermarket parts has contributed to a decrease in cost, which in turn has helped fuel demand.
Population Growth and Rising Disposable Incomes are driving the Asia Pacific Market Growth
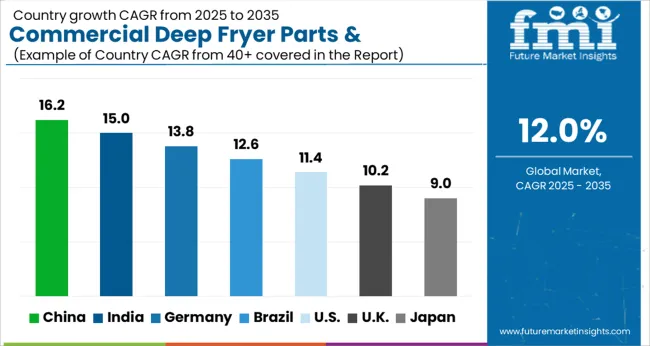
Fast food restaurants are projected to experience rapid growth in the Asia Pacific region over the forecast period. Growing food chains in developing countries like India, China, and Japan are driving the market further. The market for fryer parts is expected to grow since India and China are expected to experience a high demand for street food.
As the food service industry in the Asia Pacific region grows rapidly, demand for commercial deep fryer parts is expected to remain strong in the market. In addition to the increasing number of restaurants and food outlets within the region, there is also a growing demand for fried food, as well as a growing street food culture, which may explain the development of the market.
In addition, consumers in the region are becoming abler to afford deep fryers and related equipment as their disposable incomes increase. As the Asia Pacific region continues to develop, countries like Japan, South Korea, China, and India will play a key role in driving commercial deep fryer parts demand.
A Significant Increase in the Use of Electric Deep Fryers is Expected in the Future
Electric deep fryers accounted for the largest market share in 2025 largely as a result of their smart and technological developments in modular kitchens. With the growing demand for clean energy and awareness of the detrimental effects of gas appliances on health, electric deep fryers have become more popular.
As a widespread trend, the nation is currently seeing a movement towards electric appliances, which has a favorable impact on the environment and is incredibly healthy and environmentally friendly. Growing demand for digital kitchen and push button appliances in the market has grown demand for commercial deep
According to a study, gas stoves were found to cause 42% more asthma symptoms in kids than electric stoves in homes with gas stoves. Several states have also experienced gas bans in recent years, including New York, Washington, and California, which account for 30% of residential gas use in the country. Many brands are focusing on electrical cooking appliances and improving kitchen ventilation in order to reduce carbon monoxide and residue gasses.
Hence all these factors are generating demand for electric commercial deep fryer parts &accessories in the market.
With Growing Demand for Portable Deep Frying, Commercial Deep Fryers Parts & Accessories is Poised for Growth
The filter system segment is expected to account for 33% of the market by 2025, as sensors and technology become more widespread in the market. As global spending on food rises, portable deep fryer systems become more available, and food contamination concerns rise, the segment is expected to grow at a rapid pace.
A growing amount of contamination from frying operations at high temperatures is deteriorating the oil quickly. In order to separate these contaminants from oil, there has been an increase in the demand for oil filters on the market. During the last few years, the market for oil filtration systems has seen a steady increase due to the increasing demand for portable oil filtration systems and the growing need for customized adsorbents.
With increasing technological innovation and designs, sales for deep fryer filtration systems have grown. Filter systems are becoming increasingly popular as a means of preserving oil life and maintaining the consistent quality of fried food.
Quick Service Restaurants are expected to enhance Sales for Most of the Parts and Accessories for Commercial Deep Fryers
Commercial deep fryer parts and accessories are mostly used in quick service restaurants, accounting for 47% of the market in 2025. Quick-service restaurants (QSR) have an estimated CAGR of 5% during the review period and are projected to account for the largest portion of the market in 2025.
Fast food restaurants like Kentucky Fried Chicken (KFC) and McDonald's have resulted in increased demand for deep fryers. As a result, the market for dual fryers, baskets, and trays is expected to grow. Numerous factors contribute to the growth of the food service industry, including the presence of food trucks, caterers, and clubs, as well as the penetration of food chain industries.
Fast-food restaurants were found in over 196,000 USA cities in 2024. It is also likely that improving inventory management systems will help to reduce the costs associated with material handling and waste. Through better scheduling, companies can reduce labor costs and improve labor efficiency. All these factors will further enhance market growth for the commercial deep fryer parts & accessories market.
There are several start-up companies in the commercial deep fryer parts and accessories market, including
Through strategic partnerships, manufacturers can increase their revenues and market share by increasing production and meeting customer demands. End users will benefit from improved technology when new products and technologies are introduced. Having a partnership with another company can boost your company's production capacity.
| Report Attribute | Details |
|---|---|
| Market Value in 2025 | USD 295.0 million |
| Market Value in 2035 | USD 916.3 million |
| Growth Rate | CAGR of 12% from 2025 to 2035 |
| Base Year for Estimation | 2025 |
| Historical Data | 2020 to 2025 |
| Forecast Period | 2025 to 2035 |
| Quantitative Units | Revenue in USD Million and CAGR from 2025 to 2035 |
| Report Coverage | Revenue Forecast, Volume Forecast, Company Ranking, Competitive Landscape, Growth Factors, Trends, and Pricing Analysis |
| Segments Covered |
Fryer Types, Installation Type, Components, Distribution Channel, End User, Region |
| Regions Covered |
North America; Latin America; Europe; South Asia; East Asia; Oceania; Middle East & Africa |
| Key Countries Profiled |
United States, Canada, Brazil, Mexico, Germany, United Kingdom, France, Spain, Italy, India, Malaysia, Singapore, Thailand, China, Japan, South Korea, Australia, New Zealand, GCC Countries, South Africa, Israel |
| Key Companies Profiled |
Taurus Group; The Middleby Corporation; Henny Penny; Illinois Tool Works Inc.; WinCo Foods, Inc.; Avantco Equipment; AB Electrolux; Breville Group; National Presto Industries; Manitowoc |
| Customization | Available Upon Request |
The global commercial deep fryer parts & accessories market is estimated to be valued at USD 295.0 million in 2025.
The market size for the commercial deep fryer parts & accessories market is projected to reach USD 916.3 million by 2035.
The commercial deep fryer parts & accessories market is expected to grow at a 12.0% CAGR between 2025 and 2035.
The key product types in commercial deep fryer parts & accessories market are gas deep fryer and electric deep fryer.
In terms of installation type, floor-standing fryer segment to command 68.5% share in the commercial deep fryer parts & accessories market in 2025.


Our Research Products

The "Full Research Suite" delivers actionable market intel, deep dives on markets or technologies, so clients act faster, cut risk, and unlock growth.

The Leaderboard benchmarks and ranks top vendors, classifying them as Established Leaders, Leading Challengers, or Disruptors & Challengers.

Locates where complements amplify value and substitutes erode it, forecasting net impact by horizon

We deliver granular, decision-grade intel: market sizing, 5-year forecasts, pricing, adoption, usage, revenue, and operational KPIs—plus competitor tracking, regulation, and value chains—across 60 countries broadly.

Spot the shifts before they hit your P&L. We track inflection points, adoption curves, pricing moves, and ecosystem plays to show where demand is heading, why it is changing, and what to do next across high-growth markets and disruptive tech

Real-time reads of user behavior. We track shifting priorities, perceptions of today’s and next-gen services, and provider experience, then pace how fast tech moves from trial to adoption, blending buyer, consumer, and channel inputs with social signals (#WhySwitch, #UX).

Partner with our analyst team to build a custom report designed around your business priorities. From analysing market trends to assessing competitors or crafting bespoke datasets, we tailor insights to your needs.
Supplier Intelligence
Discovery & Profiling
Capacity & Footprint
Performance & Risk
Compliance & Governance
Commercial Readiness
Who Supplies Whom
Scorecards & Shortlists
Playbooks & Docs
Category Intelligence
Definition & Scope
Demand & Use Cases
Cost Drivers
Market Structure
Supply Chain Map
Trade & Policy
Operating Norms
Deliverables
Buyer Intelligence
Account Basics
Spend & Scope
Procurement Model
Vendor Requirements
Terms & Policies
Entry Strategy
Pain Points & Triggers
Outputs
Pricing Analysis
Benchmarks
Trends
Should-Cost
Indexation
Landed Cost
Commercial Terms
Deliverables
Brand Analysis
Positioning & Value Prop
Share & Presence
Customer Evidence
Go-to-Market
Digital & Reputation
Compliance & Trust
KPIs & Gaps
Outputs
Full Research Suite comprises of:
Market outlook & trends analysis
Interviews & case studies
Strategic recommendations
Vendor profiles & capabilities analysis
5-year forecasts
8 regions and 60+ country-level data splits
Market segment data splits
12 months of continuous data updates
DELIVERED AS:
PDF EXCEL ONLINE
Gas Commercial Deep Fryers Market Size and Share Forecast Outlook 2025 to 2035
Electric Commercial Deep Fryers Market Analysis – Trends, Growth & Forecast 2025 to 2035
Specialty Commercial Deep Fryers Market Size and Share Forecast Outlook 2025 to 2035
Deep Fryer Machine Market Size and Share Forecast Outlook 2025 to 2035
Air Fryer Accessories Market Size and Share Forecast Outlook 2025 to 2035
Commercial Air Fryer Oven Market Size and Share Forecast Outlook 2025 to 2035
Commercial Air Fryer Market Size and Share Forecast Outlook 2025 to 2035
Dishwashing Parts and Accessories Market - Efficient Cleaning Solutions 2025 to 2035
4X4 Vehicles Parts and Accessories Market Size and Share Forecast Outlook 2025 to 2035
Heated Shelving Parts and Accessories Market - Optimized Food Warmth 2025 to 2035
Commercial and Industrial Rotating Rack Oven Market Size and Share Forecast Outlook 2025 to 2035
Commercial Baking Rack Oven Market Size and Share Forecast Outlook 2025 to 2035
Commercial Blast Freezer Market Size and Share Forecast Outlook 2025 to 2035
Deep Brain Stimulator Market Size and Share Forecast Outlook 2025 to 2035
Commercial Water Heater Market Size and Share Forecast Outlook 2025 to 2035
Commercial High-Speed Oven Market Size and Share Forecast Outlook 2025 to 2035
Commercial Turboprop Aircrafts Market Size and Share Forecast Outlook 2025 to 2035
Commercial Vehicle Foundation Brakes Market Size and Share Forecast Outlook 2025 to 2035
Commercial Vehicle Brake Chambers Market Size and Share Forecast Outlook 2025 to 2035
Commercial Vehicles LED Bar Lights Market Size and Share Forecast Outlook 2025 to 2035

Thank you!
You will receive an email from our Business Development Manager. Please be sure to check your SPAM/JUNK folder too.
Chat With
MaRIA