The Commercial Catering Equipment Market is estimated to be valued at USD 13.4 billion in 2025 and is projected to reach USD 19.3 billion by 2035, registering a compound annual growth rate (CAGR) of 3.7% over the forecast period.
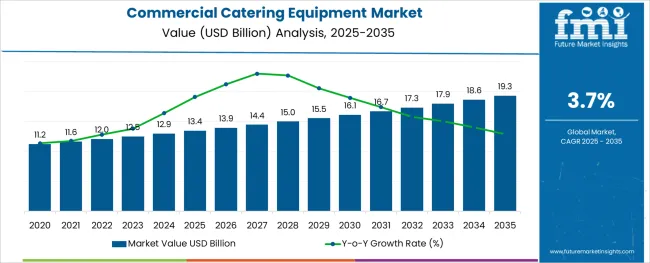
The commercial catering equipment market is evolving steadily as rising demand for operational efficiency, changing food consumption patterns, and stricter hygiene standards reshape the landscape of professional kitchens. Growth is being propelled by the expansion of the food service industry, increased investment in modernized kitchen infrastructure, and heightened focus on energy-efficient and sustainable equipment.
Technological innovations in cooking, refrigeration, and warewashing systems are enabling better productivity and compliance with food safety regulations. Future opportunities are expected to emerge from the integration of smart technologies, modular kitchen designs, and customization options tailored to diverse culinary needs.
The convergence of aesthetic appeal, durability, and environmental responsibility continues to influence purchasing decisions, paving the way for the adoption of advanced catering solutions across various sectors.
The market is segmented by Type, End User, Food Processor Sub-segment, and Sales Channel and region. By Type, the market is divided into Ovens, Steamers, Kettles, Ranges, Fryers, Cookers, Cook-chill systems, Grills / Broilers, Braising Pans, and Others. In terms of End User, the market is classified into Food Service Sector and Food Processors. Based on Food Processor Sub-segment, the market is segmented into Institutions, Schools & Universities, Hospitals, Office Spaces, and Others. By Sales Channel, the market is divided into Offline and Online. Regionally, the market is classified into North America, Latin America, Western Europe, Eastern Europe, Balkan & Baltic Countries, Russia & Belarus, Central Asia, East Asia, South Asia & Pacific, and the Middle East & Africa.
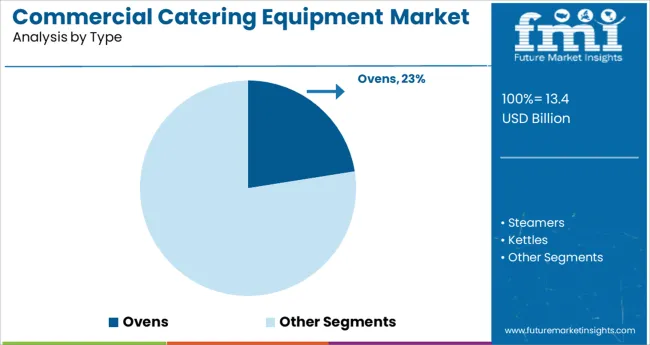
When segmented by type, ovens are projected to hold 22.5% of the total market revenue in 2025, emerging as the leading equipment category. This leadership has been reinforced by the essential role ovens play in both cooking and baking processes, offering versatility and consistency that meet the demands of high-volume operations.
Advancements in energy efficiency, programmable controls, and rapid-cook technologies have enhanced productivity while lowering operational costs, strengthening their appeal in professional kitchens. The ability to deliver uniform results across a range of culinary applications has positioned ovens as a cornerstone of modern catering environments.
Their durability and adaptability to evolving menu trends have further cemented their prominence within the equipment portfolio of commercial kitchens.
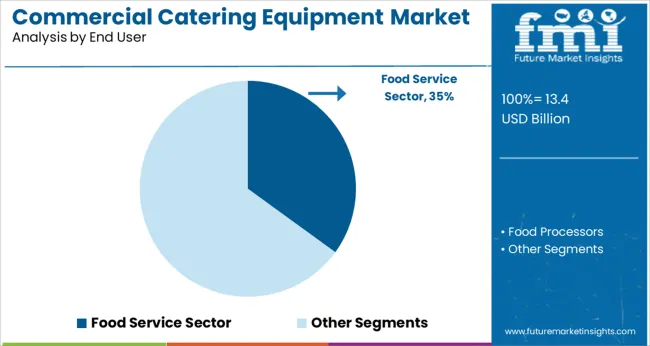
Segmented by end user, the food service sector is expected to account for 35.0% of the market revenue in 2025, maintaining its dominant position. This prominence has been driven by the sector’s expansive scale, encompassing restaurants, cafes, hotels, and quick-service outlets that rely heavily on high-performance catering equipment.
The sector’s rapid response to consumer trends, combined with the need to optimize throughput and maintain consistent quality, has accelerated investments in advanced kitchen solutions. Continuous pressure to improve customer experience and comply with stringent hygiene regulations has motivated the adoption of technologically enhanced, space-efficient, and durable equipment.
The food service sector’s dynamic nature and its influence over consumer dining habits have firmly anchored its leadership in driving market demand.
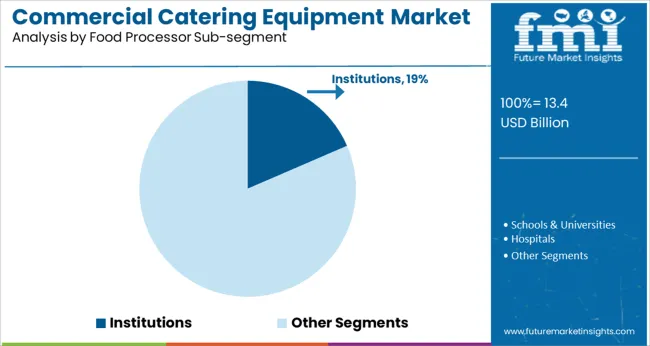
When segmented by food processor, institutions are forecast to capture 18.5% of the market revenue in 2025, positioning them as a key segment. This leadership has been reinforced by the substantial requirements of educational, healthcare, and correctional facilities, which depend on reliable, large-capacity equipment to serve sizable populations efficiently.
The emphasis on cost-effective operations, nutrition compliance, and consistent output has made robust and easy-to-maintain catering equipment indispensable in institutional kitchens. Growing awareness of energy conservation and food safety within public and private institutions has further increased the focus on upgrading existing infrastructure.
The predictable, high-volume nature of institutional catering has underscored the segment’s sustained contribution to the overall market.
The commercial catering equipment market is observing rapid development in terms of new innovations in the industry to meet the modern, more complex needs of the industry. Newer technologies such as molecular gastronomy and sous vide are profiting the catering businesses across the globe.
Sous vide is a cooking methodology in which air-tight bags are sealed and cooked at a precise temperature to achieve consistent results, irrespective of the complexity of the dish. Meanwhile, molecular gastronomy can be described as the experimentation of new ingredients and techniques to innovate unusual, exciting dishes.
The commercial catering equipment market is witnessing numerous developments lately. One of these latest developments is chargrilled ovens, which use direct radiant heat for cooking food, including meat and poultry, adding a smoky flavour to the food preparation. Chargrill ovens are generally used to prepare large quantities of food swiftly and evenly, leading to their popularity in catering businesses and restaurants.
Recently, due to a great many advantages of air fryers, the equipment is making rounds in the catering industry. These air fryers are different from traditional fryers as they use hot air, instead of oil, to cook food, making it a healthier substitute for fried foods. The usage of air fryers results in time-efficiency and cost-efficiency, upgradation of food quality, promotes food-and-health safety, and variety in food.
Some other new inventions in the market that promote the efficiency of time and energy include automatic gelato-making machines and food temperature preservers. The market is predicted to observe the development of many pieces of equipment related to commercial catering, thus enabling market growth in the ensuing years.
In May 2025, deSter, a leading provider of food packaging and service ware concepts for food service and aviation industries, in partnership with Etihad Airways, announced the launch of a new sustainable concept for dining equipment which is fully circular. The new onboard dining equipment includes reusable tableware with bowls, lids, trays, and hot meal casseroles made out of recycled high-quality materials, discarding the use of single-use plastics entirely.
The concept of a ghost or dark kitchen, also known as a virtual restaurant, is relatively new. These kitchens or restaurants offer a professional cooking and food preparation facility meant for meal delivery and/or collection. This food service business serves customers only by delivery and pick-up based on mobile and online ordering. Virtual restaurants became popular due to social distancing and work-from-home policies put in place during the COVID-19 pandemic, as the demand for prepared dishes and food home delivery increased at this time.
The demand for home delivery of food sustained even after the restaurants and cafes resumed full operations as government-mandated social distancing to ensure health and safety.
The demand for food delivery resulted in the proliferation of food delivery apps, such as DoorDash, Uber Eats, Grubhub, and Postmates, to deliver food to the doorstep. Uber Eats alone supported the launch of about 4,000 virtual restaurants globally. Due to this, the sales of commercial catering equipment were cushioned from the economic blow suffered during the pandemic. The convenience afforded by ghost kitchens or virtual restaurants to both consumers and proprietors is expected to continue over the forecast period, thus driving the demand for commercial catering equipment.
Key trends underpinning the future growth of the commercial catering equipment market include new-fashioned at-home delivery solutions. In addition to this, a heightened focus on unique and experimental dining experiences to motivate consumers to dine out is also facilitating the demand for commercial catering equipment and accessories.
Further, the growing use of multi-faceted, multi-functional catering equipment to prepare high-quality food efficiently and consistently with the least kitchen operative intervention is predicted to drive the overall market forward over the forecast period of 2025 to 2035.
The catering industry is the most competitive sector worldwide, which is why the industry witnesses many challenges, recently being Brexit, sustainability concerns, and dietary constraints. The industry is likely to be affected by the increased costs of rental, wages, equipment, and produce, which is putting a strain on catering businesses’ budgets.
Additionally, the opening up of numerous food outlets and the availability of more choices in the market has made it more difficult to catch customers’ intrigue and mind space. The demand for food that aligns with specialized diet requirements is gaining prominence due to allergies and environmental or ethical concerns. This has placed a lot of pressure on the catering businesses in terms of budget. The adaptability of catering companies to these new challenges will determine their success in the forecast period.
The serving equipment/component type commanded a large market share with a CAGR of 3.4% from 2020 to 2025. The segment is expected to grow at a CAGR of 3.7% in the projected period owing to expanding food service sector and growing demand for multi-functional, time and space-efficient, and labor-saving equipment. Moreover, the segment growth is predicted to be driven by the shifting social norms and technological advancements yielding high demand among the end-users. These technologically-advanced equipment are anticipated to strengthen the market growth in the long run.
The food service sector grew at a CAGR of 2.7% in the historical period of 2020 to 2025. The sector is expected to retain its dominance over the forecast period, witnessing a CAGR of 3.5% from 2025 to 2035. The market growth is catalyzed by rising per capita disposable income and increased investments in the food service sector. The evolving customer tastes and preferences are expected to result in the popularity of restaurant concepts.
For instance, convenience will most likely be a determinant in driving the food service sector sales. Other factors contributing to the food service sector's growth include a surging population of working women and rapid urbanization.
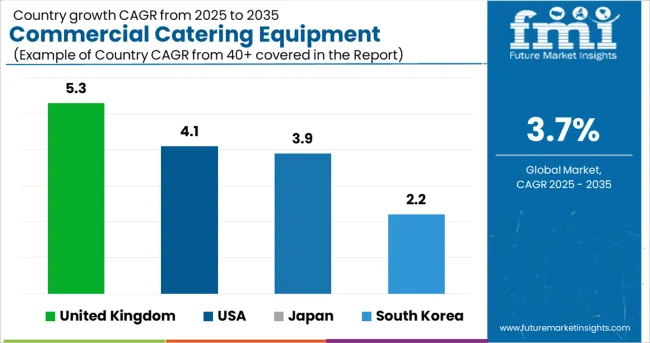
The USA commercial catering equipment market is assessed to lead the market with an estimated value of USD 4,493.1 Million by the year 2035, growing at a CAGR of 4.1% over the projected period of 2025 to 2035. The factors supporting the expected market growth over the stipulated period include expanding disposable incomes, the emergence of numerous casual restaurants, an extensive range of technologically-advanced, inventive products, and increased demand for dine-out and takeaways alike.
Furthermore, various regulatory bodies in the region are mandating the sale of tested and certified commercial kitchen appliances, intended to prioritize food safety and a healthy environment for both consumers and restaurant operators.
National Sanitation Foundation (NSF), which is an American inspection, product testing, and certification non-profit organization, has created equipment safety standards to ascertain that sanitation protocols and food safety requirements are being followed by end users.
The commercial catering equipment market in the UK sustained the COVID-19 adversity with government support in the form of schemes like 'Eat Out to Help Out. The overall market grew at a low CAGR of 2.9% in the historical period of 2020 to 2025. Looking onwards toward a positive future, the market is assessed to reach a valuation of USD 1,258.1 Million by 2035, expanding at the fastest CAGR of 5.3% over the forecast period.
The projected growth factors, such as surging ghost kitchens / virtual restaurants, explosive restaurant innovations, digitalization, the proliferation of smartphones, etc., are anticipated to drive the UK market upwards.
The growing popularity of takeaway and ready-to-eat (RTE) food items has propelled restaurant chains to equip themselves with multi-functional catering equipment for commercial purposes. The Japan commercial catering equipment market is expected to grow at a CAGR of 3.9% over the forecast period of 2025 to 2035 to attain a market value of USD 1,132.2 Million by 2035.
The market is expected to be stimulated by the advent of digital dining trends, which has yielded the deployment of modern equipment to expedite the preparation process and decrease delivery uptake. Furthermore, the expanding Japanese street food and sushi restaurants are supporting the demand for commercial catering equipment.
The South Korean commercial catering equipment market is expected to grow at a CAGR of 2.2% between the time period 2025 to 2035. By 2035, the market is predicted to amount to USD 449.3 Million. The market growth can be attributed to the adoption of dine-out culture for both formal and informal events and increased travel and tourism activities, resulting in rising footfall in full-service (FSR) restaurants.
Additionally, the expansion of quick-service restaurants (QSRs) in response to the increasing working population and globalization of leading restaurant chains. Further, continual product developments in the South Korean market are expected to enhance market growth.
Due to their comparable product portfolios and clientele, start-ups are now engaged in severe competition. Over the projected period, it is anticipated that new fast-food companies' expanding operations would have a favorable effect on commercial catering equipment demand.
Several start-ups have begun selling their goods online. To guarantee the widest possible product distribution, start-ups are partnering with distributors across the world. This assists them in growing both their customer base and the reach of their goods. Additionally, the industry is anticipated to benefit from rising internet penetration in both developed and emerging nations.
NOWAH Catering Equipment Ltd.
NOWAH Catering Equipment Ltd. is a new catering company specializing in the supply of restaurant and bakery dough mixers, pizza ovens, dough sheeters, and pasta makers, in addition to rotisseries and ancillary items, including stainless steel sinks and tables. The company provides selected products on the basis of reliability, quality, durability, and value-for-money, in addition to great aftersales support.
Tovala
Tovala, a supplier of connected smart ovens, was launched in 2020 in Chicago, United States. The features of this oven include steaming, broiling, toasting in a single pot, convection and microwave heating, scan-to-cook options, and mobile application incorporation. These smart ovens are also developed to prepare meals on a subscription basis. These smart meals are automatically recognized and cooked with the help of pre-set cooking cycles.
June
June is the first Internet brand to deliver smart top ovens. The product features sensors, which detect the weight and set the temperature automatically. Other features include video monitoring, intelligent alerts, and meal planning.
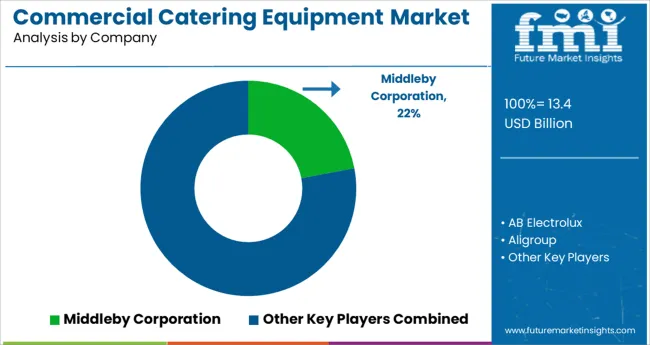
The presence of several well-known competitors, such as Duke Manufacturing Co. Inc., Electrolux, Dover Corporation, Illinois Tool Works (ITW), Inc., and Ali Group S.r.l, as well as numerous small and medium-sized competitors, dominates the market.
Furthermore, the commercial catering equipment industry is marked by intense competition since the top commercial catering equipment manufacturers have such a large client base. The players are well-established, have robust and wide-ranging distribution networks, and they can satisfy the demands of the food chain industry.
| Attribute | Details |
|---|---|
| Growth Rate | CAGR of 3.7% from 2025 to 2035 |
| Base Year of Estimation | 2025 |
| Historical Data | 2020 to 2025 |
| Forecast Period | 2025 to 2035 |
| Quantitative Units | Revenue in million and Volume in Units and F-CAGR from 2025 to 2035 |
| Report Coverage | Revenue Forecast, Volume Forecast, Company Ranking, Competitive Landscape, growth factors, Trends, and Pricing Analysis |
| Key Segments Covered | By Type, By End User, By Sales Channel, By Region |
| Regions Covered | North America; Latin America; Europe; East Asia; South Asia; Middle East & Africa; Oceania |
| Key Countries Profiled | The USA, Canada, Brazil, Mexico, Germany, Italy, France, The UK, Spain, Russia, China, Japan, India, GCC Countries, Australia |
| Key Companies Profiled | Duke Manufacturing Co. Inc.; Electrolux; Dover Corporation; Illinois Tool Works (ITW), Inc.; Ali Group S.r.l |
| Customization & Pricing | Available upon Request |
The global commercial catering equipment market is estimated to be valued at USD 13.4 billion in 2025.
It is projected to reach USD 19.3 billion by 2035.
The market is expected to grow at a 3.7% CAGR between 2025 and 2035.
The key product types are ovens, steamers, kettles, ranges, fryers, cookers, cook-chill systems, grills / broilers, braising pans and others.
food service sector segment is expected to dominate with a 35.0% industry share in 2025.


Full Research Suite comprises of:
Market outlook & trends analysis
Interviews & case studies
Strategic recommendations
Vendor profiles & capabilities analysis
5-year forecasts
8 regions and 60+ country-level data splits
Market segment data splits
12 months of continuous data updates
DELIVERED AS:
PDF EXCEL ONLINE
Commercial Baking Rack Oven Market Size and Share Forecast Outlook 2025 to 2035
Commercial Blast Freezer Market Size and Share Forecast Outlook 2025 to 2035
Commercial Water Heater Market Size and Share Forecast Outlook 2025 to 2035
Commercial High-Speed Oven Market Size and Share Forecast Outlook 2025 to 2035
Commercial Turboprop Aircrafts Market Size and Share Forecast Outlook 2025 to 2035
Commercial Vehicle Foundation Brakes Market Size and Share Forecast Outlook 2025 to 2035
Commercial Vehicle Brake Chambers Market Size and Share Forecast Outlook 2025 to 2035
Commercial Vehicles LED Bar Lights Market Size and Share Forecast Outlook 2025 to 2035
Commercial Vehicle AMT Transmission Market Size and Share Forecast Outlook 2025 to 2035
Commercial Greenhouse Market Size and Share Forecast Outlook 2025 to 2035
Commercial Vessel Market Size and Share Forecast Outlook 2025 to 2035
Commercial Slush Machine Market Size and Share Forecast Outlook 2025 to 2035
Commercial Medium Voltage Distribution Panel Market Size and Share Forecast Outlook 2025 to 2035
Commercial Earth Observation (CEO) Market Size and Share Forecast Outlook 2025 to 2035
Commercial Ozone Generator Market Size and Share Forecast Outlook 2025 to 2035
Commercial Gas-Fired Boiler Market Size and Share Forecast Outlook 2025 to 2035
Commercial Deep Fryer Parts & Accessories Market Size and Share Forecast Outlook 2025 to 2035
Commercial Gas Restaurant Ranges Market Size and Share Forecast Outlook 2025 to 2035
Commercial Heat Pump Market Size and Share Forecast Outlook 2025 to 2035
Commercial Countertop Ranges Market Size and Share Forecast Outlook 2025 to 2035

Thank you!
You will receive an email from our Business Development Manager. Please be sure to check your SPAM/JUNK folder too.
Chat With
MaRIA