Commercial Touch Display Market Size and Share Forecast Outlook 2025 to 2035

The commercial touch display market is estimated to be valued at USD 6.9 billion in 2025 and is projected to reach USD 16.3 billion by 2035, registering a compound annual growth rate (CAGR) of 9.0% over the forecast period. The market expansion reflects a multiplying factor of approximately 2.36x over the ten-year forecast period. Annual absolute additions increase steadily, rising from USD 0.6 billion between 2025 and 2026 to USD 1.4 billion between 2034 and 2035.

The compounding pattern indicates sustained upward momentum without any sign of contraction or stagnation. During the first five years, the market adds USD 3.7 billion, reaching USD 10.6 billion by 2030. In the second half, the market adds USD 5.7 billion, bringing the total to USD 16.3 billion by 2035.

Growth momentum intensifies over time, supported by the rapid deployment of digital signage in retail, education, and transportation. Improvements in capacitive sensing, resolution scaling, and integration with connected systems drive consistent replacement and upgrade cycles. The uninterrupted year-on-year gains confirm a structurally healthy market.

The CAGR of 9% is maintained uniformly across overlapping five-year periods, pointing to market resilience and broad-based commercial adoption. The consistent rise in both value and rate of change underlines a stable growth engine across all key application segments globally.
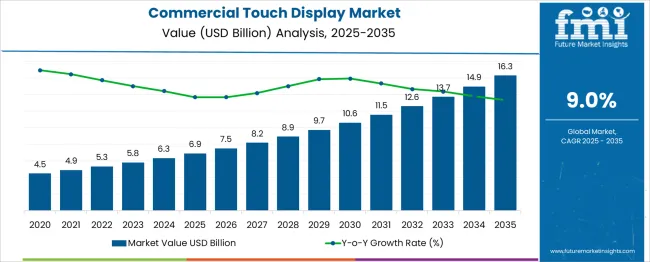
Quick Stats for Commercial Touch Display Market

  • Commercial Touch Display Market Value (2025): USD 6.9 billion
  • Commercial Touch Display Market Forecast Value (2035): USD 16.3 billion
  • Commercial Touch Display Market Forecast CAGR: 9.0%
  • Leading Segment in Commercial Touch Display Market in 2025: Capacitive touch (41.0%)
  • Key Growth Regions in Commercial Touch Display Market: North America, Asia-Pacific, Europe
  • Top Key Players in Commercial Touch Display Market: Elo Touch Solutions, ViewSonic, NEC Display Solutions, LG Display, Planar Systems, Samsung Electronics, BOE Technology Group, Others

Commercial Touch Display Market Market Value Analysis

Commercial Touch Display Market Key Takeaways

Metric Value
Commercial Touch Display Market Estimated Value in (2025 E) USD 6.9 billion
Commercial Touch Display Market Forecast Value in (2035 F) USD 16.3 billion
Forecast CAGR (2025 to 2035) 9.0%

The commercial touch display market is shaped by five key parent sectors, each driving demand in distinct ways. Commercial retail and point-of-sale systems contribute about 30%, where interactive kiosks and checkout screens are central. Enterprise collaboration and meeting-room system providers account for approximately 25%, using touch displays for scheduling, conferencing, and shared whiteboarding.

Public information and transportation hubs-such as airports, train stations, and museums-make up nearly 20%, deploying wayfinding and self-service terminals. Education and digital signage networks represent around 15%, where screens support learning tools and advertising displays. The remaining 10% comes from healthcare and industrial control environments, requiring high-reliability displays for patient check-in, diagnostics, or machinery interfaces.

Each segment influences display size, durability standards, touch technology type, and software integration. The commercial touch display market is growing rapidly as businesses adopt interactive kiosks digital signage and collaborative screens across retail healthcare education and corporate sectors. Major players include Samsung, LG Display, BOE, Sharp, NEC and Elo Touch Solutions.

Key trends include integration of AI and IoT capabilities for predictive analytics personalized content delivery and voice activation. Capacitive multi touch technology remains dominant while flexible and transparent displays open new design possibilities in retail environments.

Open frame displays support retrofit installation across applications. Asia Pacific leads expansion supported by smart city initiatives and retail digital transformation efforts. North America drives demand through healthcare and education deployments. Growth is challenged by supply chain constraints and high initial investment costs.

Why is the Commercial Touch Display Market Growing?

Enhanced user interactivity and increased demand for responsive, durable, and visually immersive display systems have been contributing significantly to market expansion. Businesses across retail, education, healthcare, and transportation sectors are investing in touch-enabled systems to optimize customer experience and streamline workflow efficiency.

The integration of advanced technologies such as 4K resolution, multi-touch functionality, and embedded operating systems has supported broader use cases beyond traditional signage. Furthermore, the increasing affordability of large-format interactive displays has made them more accessible to small and medium-sized enterprises.

As companies seek to modernize point-of-sale infrastructure and conference environments, demand for commercial touch displays is expected to remain strong. This momentum is anticipated to be sustained by ongoing innovation in display materials, touch sensitivity, and cloud-enabled features, all of which are reinforcing the strategic value of these systems in digital transformation initiatives across sectors..

Segmental Analysis

The commercial touch display market is segmented by touch technology, aspect ratio, screen size, resolution, end-use industry, and geographic regions. The commercial touch display market is divided into Capacitive touch, Infrared touch, Resistive touch, Optical imaging, and Surface acoustic wave.

In terms of aspect ratio, the commercial touch display market is classified into Wide and Square. Based on screen size, the commercial touch display market is segmented into 28 inches to 65 inches, 7 inches to 27 inches, and above 65 inches. The commercial touch display market is segmented into Full High Definition (FHD), High Definition (HD), and 4K resolution.

The end-use industry of the commercial touch display market is segmented into Retail, BFSI, Corporate, Education, Hospitality, Healthcare, Sports & entertainment, Transportation, and Others. Regionally, the commercial touch display industry is classified into North America, Latin America, Western Europe, Eastern Europe, Balkan & Baltic Countries, Russia & Belarus, Central Asia, East Asia, South Asia & Pacific, and the Middle East & Africa.
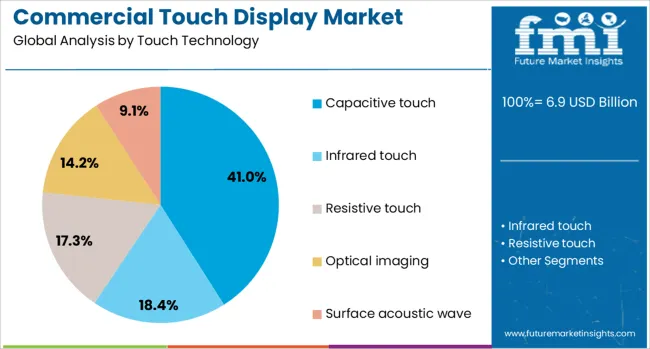
Insights into the Capacitive Touch Technology Segment

Commercial Touch Display Market Analysis By Touch Technology

The capacitive touch subsegment within the touch technology segment is projected to account for 41% of the market revenue share in 2025. This dominance has been attributed to the high sensitivity, durability, and multi-touch capabilities offered by capacitive technology. Capacitive touch displays have been widely adopted in commercial settings due to their ability to deliver accurate and fluid touch responses, even with complex user interactions.

Their glass-based surface ensures high optical clarity and resistance to contaminants, which has proven advantageous in environments requiring both aesthetic appeal and rugged performance. Additionally, the technology allows for seamless integration with modern interface designs, offering flexibility in display formats and mounting configurations.

As businesses prioritize long-term functionality, reduced maintenance, and superior visual performance, capacitive touch screens have continued to lead due to their balance of form and function. This combination of reliability and user-friendly design has played a pivotal role in establishing capacitive technology as the preferred choice across multiple commercial applications..
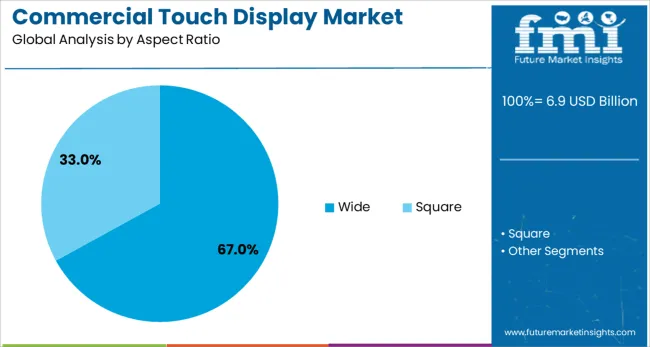
Insights into the Wide Aspect Ratio Segment

Commercial Touch Display Market Analysis By Aspect Ratio

The wide subsegment under the aspect ratio segment is expected to hold 67% of the Commercial Touch Display market revenue share in 2025, making it the leading format in commercial installations. This segment’s prominence has been supported by the growing demand for widescreen displays that enhance content visibility and improve user engagement.

Wide aspect ratio formats have been favored in customer-facing applications such as retail kiosks, interactive signage, and collaborative workspaces, where expansive screen real estate is essential. The format’s compatibility with high-definition and ultra-high-definition content ensures a visually immersive experience, which has become a critical requirement for businesses aiming to capture attention and communicate effectively.

Moreover, widescreen layouts offer better screen segmentation, enabling multiple simultaneous applications or data streams, which is particularly valuable in operational control rooms and educational settings. As interactive environments become more complex and content-rich, the preference for wide aspect ratio displays has continued to rise, solidifying its leadership in the commercial landscape..
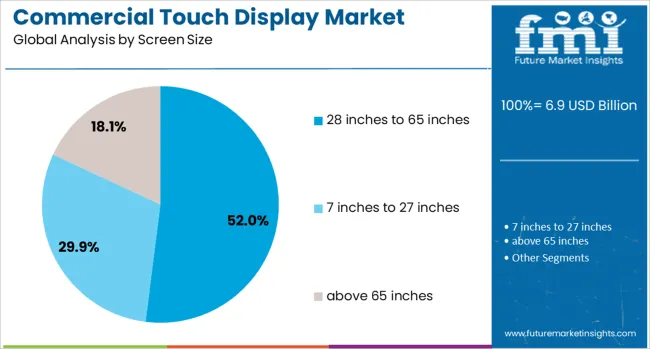
Insights into the 28-Inch to 65-Inch Screen Size Segment

Commercial Touch Display Market Analysis By Screen Size

The 28 inches to 65 inches subsegment in the screen size segment is projected to contribute 52% of the Commercial Touch Display market revenue share in 2025. This screen size range has been favored for its optimal balance between visibility, space efficiency, and user interaction. Displays within this size category have become the standard in environments such as retail counters, classrooms, corporate boardrooms, and hospitality check-in systems.

The segment’s growth has been supported by increased adoption of medium to large-format displays that offer enhanced viewing angles, touch accuracy, and interactive engagement. These displays are large enough to support group-based interactions while remaining compact enough to fit into diverse spatial configurations.

Availability of 4K resolution, advanced touch sensors, and integrated software solutions within this size range has made it a compelling option for businesses seeking impactful visual communication. As commercial entities prioritize dynamic, scalable, and cost-effective display solutions, the 28-inch to 65-inch category has continued to maintain its leading position in the market..

What are the Drivers, Restraints, and Key Trends of the Commercial Touch Display Market?

In 2024, over 44% of newly installed interactive displays were supplied to retail and self-service kiosks. Demand from the education sector and signage applications contributed another 29% of installed volume. Growth was strongest in North America and the Asia Pacific, while Europe pursued digital transformation in corporate offices and healthcare institutions. Increasing preferences for height-adjustable touchscreen kiosks and hybrid collaboration panels have influenced installation decisions. Touch displays with anti-glare coatings, gesture-free operation, and sanitizable screens have become preferred in hygiene-sensitive environments like hospitals and public transit facilities.

Demand for Interactive Customer Engagement and Digital Self-Service

Interactive touch displays were deployed to improve customer service efficiency, information access, and visual engagement. Nearly 52 % of retail outlets and service centers now include touch-enabled self-service terminals. Quick-service restaurants and ticketing booths accounted for approximately 38 % of kiosk touch screen installs. Healthcare facilities adopted sanitizable touch panels in over 26 % of patient check-in and wayfinding stations. Conference rooms and corporate huddle spaces have embraced large-format touch-enabled displays, capturing 21 % of new display contracts. Touch display deployment enhanced the speed of service, reduced staffing needs, and improved informational accessibility. Surface finishes resistant to fingerprints and microbial residues have been adopted in 31 % of hygiene-critical environments.

Hardware Cost and Infrastructure Integration Constraints

Commercial-grade touch displays continue to face price constraints in budget-sensitive segments, with premium units priced about 24% higher than consumer-grade models. Installation complexity, such as flush mounting, electrical integration, and software configuration, added nearly 18% to setup costs in public venue projects. Variability in compatibility with legacy AV systems and control protocols required customization in 21% of corporate deployments. Durability concerns, including screen scratch resistance and sensor drift, were reported in about 9% of high-volume usage scenarios. Power and data cabling infrastructure upgrades were needed in 7% of older buildings. The complexity of integrating touch displays with interactive software or analytics also delayed implementation in some pilot installations.

Hybrid Kiosk Systems and SaaS Integration

SaaS-backed touch display platforms have unlocked new use cases in retail, digital signage, and remote conferencing. Subscription-based content management systems and remote kiosk monitoring accounted for 29% of new install deals in multi-site deployments. Hybrid setups combining touch screens with proximity sensors or QR-code interfaces were deployed in over 23% of retail pilot projects. Portable all-in-one display carts were adopted in nearly 18% of education and pop-up retail applications. Custom content orchestration platforms enabled schedule-based interaction, loyalty integration, and dynamic visual merchandising. Touch display packages bundled with hardware leasing and software updates helped lower upfront cost barriers for small enterprises and venue operators.

Sanitizable Surfaces, Proximity Touch and Thin-Film Design

Touch display lines with anti-microbial screen bonding and glass surfaces were introduced in 27 % of devices targeting the healthcare and foodservice sectors. Proximity-sensing touch controls, allowing gestural operation within 2 cm, were included in about 17 % of new displays to reduce contact. Ultra-thin bezel designs and OLED hybrid touch panels increased in popularity, capturing 25 % of designs used in boutique hotel and showroom settings. Energy-efficient LED backlight and auto-dimming features helped reduce display power draw by up to 14 %. Integration with IoT sensors enabled adaptive screen brightness and usage analytics in facility management dashboards, strengthening system intelligence in interactive environments.
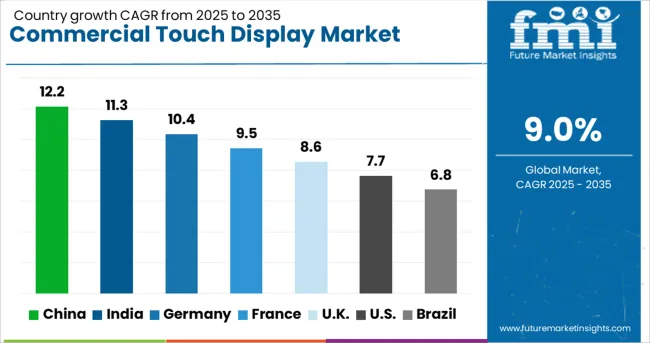
Analysis of Commercial Touch Display Market By Key Countries

Commercial Touch Display Market Cagr Analysis By Country

Country CAGR
China 12.2%
India 11.3%
Germany 10.4%
France 9.5%
UK 8.6%
USA 7.7%
Brazil 6.8%

China, India, and Germany are accelerating the commercial touch display market, posting growth rates of 12.2%, 11.3%, and 10.4% respectively from 2025 to 2035. These figures surpass the global CAGR of 9%, with China expanding 1.36 times faster due to high touchscreen adoption across education, retail, and transport systems.

India’s 11.3% CAGR, or 1.25x the global average, reflects widespread demand across government and hospitality sectors. Germany’s 10.4% CAGR represents a 1.15x multiple, influenced by automation across manufacturing and medical interfaces. The UK at 8.6% and USA at 7.7% trail slightly below the global rate. The report covers detailed analysis of 40+ countries, with the top five countries shared as a reference.

Growth Outlook for Commercial Touch Display Market in China

The demand for commercial touch displays in China has been driven by widespread digital transformation across retail, hospitality, and transport infrastructure. Chinese display integrators have prioritized localized software and hardware ecosystems to meet sector-specific needs. Interactive flat panels have been deployed extensively in public service venues, while all-in-one kiosks have found growing relevance in Tier II and Tier III cities.

Local manufacturers have improved production efficiency by leveraging domestic glass substrate and IC packaging capabilities. Procurement by banking and insurance institutions has been influenced by requirements for multilingual UI and AI-enhanced personalization features. The Chinese market has been uniquely characterized by integrated POS systems with dual-touch interfaces, used in hybrid retail formats such as unmanned stores and self-checkout lanes.

Growth Outlook for Commercial Touch Display Market in India

India has seen accelerated interest in commercial touch displays due to rising demand from Tier I and Tier II smart city programs. Edtech platforms and public schools have adopted large-format touch panels, while hospitality chains and QSR outlets have opted for compact touchscreen ordering systems. Custom UI solutions have been developed in regional languages to support localization in educational and civic use.

Interactive information panels have been deployed in airports, metros, and administrative zones as part of e-governance digitization. LED-backlit capacitive screens have been preferred for outdoor usability in high-temperature regions. Supply chains have been influenced by imports of key panel components, though initiatives under PLI schemes have aimed to shift final assembly to domestic vendors.
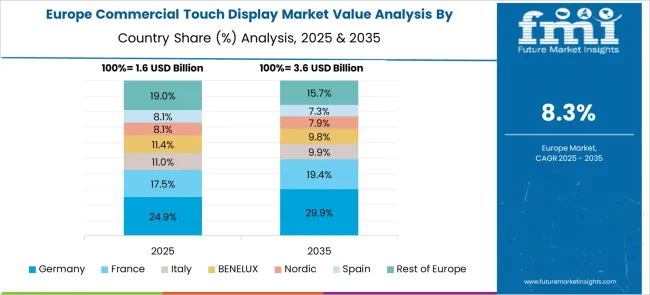
Growth Outlook for Commercial Touch Display Market in Germany

Commercial Touch Display Market Europe Country Market Share Analysis, 2025 & 2035

Germany’s commercial touch display market has been influenced by demand across automotive retail, logistics centers, and industrial automation showrooms. Integrations with SAP enterprise platforms and compatibility with German-language firmware have been critical factors in B2B deployments.

Durable glass and metal frame housings have been preferred for factory floor use, where capacitive and resistive technologies are deployed based on exposure to heat or dust. Public terminals at railway stations and municipal buildings have prioritized low-latency response and multilingual interface capability.

German system integrators have focused on energy-efficient backlighting and modular display repairability to comply with local recycling directives. Compact touch controllers have been adopted by mid-sized retailers operating unmanned outlets and automated vending kiosks.

Growth Outlook for Commercial Touch Display Market in United Kingdom

The United Kingdom has shown active engagement with interactive touch display solutions in both urban and regional sectors, especially in healthcare, museums, and retail. Procurement has focused on antimicrobial screen coatings for NHS usage and ultra-HD touch panels for heritage installations. Local councils have installed touchscreen public maps and bus timetables with weatherproofing features.

Retailers have adopted dual-display POS systems that allow personalized product recommendations via AI. Smart campus deployments in universities have integrated interactive whiteboards with lecture capture solutions. Installers have preferred touch displays with low-power operation profiles to meet corporate sustainability policies, particularly in London and Manchester commercial estates. Brexit-related import constraints have shaped sourcing strategies.
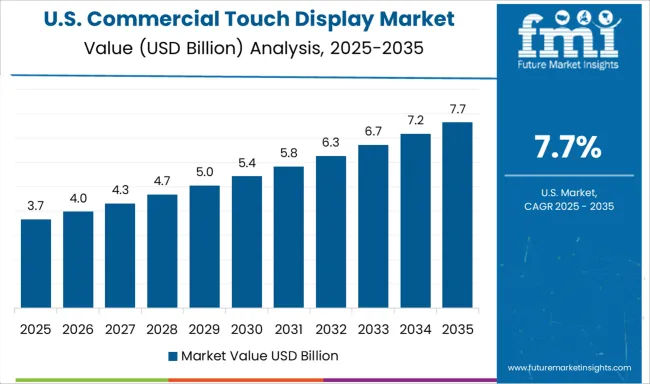
Growth Outlook for Commercial Touch Display Market in United States

Commercial Touch Display Market Country Value Analysis

In the United States, commercial touch display adoption has been influenced by the retail sector’s shift toward contactless consumer interfaces. Touch-enabled vending machines and interactive directory screens have been deployed across shopping malls and stadiums. Public sector projects have driven demand for ADA-compliant touchscreen kiosks with text-to-speech and visual assist features.

Restaurants and hospitality chains have deployed tabletop interactive menus with QR-enabled payment features. Regional healthcare systems have adopted touchscreen sign-in and patient information panels with HIPAA-compliant data masking. Modular touchscreen components from US-based suppliers have been preferred to avoid overseas freight dependencies. Integration with cloud analytics platforms has added value in performance monitoring and UX optimization.
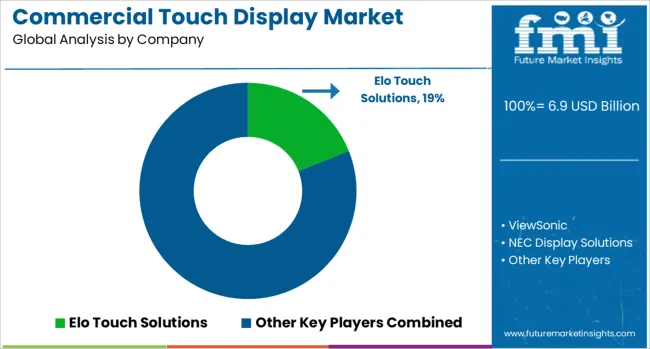
Competitive Landscape of Commercial Touch Display Market

Commercial Touch Display Market Analysis By Company

The commercial touch display market includes brands supplying interactive panels for retail, healthcare, hospitality, transportation, and education sectors. Elo Touch Solutions leads in modular open-frame and all-in-one touch displays, commonly used in kiosks, self-service stations, and POS terminals. ViewSonic addresses education and enterprise segments with 4K touch-enabled interactive flat panels that support collaboration software and multi-user inputs.

NEC Display Solutions focuses on professional-grade digital signage and public information displays, emphasizing durability, extended run-time capabilities, and responsive multi-touch functionality in high-traffic environments. LG Display and Samsung Electronics maintain a strong global presence through high-resolution capacitive displays integrated into commercial signage and control rooms, offering ultra-wide formats and protective coatings.

Planar Systems provides specialty touchscreen displays for medical imaging and broadcast applications, with a focus on precision and reliability. BOE Technology Group supplies interactive whiteboards and advanced TFT-LCD modules at scale, supporting customization for OEM and system integrator clients.

Market competition is defined by panel responsiveness, operating life, integration flexibility, and anti-glare technology, with demand influenced by rising adoption of interactive retail and smart classrooms requiring real-time content manipulation and multi-user engagement.

Key Developments in Commercial Touch Display Market

Elo Touch premiered rugged open-frame touchscreens suited to outdoor and industrial deployments. Samsung launched Android-based interactive displays optimized for education and corporate settings.

Planar Systems (Leyard) continued scaling video wall and kiosk solutions for retail and digital signage. LG and NEC focused on high-resolution capacitive panels for hospitality and healthcare. ViewSonic expanded ViewBoards in the education sectors across North America and Europe.

Integration with IoT and AI systems, such as predictive analytics and adaptive content adjustment, enhanced use in smart cities, retail analytics, and corporate environments. Asia Pacific led installations, supported by retail growth and smart infrastructure adoption.

Scope of the Report

Item Value
Quantitative Units USD 6.9 Billion
Touch Technology Capacitive touch, Infrared touch, Resistive touch, Optical imaging, and Surface acoustic wave
Aspect Ratio Wide and Square
Screen Size 28 inches to 65 inches, 7 inches to 27 inches, and above 65 inches
Resolution Full High Definition (FHD), High Definition (HD), and 4K resolution
End-use Industry Retail, BFSI, Corporate, Education, Hospitality, Healthcare, Sports & entertainment, Transportation, and Others
Regions Covered North America, Europe, Asia-Pacific, Latin America, Middle East & Africa
Country Covered United States, Canada, Germany, France, United Kingdom, China, Japan, India, Brazil, South Africa
Key Companies Profiled Elo Touch Solutions, ViewSonic, NEC Display Solutions, LG Display, Planar Systems, Samsung Electronics, BOE Technology Group, and Others
Additional Attributes Dollar sales by display type (touchscreens: capacitive, infrared, resistive) and application (retail kiosks, hospitality, interactive signage), demand driven by digital transformation, self-service interfaces, led by Asia‑Pacific with North America catching up, innovation in multitouch gesture, antimicrobial coatings, and IoT‑integrated smart displays.

Commercial Touch Display Market by Segments

Touch Technology:

  • Capacitive touch
  • Infrared touch
  • Resistive touch
  • Optical imaging
  • Surface acoustic wave

Aspect Ratio:

  • Wide
  • Square

Screen Size:

  • 28 inches to 65 inches
  • 7 inches to 27 inches
  • above 65 inches

Resolution:

  • Full High Definition (FHD)
  • High Definition (HD)
  • 4K resolution

End-use Industry:

  • Retail
  • BFSI
  • Corporate
  • Education
  • Hospitality
  • Healthcare
  • Sports & entertainment
  • Transportation
  • Others

Region:

  • North America
    • USA
    • Canada
    • Mexico
  • Latin America
    • Brazil
    • Chile
    • Rest of Latin America
  • Western Europe
    • Germany
    • UK
    • Italy
    • Spain
    • France
    • Nordic
    • BENELUX
    • Rest of Western Europe
  • Eastern Europe
    • Russia
    • Poland
    • Hungary
    • Balkan & Baltic
    • Rest of Eastern Europe
  • East Asia
    • China
    • Japan
    • South Korea
  • South Asia and Pacific
    • India
    • ASEAN
    • Australia & New Zealand
    • Rest of South Asia and Pacific
  • Middle East & Africa
    • Kingdom of Saudi Arabia
    • Other GCC Countries
    • Turkiye
    • South Africa
    • Other African Union
    • Rest of Middle East & Africa

Table of Content

  1. Executive Summary
    • Global Market Outlook
    • Demand-side Trends
    • Supply-side Trends
    • Technology Roadmap Analysis
    • Analysis and Recommendations
  2. Market Overview
    • Market Coverage / Taxonomy
    • Market Definition / Scope / Limitations
  3. Market Background
    • Market Dynamics
      • Drivers
      • Restraints
      • Opportunity
      • Trends
    • Scenario Forecast
      • Demand in Optimistic Scenario
      • Demand in Likely Scenario
      • Demand in Conservative Scenario
    • Opportunity Map Analysis
    • Product Life Cycle Analysis
    • Supply Chain Analysis
    • Investment Feasibility Matrix
    • Value Chain Analysis
    • PESTLE and Porter’s Analysis
    • Regulatory Landscape
    • Regional Parent Market Outlook
    • Production and Consumption Statistics
    • Import and Export Statistics
  4. Global Commercial Touch Display Market Analysis 2020-2024 and Forecast, 2025-2035
    • Historical Market Size Value (USD Million) Analysis, 2020-2024
    • Current and Future Market Size Value (USD Million) Projections, 2025-2035
      • Y-o-Y Growth Trend Analysis
      • Absolute $ Opportunity Analysis
  5. Global Commercial Touch Display Market Pricing Analysis 2020-2024 and Forecast 2025-2035
  6. Global Commercial Touch Display Market Analysis 2020-2024 and Forecast 2025-2035, By Touch Technology
    • Introduction / Key Findings
    • Historical Market Size Value (USD Million) Analysis By Touch Technology , 2020-2024
    • Current and Future Market Size Value (USD Million) Analysis and Forecast By Touch Technology , 2025-2035
      • Capacitive touch
      • Infrared touch
      • Resistive touch
      • Optical imaging
      • Surface acoustic wave
    • Y-o-Y Growth Trend Analysis By Touch Technology , 2020-2024
    • Absolute $ Opportunity Analysis By Touch Technology , 2025-2035
  7. Global Commercial Touch Display Market Analysis 2020-2024 and Forecast 2025-2035, By Aspect Ratio
    • Introduction / Key Findings
    • Historical Market Size Value (USD Million) Analysis By Aspect Ratio, 2020-2024
    • Current and Future Market Size Value (USD Million) Analysis and Forecast By Aspect Ratio, 2025-2035
      • Wide
      • Square
    • Y-o-Y Growth Trend Analysis By Aspect Ratio, 2020-2024
    • Absolute $ Opportunity Analysis By Aspect Ratio, 2025-2035
  8. Global Commercial Touch Display Market Analysis 2020-2024 and Forecast 2025-2035, By Screen Size
    • Introduction / Key Findings
    • Historical Market Size Value (USD Million) Analysis By Screen Size, 2020-2024
    • Current and Future Market Size Value (USD Million) Analysis and Forecast By Screen Size, 2025-2035
      • 28 inches to 65 inches
      • 7 inches to 27 inches
      • above 65 inches
    • Y-o-Y Growth Trend Analysis By Screen Size, 2020-2024
    • Absolute $ Opportunity Analysis By Screen Size, 2025-2035
  9. Global Commercial Touch Display Market Analysis 2020-2024 and Forecast 2025-2035, By Resolution
    • Introduction / Key Findings
    • Historical Market Size Value (USD Million) Analysis By Resolution, 2020-2024
    • Current and Future Market Size Value (USD Million) Analysis and Forecast By Resolution, 2025-2035
      • Full High Definition (FHD)
      • High Definition (HD)
      • 4K resolution
    • Y-o-Y Growth Trend Analysis By Resolution, 2020-2024
    • Absolute $ Opportunity Analysis By Resolution, 2025-2035
  10. Global Commercial Touch Display Market Analysis 2020-2024 and Forecast 2025-2035, By End-use Industry
    • Introduction / Key Findings
    • Historical Market Size Value (USD Million) Analysis By End-use Industry, 2020-2024
    • Current and Future Market Size Value (USD Million) Analysis and Forecast By End-use Industry, 2025-2035
      • Retail
      • BFSI
      • Corporate
      • Education
      • Hospitality
      • Healthcare
      • Sports & entertainment
      • Transportation
      • Others
    • Y-o-Y Growth Trend Analysis By End-use Industry, 2020-2024
    • Absolute $ Opportunity Analysis By End-use Industry, 2025-2035
  11. Global Commercial Touch Display Market Analysis 2020-2024 and Forecast 2025-2035, By Region
    • Introduction
    • Historical Market Size Value (USD Million) Analysis By Region, 2020-2024
    • Current Market Size Value (USD Million) Analysis and Forecast By Region, 2025-2035
      • North America
      • Latin America
      • Western Europe
      • Eastern Europe
      • East Asia
      • South Asia and Pacific
      • Middle East & Africa
    • Market Attractiveness Analysis By Region
  12. North America Commercial Touch Display Market Analysis 2020-2024 and Forecast 2025-2035, By Country
    • Historical Market Size Value (USD Million) Trend Analysis By Market Taxonomy, 2020-2024
    • Market Size Value (USD Million) Forecast By Market Taxonomy, 2025-2035
      • By Country
        • USA
        • Canada
        • Mexico
      • By Touch Technology
      • By Aspect Ratio
      • By Screen Size
      • By Resolution
      • By End-use Industry
    • Market Attractiveness Analysis
      • By Country
      • By Touch Technology
      • By Aspect Ratio
      • By Screen Size
      • By Resolution
      • By End-use Industry
    • Key Takeaways
  13. Latin America Commercial Touch Display Market Analysis 2020-2024 and Forecast 2025-2035, By Country
    • Historical Market Size Value (USD Million) Trend Analysis By Market Taxonomy, 2020-2024
    • Market Size Value (USD Million) Forecast By Market Taxonomy, 2025-2035
      • By Country
        • Brazil
        • Chile
        • Rest of Latin America
      • By Touch Technology
      • By Aspect Ratio
      • By Screen Size
      • By Resolution
      • By End-use Industry
    • Market Attractiveness Analysis
      • By Country
      • By Touch Technology
      • By Aspect Ratio
      • By Screen Size
      • By Resolution
      • By End-use Industry
    • Key Takeaways
  14. Western Europe Commercial Touch Display Market Analysis 2020-2024 and Forecast 2025-2035, By Country
    • Historical Market Size Value (USD Million) Trend Analysis By Market Taxonomy, 2020-2024
    • Market Size Value (USD Million) Forecast By Market Taxonomy, 2025-2035
      • By Country
        • Germany
        • UK
        • Italy
        • Spain
        • France
        • Nordic
        • BENELUX
        • Rest of Western Europe
      • By Touch Technology
      • By Aspect Ratio
      • By Screen Size
      • By Resolution
      • By End-use Industry
    • Market Attractiveness Analysis
      • By Country
      • By Touch Technology
      • By Aspect Ratio
      • By Screen Size
      • By Resolution
      • By End-use Industry
    • Key Takeaways
  15. Eastern Europe Commercial Touch Display Market Analysis 2020-2024 and Forecast 2025-2035, By Country
    • Historical Market Size Value (USD Million) Trend Analysis By Market Taxonomy, 2020-2024
    • Market Size Value (USD Million) Forecast By Market Taxonomy, 2025-2035
      • By Country
        • Russia
        • Poland
        • Hungary
        • Balkan & Baltic
        • Rest of Eastern Europe
      • By Touch Technology
      • By Aspect Ratio
      • By Screen Size
      • By Resolution
      • By End-use Industry
    • Market Attractiveness Analysis
      • By Country
      • By Touch Technology
      • By Aspect Ratio
      • By Screen Size
      • By Resolution
      • By End-use Industry
    • Key Takeaways
  16. East Asia Commercial Touch Display Market Analysis 2020-2024 and Forecast 2025-2035, By Country
    • Historical Market Size Value (USD Million) Trend Analysis By Market Taxonomy, 2020-2024
    • Market Size Value (USD Million) Forecast By Market Taxonomy, 2025-2035
      • By Country
        • China
        • Japan
        • South Korea
      • By Touch Technology
      • By Aspect Ratio
      • By Screen Size
      • By Resolution
      • By End-use Industry
    • Market Attractiveness Analysis
      • By Country
      • By Touch Technology
      • By Aspect Ratio
      • By Screen Size
      • By Resolution
      • By End-use Industry
    • Key Takeaways
  17. South Asia and Pacific Commercial Touch Display Market Analysis 2020-2024 and Forecast 2025-2035, By Country
    • Historical Market Size Value (USD Million) Trend Analysis By Market Taxonomy, 2020-2024
    • Market Size Value (USD Million) Forecast By Market Taxonomy, 2025-2035
      • By Country
        • India
        • ASEAN
        • Australia & New Zealand
        • Rest of South Asia and Pacific
      • By Touch Technology
      • By Aspect Ratio
      • By Screen Size
      • By Resolution
      • By End-use Industry
    • Market Attractiveness Analysis
      • By Country
      • By Touch Technology
      • By Aspect Ratio
      • By Screen Size
      • By Resolution
      • By End-use Industry
    • Key Takeaways
  18. Middle East & Africa Commercial Touch Display Market Analysis 2020-2024 and Forecast 2025-2035, By Country
    • Historical Market Size Value (USD Million) Trend Analysis By Market Taxonomy, 2020-2024
    • Market Size Value (USD Million) Forecast By Market Taxonomy, 2025-2035
      • By Country
        • Kingdom of Saudi Arabia
        • Other GCC Countries
        • Turkiye
        • South Africa
        • Other African Union
        • Rest of Middle East & Africa
      • By Touch Technology
      • By Aspect Ratio
      • By Screen Size
      • By Resolution
      • By End-use Industry
    • Market Attractiveness Analysis
      • By Country
      • By Touch Technology
      • By Aspect Ratio
      • By Screen Size
      • By Resolution
      • By End-use Industry
    • Key Takeaways
  19. Key Countries Commercial Touch Display Market Analysis
    • USA
      • Pricing Analysis
      • Market Share Analysis, 2024
        • By Touch Technology
        • By Aspect Ratio
        • By Screen Size
        • By Resolution
        • By End-use Industry
    • Canada
      • Pricing Analysis
      • Market Share Analysis, 2024
        • By Touch Technology
        • By Aspect Ratio
        • By Screen Size
        • By Resolution
        • By End-use Industry
    • Mexico
      • Pricing Analysis
      • Market Share Analysis, 2024
        • By Touch Technology
        • By Aspect Ratio
        • By Screen Size
        • By Resolution
        • By End-use Industry
    • Brazil
      • Pricing Analysis
      • Market Share Analysis, 2024
        • By Touch Technology
        • By Aspect Ratio
        • By Screen Size
        • By Resolution
        • By End-use Industry
    • Chile
      • Pricing Analysis
      • Market Share Analysis, 2024
        • By Touch Technology
        • By Aspect Ratio
        • By Screen Size
        • By Resolution
        • By End-use Industry
    • Germany
      • Pricing Analysis
      • Market Share Analysis, 2024
        • By Touch Technology
        • By Aspect Ratio
        • By Screen Size
        • By Resolution
        • By End-use Industry
    • UK
      • Pricing Analysis
      • Market Share Analysis, 2024
        • By Touch Technology
        • By Aspect Ratio
        • By Screen Size
        • By Resolution
        • By End-use Industry
    • Italy
      • Pricing Analysis
      • Market Share Analysis, 2024
        • By Touch Technology
        • By Aspect Ratio
        • By Screen Size
        • By Resolution
        • By End-use Industry
    • Spain
      • Pricing Analysis
      • Market Share Analysis, 2024
        • By Touch Technology
        • By Aspect Ratio
        • By Screen Size
        • By Resolution
        • By End-use Industry
    • France
      • Pricing Analysis
      • Market Share Analysis, 2024
        • By Touch Technology
        • By Aspect Ratio
        • By Screen Size
        • By Resolution
        • By End-use Industry
    • India
      • Pricing Analysis
      • Market Share Analysis, 2024
        • By Touch Technology
        • By Aspect Ratio
        • By Screen Size
        • By Resolution
        • By End-use Industry
    • ASEAN
      • Pricing Analysis
      • Market Share Analysis, 2024
        • By Touch Technology
        • By Aspect Ratio
        • By Screen Size
        • By Resolution
        • By End-use Industry
    • Australia & New Zealand
      • Pricing Analysis
      • Market Share Analysis, 2024
        • By Touch Technology
        • By Aspect Ratio
        • By Screen Size
        • By Resolution
        • By End-use Industry
    • China
      • Pricing Analysis
      • Market Share Analysis, 2024
        • By Touch Technology
        • By Aspect Ratio
        • By Screen Size
        • By Resolution
        • By End-use Industry
    • Japan
      • Pricing Analysis
      • Market Share Analysis, 2024
        • By Touch Technology
        • By Aspect Ratio
        • By Screen Size
        • By Resolution
        • By End-use Industry
    • South Korea
      • Pricing Analysis
      • Market Share Analysis, 2024
        • By Touch Technology
        • By Aspect Ratio
        • By Screen Size
        • By Resolution
        • By End-use Industry
    • Russia
      • Pricing Analysis
      • Market Share Analysis, 2024
        • By Touch Technology
        • By Aspect Ratio
        • By Screen Size
        • By Resolution
        • By End-use Industry
    • Poland
      • Pricing Analysis
      • Market Share Analysis, 2024
        • By Touch Technology
        • By Aspect Ratio
        • By Screen Size
        • By Resolution
        • By End-use Industry
    • Hungary
      • Pricing Analysis
      • Market Share Analysis, 2024
        • By Touch Technology
        • By Aspect Ratio
        • By Screen Size
        • By Resolution
        • By End-use Industry
    • Kingdom of Saudi Arabia
      • Pricing Analysis
      • Market Share Analysis, 2024
        • By Touch Technology
        • By Aspect Ratio
        • By Screen Size
        • By Resolution
        • By End-use Industry
    • Turkiye
      • Pricing Analysis
      • Market Share Analysis, 2024
        • By Touch Technology
        • By Aspect Ratio
        • By Screen Size
        • By Resolution
        • By End-use Industry
    • South Africa
      • Pricing Analysis
      • Market Share Analysis, 2024
        • By Touch Technology
        • By Aspect Ratio
        • By Screen Size
        • By Resolution
        • By End-use Industry
  20. Market Structure Analysis
    • Competition Dashboard
    • Competition Benchmarking
    • Market Share Analysis of Top Players
      • By Regional
      • By Touch Technology
      • By Aspect Ratio
      • By Screen Size
      • By Resolution
      • By End-use Industry
  21. Competition Analysis
    • Competition Deep Dive
      • Elo Touch Solutions
        • Overview
        • Product Portfolio
        • Profitability by Market Segments (Product/Age /Sales Channel/Region)
        • Sales Footprint
        • Strategy Overview
          • Marketing Strategy
          • Product Strategy
          • Channel Strategy
      • ViewSonic
      • NEC Display Solutions
      • LG Display
      • Planar Systems
      • Samsung Electronics
      • BOE Technology Group
      • Others
  22. Assumptions & Acronyms Used
  23. Research Methodology

List of Tables

  • Table 1: Global Commercial Touch Display Market Value (USD Mn) Forecast by Region, 2020-2035
  • Table 2: Global Commercial Touch Display Market Value (USD Mn) Forecast by Touch Technology , 2020-2035
  • Table 3: Global Commercial Touch Display Market Value (USD Mn) Forecast by Aspect Ratio, 2020-2035
  • Table 4: Global Commercial Touch Display Market Value (USD Mn) Forecast by Screen Size, 2020-2035
  • Table 5: Global Commercial Touch Display Market Value (USD Mn) Forecast by Resolution, 2020-2035
  • Table 6: Global Commercial Touch Display Market Value (USD Mn) Forecast by End-use Industry, 2020-2035
  • Table 7: North America Commercial Touch Display Market Value (USD Mn) Forecast by Country, 2020-2035
  • Table 8: North America Commercial Touch Display Market Value (USD Mn) Forecast by Touch Technology , 2020-2035
  • Table 9: North America Commercial Touch Display Market Value (USD Mn) Forecast by Aspect Ratio, 2020-2035
  • Table 10: North America Commercial Touch Display Market Value (USD Mn) Forecast by Screen Size, 2020-2035
  • Table 11: North America Commercial Touch Display Market Value (USD Mn) Forecast by Resolution, 2020-2035
  • Table 12: North America Commercial Touch Display Market Value (USD Mn) Forecast by End-use Industry, 2020-2035
  • Table 13: Latin America Commercial Touch Display Market Value (USD Mn) Forecast by Country, 2020-2035
  • Table 14: Latin America Commercial Touch Display Market Value (USD Mn) Forecast by Touch Technology , 2020-2035
  • Table 15: Latin America Commercial Touch Display Market Value (USD Mn) Forecast by Aspect Ratio, 2020-2035
  • Table 16: Latin America Commercial Touch Display Market Value (USD Mn) Forecast by Screen Size, 2020-2035
  • Table 17: Latin America Commercial Touch Display Market Value (USD Mn) Forecast by Resolution, 2020-2035
  • Table 18: Latin America Commercial Touch Display Market Value (USD Mn) Forecast by End-use Industry, 2020-2035
  • Table 19: Western Europe Commercial Touch Display Market Value (USD Mn) Forecast by Country, 2020-2035
  • Table 20: Western Europe Commercial Touch Display Market Value (USD Mn) Forecast by Touch Technology , 2020-2035
  • Table 21: Western Europe Commercial Touch Display Market Value (USD Mn) Forecast by Aspect Ratio, 2020-2035
  • Table 22: Western Europe Commercial Touch Display Market Value (USD Mn) Forecast by Screen Size, 2020-2035
  • Table 23: Western Europe Commercial Touch Display Market Value (USD Mn) Forecast by Resolution, 2020-2035
  • Table 24: Western Europe Commercial Touch Display Market Value (USD Mn) Forecast by End-use Industry, 2020-2035
  • Table 25: Eastern Europe Commercial Touch Display Market Value (USD Mn) Forecast by Country, 2020-2035
  • Table 26: Eastern Europe Commercial Touch Display Market Value (USD Mn) Forecast by Touch Technology , 2020-2035
  • Table 27: Eastern Europe Commercial Touch Display Market Value (USD Mn) Forecast by Aspect Ratio, 2020-2035
  • Table 28: Eastern Europe Commercial Touch Display Market Value (USD Mn) Forecast by Screen Size, 2020-2035
  • Table 29: Eastern Europe Commercial Touch Display Market Value (USD Mn) Forecast by Resolution, 2020-2035
  • Table 30: Eastern Europe Commercial Touch Display Market Value (USD Mn) Forecast by End-use Industry, 2020-2035
  • Table 31: East Asia Commercial Touch Display Market Value (USD Mn) Forecast by Country, 2020-2035
  • Table 32: East Asia Commercial Touch Display Market Value (USD Mn) Forecast by Touch Technology , 2020-2035
  • Table 33: East Asia Commercial Touch Display Market Value (USD Mn) Forecast by Aspect Ratio, 2020-2035
  • Table 34: East Asia Commercial Touch Display Market Value (USD Mn) Forecast by Screen Size, 2020-2035
  • Table 35: East Asia Commercial Touch Display Market Value (USD Mn) Forecast by Resolution, 2020-2035
  • Table 36: East Asia Commercial Touch Display Market Value (USD Mn) Forecast by End-use Industry, 2020-2035
  • Table 37: South Asia and Pacific Commercial Touch Display Market Value (USD Mn) Forecast by Country, 2020-2035
  • Table 38: South Asia and Pacific Commercial Touch Display Market Value (USD Mn) Forecast by Touch Technology , 2020-2035
  • Table 39: South Asia and Pacific Commercial Touch Display Market Value (USD Mn) Forecast by Aspect Ratio, 2020-2035
  • Table 40: South Asia and Pacific Commercial Touch Display Market Value (USD Mn) Forecast by Screen Size, 2020-2035
  • Table 41: South Asia and Pacific Commercial Touch Display Market Value (USD Mn) Forecast by Resolution, 2020-2035
  • Table 42: South Asia and Pacific Commercial Touch Display Market Value (USD Mn) Forecast by End-use Industry, 2020-2035
  • Table 43: Middle East & Africa Commercial Touch Display Market Value (USD Mn) Forecast by Country, 2020-2035
  • Table 44: Middle East & Africa Commercial Touch Display Market Value (USD Mn) Forecast by Touch Technology , 2020-2035
  • Table 45: Middle East & Africa Commercial Touch Display Market Value (USD Mn) Forecast by Aspect Ratio, 2020-2035
  • Table 46: Middle East & Africa Commercial Touch Display Market Value (USD Mn) Forecast by Screen Size, 2020-2035
  • Table 47: Middle East & Africa Commercial Touch Display Market Value (USD Mn) Forecast by Resolution, 2020-2035
  • Table 48: Middle East & Africa Commercial Touch Display Market Value (USD Mn) Forecast by End-use Industry, 2020-2035

List of Figures

  • Figure 1: Global Commercial Touch Display Market Pricing Analysis
  • Figure 2: Global Commercial Touch Display Market Value (USD Mn) Forecast 2020-2035
  • Figure 3: Global Commercial Touch Display Market Value (USD Mn) Share and BPS Analysis by Region, 2025 and 2035
  • Figure 4: Global Commercial Touch Display Market Y-o-Y Growth Comparison by Region, 2025-2035
  • Figure 5: Global Commercial Touch Display Market Attractiveness Analysis by Region
  • Figure 6: North America Commercial Touch Display Market Incremental Dollar Opportunity, 2025-2035
  • Figure 7: Latin America Commercial Touch Display Market Incremental Dollar Opportunity, 2025-2035
  • Figure 8: Western Europe Commercial Touch Display Market Incremental Dollar Opportunity, 2025-2035
  • Figure 9: Eastern Europe Commercial Touch Display Market Incremental Dollar Opportunity, 2025-2035
  • Figure 10: East Asia Commercial Touch Display Market Incremental Dollar Opportunity, 2025-2035
  • Figure 11: South Asia and Pacific Commercial Touch Display Market Incremental Dollar Opportunity, 2025-2035
  • Figure 12: Middle East & Africa Commercial Touch Display Market Incremental Dollar Opportunity, 2025-2035
  • Figure 13: North America Commercial Touch Display Market Value Share and BPS Analysis by Country, 2025 and 2035
  • Figure 14: Latin America Commercial Touch Display Market Value Share and BPS Analysis by Country, 2025 and 2035
  • Figure 15: Western Europe Commercial Touch Display Market Value Share and BPS Analysis by Country, 2025 and 2035
  • Figure 16: Eastern Europe Commercial Touch Display Market Value Share and BPS Analysis by Country, 2025 and 2035
  • Figure 17: East Asia Commercial Touch Display Market Value Share and BPS Analysis by Country, 2025 and 2035
  • Figure 18: South Asia and Pacific Commercial Touch Display Market Value Share and BPS Analysis by Country, 2025 and 2035
  • Figure 19: Middle East & Africa Commercial Touch Display Market Value Share and BPS Analysis by Country, 2025 and 2035
  • Figure 20: Global Commercial Touch Display Market - Tier Structure Analysis
  • Figure 21: Global Commercial Touch Display Market Company Share Analysis

Frequently Asked Questions

How big is the commercial touch display market in 2025?

The global commercial touch display market is estimated to be valued at USD 6.9 billion in 2025.

What will be the size of commercial touch display market in 2035?

The market size for the commercial touch display market is projected to reach USD 16.3 billion by 2035.

How much will be the commercial touch display market growth between 2025 and 2035?

The commercial touch display market is expected to grow at a 9.0% CAGR between 2025 and 2035.

What are the key product types in the commercial touch display market?

The key product types in commercial touch display market are capacitive touch, infrared touch, resistive touch, optical imaging and surface acoustic wave.

Which aspect ratio segment to contribute significant share in the commercial touch display market in 2025?

In terms of aspect ratio, wide segment to command 67.0% share in the commercial touch display market in 2025.

Explore Similar Insights

Future Market Insights

Commercial Touch Display Market