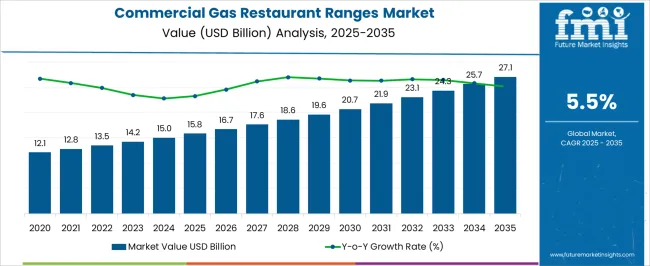
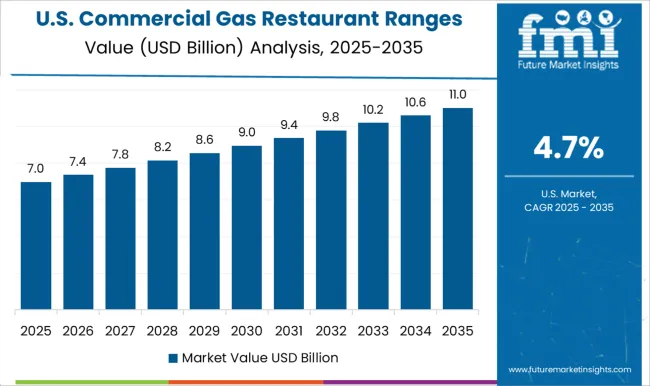
The global commercial gas restaurant ranges market was valued at USD 13,497.6 million in 2022. As per FMI’s report, the market is poised to reach USD 14,240 million by 2023-end and is projected to exhibit a CAGR of 5.50% from 2023 to 2033. Restaurants in most countries are characterized by a rich culinary tradition.
Restaurants depend on commercial gas ranges for reliable, consistent cooking power and a cost-effective, efficient way to cook. Restaurant ranges have evolved into modern, streamlined designs that are more energy efficient and environmentally friendly in recent years.
Manufacturers will continue to introduce new models that feature innovative technologies, including induction heating and digital temperature controls, as well as advanced safety features in the coming years. Innovating features are being introduced by many manufacturers, such as vacuum-sealed cookers that can cook slowly, as well as customized options like griddle plates, wok burners, and open-top cooking ranges.
By customizing cooking space, restaurants are able to meet the needs of their customers. Commercial gas ranges will grow and evolve alongside the restaurant industry, giving restaurants more options that meet their budgets and needs in the market.
Data Points | Key Statistics |
---|---|
Estimated Base Year Value (2022) | USD 13,497.6 million |
Expected Market Value (2023) | USD 14,240 million |
Anticipated Forecast Value (2033) | USD 24,324 million |
Projected Growth Rate (2023 to 2033) | 5.50% CAGR |
Several USA senators introduced the Natural Gas Appliances Standards (Natural GAS) Act of 2023, including John Barrasso (R-Wyo), Jim Risch (R-Idaho), Mike Lee (R-Utah), and Bill Cassidy (R-La.). Under this legislation, any decision by the Department of Energy that would outlaw sales of natural gas appliances will be blocked. A comparison of natural gas and other fuels for residential applications has shown that it significantly reduces raw energy consumption compared with other fuels, and it produces less air pollution compared with other fuels.
The Biden administration is attacking the gas appliances that are a critical part of keeping many Americans' homes warm and fed. As a result of the Natural GAS Act, Americans will not have to worry about the government getting into their kitchen or their furnace.
From 2017 to 2022, sales of commercial gas restaurant ranges witnessed significant growth, registering a CAGR of 4.5%. Glass top cooking ranges are a popular choice among commercial kitchens because of their visual aesthetics.
With a demand for innovative designs, colors, and other features on products, the market is expected to gain a competitive advantage and be capable of providing superior products to customers. Due to the top-notch technology and easy installation, the market is expected to grow in the coming years.
Brand awareness is the key to increasing traffic and product discovery on the e-commerce platform. Increasing demand for portable commercial gas ranges for restaurants will further contribute to the market's growth.
Growing Demand for Small to Large-Scale Restaurants has Pushed the Market for Commercial Gas Restaurant Ranges
A wide range of technological innovations, such as more energy-efficient and inexpensive appliances for commercial kitchens, and the launch of new and advanced products, is expected to open new opportunities for market growth in the future.
Increasing home cooking and the popularity of home restaurants in developing regions have further propelled the growth of commercial gas restaurant ranges. With the growth of online sales and free delivery services by a wide range of business sectors, it is expected that the market will continue to grow.
A broad range of manufacturers will offer maintenance and service opinions to increase market demand. As easy-to-clean and customizable options are introduced to the market, the market is likely to expand.
Manufacturers will increase their provision of thermostats with adjustable temperature settings, which is expected to drive market growth. Commercial gas stoves have the advantage of evenly spreading the heat through the entire cooking area, increasing the range of dishes that can be prepared. As a result, cooking preparation for these machines is greatly reduced since the central part can be heated very quickly. Hence the market is expected to grow.
Gas Restaurant Ranges with Premium Features will Provide a Lucrative Market Opportunity
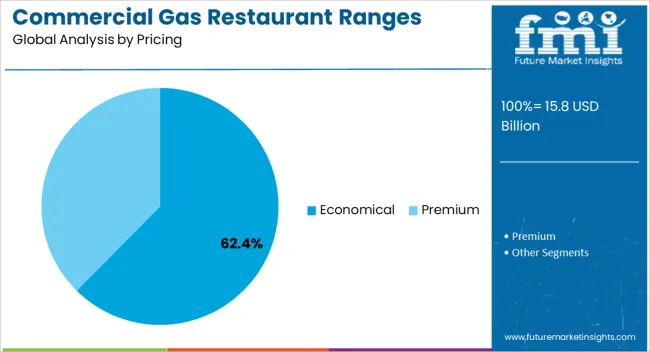
Culinary adventurers who are constantly searching for new techniques will find commercial-style ranges a great tool in the market. Premium commercial gas ranges are expected to grow in popularity in the restaurant business due to the demand for adjustable grates that will suit a variety of cooking techniques in the restaurant business.
Therefore, commercial gas restaurant ranges are in high demand due to a growing demand for high-quality, durable, and efficient cooking equipment. In recent years, the market for commercial gas restaurant ranges has grown rapidly due to consumers' growing demands for customizable gas ranges.
The High Development Costs of Commercial Gas Restaurant Ranges are Inhibiting Growth in the Industry
In recent years, the development of electric kitchens in commercial facilities as well as the need for cost-effective solutions has hindered the growth of commercial gas restaurants in the market. With the limited availability of control and accessory components which are easily available in electric stoves like tops, fans, and bottom grills, these limitations will further hinder the market growth.
Government initiatives to reduce environmental impacts and increasing demand to reduce greenhouse gases further impede market development. In New York City, for example, in 2021, a bill was passed requiring the use of gas in the construction of new buildings beginning in 2024 for those under seven stories and continuing in 2027 for buildings higher than seven stories. According to the UN, buildings emit about 70% of global greenhouse gases, hence this bill was passed in an effort to reduce carbon emissions.
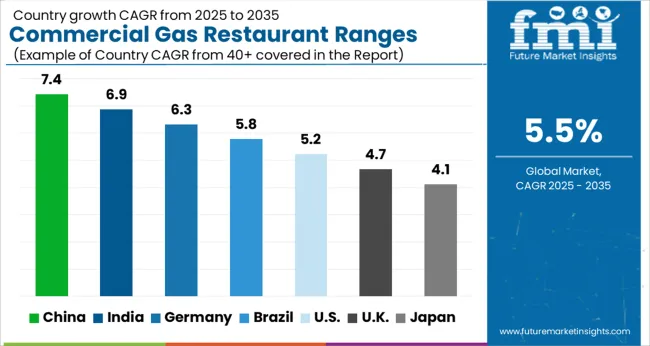
Expansion of the Restaurant Businesses in the USA Will Drive the Adoption of Commercial Gas Restaurant Ranges
Due to the high consumer demand for restaurant food in North America, this region accounted for 40% of the market share for commercial gas restaurant ranges in 2023.
As restaurants become more and more aware of the importance of the restaurant market and demand for aesthetic designs in restaurants has fueled the market for commercial gas restaurant ranges. FMI projects that by 2022, the market shares of commercial gas restaurants rages reached 33.30% in the United States.
It is expected that the market will continue to grow due to the wide choice of available products, including open burner, French top, and griddle configurations, including double convection ovens.
Growing Food Chain Business in Asia Pacific has Led to a Surge in Demand for Commercial Gas Restaurant Ranges
Asia Pacific region is expected to grow at the fastest rate during the forecast period. Increasing disposable income, availability of a large population, and increasing focus on small food businesses have contributed to the growth of the market.
In countries like India and China, restaurants will be able to choose from a variety of styles, shapes, and designs, which will in turn positively affect demand for commercial gas restaurant ranges. Gas restaurant ranges for commercial use are expected to grow at a CAGR of 6.20% in China and India.
Due to the region's dynamic food service industry and increasing demand for high-quality cooking equipment, commercial gas restaurant ranges in the Asia Pacific region are expected to grow in the coming years.
The Asia Pacific region is home to key players such as Rational AG, Middleby Corporation, and Ali Group. The company offers a range of products specific to the needs of the regional food service market which has a diverse range of products to choose from.
LPG Range is expected to grow at a Significant Rate
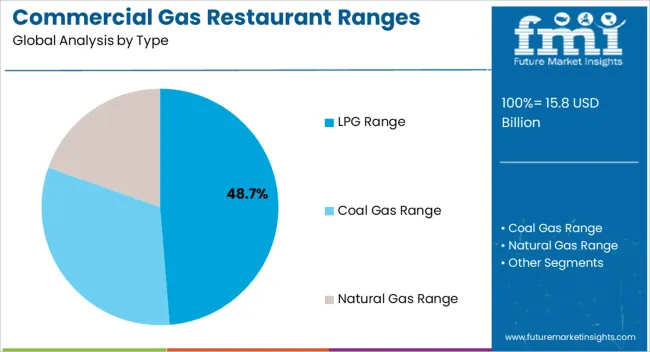
LPG range is expected to grow at a faster pace and reach a market value of 55% during the forecast period. Among all commercial gas ranges, LPG units are the most popular, as they offer the most efficient and consistent heating source.
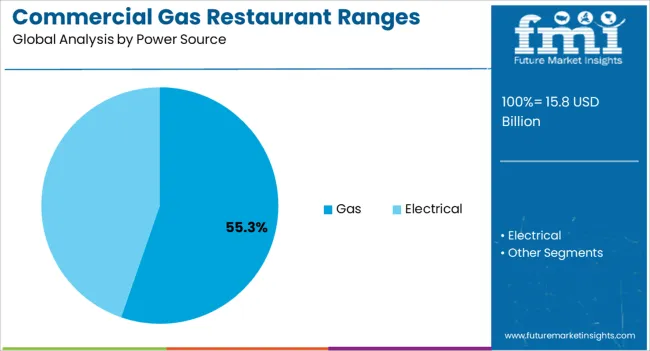
Since gas is so beneficial to cooking, commercial kitchens are increasingly using gas as their main energy source. Cooking with LPG is one of the most common uses of gas. Gas fuels like LPG (Liquefied Petroleum Gas) are perfect for cooking, heating, driving, and industrial use. Hence demand LPG gas ranges is expected to grow demand for commercial gas ranges in the market.
Experienced chefs and kitchens in commercial settings need to work fast. In order to be efficient, they often deal with many customers at once. Besides providing heat faster, gas also cools faster, so chefs can control cooking temperatures much more easily for faster meal preparation. Hence the market is expected to grow in demand for LPG ranges.
Demand for Commercial Gas Restaurant Ranges in Hotels & Restaurants to Gain Traction
The hotel & restaurant segment accounted for the largest share of the market with 40.8% in 2023, driven by the increasing demand for fast food restaurants in the market. Commercial gas burner demand is increasing globally as luxury hotels and restaurants become more prevalent.
Due to space and capital limitations, hotels increasingly rely on commercial gas ranges to cook. Demand for hotels fluctuates with the seasons, and the price-setting process needs to take the responsiveness of the demand into consideration.
Food chain business competition and government initiatives to ensure hygienic restaurants further drive the growth of this market. As appliances become safer and regulations become more stringent, demand on the market will continue to increase.
Gas Ranges for Commercial Restaurants are Dominant in the Deck and Convention Oven Segments
The deck & convection oven segment dominated the applications market for commercial gas restaurant ranges accounting for 23% of the market value in 2023. Pizza popularity and increasing demand for Italian restaurants are expected to drive the deck oven market.
The popularity of bakeries and an increase in savory chefs are expected to increase sales of deck ovens in commercial gas restaurant ranges. This equipment can accommodate multiple convection chambers and decks, making it ideal for bakeries, restaurants, and retail stores seeking to use both the deck and convection baking techniques in the market. In addition to these models, proofing chambers are also available to order as an option.
Since Deck ovens have the advantage of being able to cook on the top or bottom of the oven, they are more versatile than convection ovens. Additionally, they quickly heat up, facilitating the cooking process in a timely manner.
It's common to find convection ovens that have a number of racks that can hold different kinds of food, as well as a broil setting to speed up the cooking process above the grilling setting, as well as a fan that circulates air throughout the oven. All these factors are expected to grow in demand for deck & conventional ovens.
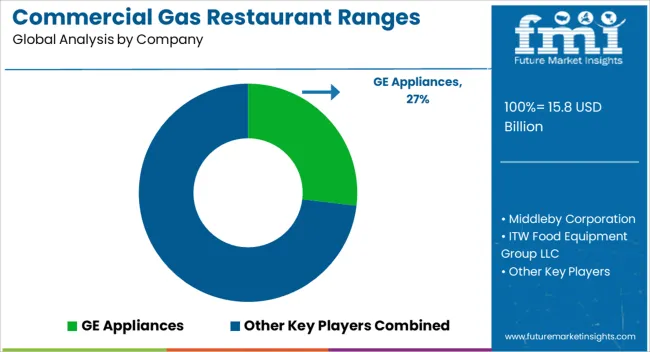
Some of the start-ups in the commercial gas restaurant range market include
The global market is flooded with new advanced products and services being introduced by key players. Stainless steel cooktops and innovative technologies are used by these companies to reduce cleaning work.
Modern gas restaurant ranges will use miniature designs and digital technology to enhance their performance. Mergers, acquisitions, partnerships, and product launches will further be emphasized by market players.
Report Attribute | Details |
---|---|
Market Value in 2023 | USD 14,240 million |
Market Value in 2033 | USD 24,324 million |
Growth Rate | CAGR of 5.50% from 2023 to 2033 |
Base Year for Estimation | 2022 |
Historical Data | 2018 to 2022 |
Forecast Period | 2023 to 2033 |
Quantitative Units | Revenue in USD Billion and CAGR from 2023 to 2033 |
Report Coverage | Revenue Forecast, Volume Forecast, Company Ranking, Competitive Landscape, Growth Factors, Trends and Pricing Analysis |
Segments Covered | Type, Power Source, Pricing, End-User, Application, Region |
Regions Covered | North America; Latin America; Europe; Asia Pacific; Middle East & Africa |
Key Countries Profiled | USA, Canada, Brazil, Mexico, Germany, United kingdom, France, Spain, Italy, China, Japan, South Korea, Singapore, Thailand, Indonesia, Australia, New Zealand, GCC, South Africa, Israel |
Key Companies Profiled | GE Appliances; Middleby Corporation; ITW Food Equipment Group LLC; Electrolux AB; Comstock-Castle Stove Co., Inc.; Elica SPA; Whirlpool Corporation; Elster GmbH; Comet Kitchen Company; Kanteen India Equipments Co.; Jindal Gas Appliances Pvt. Ltd.; Shree Ambica Industries |
Customization | Available Upon Request |
Table 1: Global Market Value (US$ Million) Forecast by Region, 2018 to 2033
Table 2: Global Market Volume (Units) Forecast by Region, 2018 to 2033
Table 3: Global Market Value (US$ Million) Forecast by Type, 2018 to 2033
Table 4: Global Market Volume (Units) Forecast by Type, 2018 to 2033
Table 5: Global Market Value (US$ Million) Forecast by Power Source, 2018 to 2033
Table 6: Global Market Volume (Units) Forecast by Power Source, 2018 to 2033
Table 7: Global Market Value (US$ Million) Forecast by Pricing, 2018 to 2033
Table 8: Global Market Volume (Units) Forecast by Pricing, 2018 to 2033
Table 9: Global Market Value (US$ Million) Forecast by End User, 2018 to 2033
Table 10: Global Market Volume (Units) Forecast by End User, 2018 to 2033
Table 11: Global Market Value (US$ Million) Forecast by Application, 2018 to 2033
Table 12: Global Market Volume (Units) Forecast by Application, 2018 to 2033
Table 13: North America Market Value (US$ Million) Forecast by Country, 2018 to 2033
Table 14: North America Market Volume (Units) Forecast by Country, 2018 to 2033
Table 15: North America Market Value (US$ Million) Forecast by Type, 2018 to 2033
Table 16: North America Market Volume (Units) Forecast by Type, 2018 to 2033
Table 17: North America Market Value (US$ Million) Forecast by Power Source, 2018 to 2033
Table 18: North America Market Volume (Units) Forecast by Power Source, 2018 to 2033
Table 19: North America Market Value (US$ Million) Forecast by Pricing, 2018 to 2033
Table 20: North America Market Volume (Units) Forecast by Pricing, 2018 to 2033
Table 21: North America Market Value (US$ Million) Forecast by End User, 2018 to 2033
Table 22: North America Market Volume (Units) Forecast by End User, 2018 to 2033
Table 23: North America Market Value (US$ Million) Forecast by Application, 2018 to 2033
Table 24: North America Market Volume (Units) Forecast by Application, 2018 to 2033
Table 25: Latin America Market Value (US$ Million) Forecast by Country, 2018 to 2033
Table 26: Latin America Market Volume (Units) Forecast by Country, 2018 to 2033
Table 27: Latin America Market Value (US$ Million) Forecast by Type, 2018 to 2033
Table 28: Latin America Market Volume (Units) Forecast by Type, 2018 to 2033
Table 29: Latin America Market Value (US$ Million) Forecast by Power Source, 2018 to 2033
Table 30: Latin America Market Volume (Units) Forecast by Power Source, 2018 to 2033
Table 31: Latin America Market Value (US$ Million) Forecast by Pricing, 2018 to 2033
Table 32: Latin America Market Volume (Units) Forecast by Pricing, 2018 to 2033
Table 33: Latin America Market Value (US$ Million) Forecast by End User, 2018 to 2033
Table 34: Latin America Market Volume (Units) Forecast by End User, 2018 to 2033
Table 35: Latin America Market Value (US$ Million) Forecast by Application, 2018 to 2033
Table 36: Latin America Market Volume (Units) Forecast by Application, 2018 to 2033
Table 37: Europe Market Value (US$ Million) Forecast by Country, 2018 to 2033
Table 38: Europe Market Volume (Units) Forecast by Country, 2018 to 2033
Table 39: Europe Market Value (US$ Million) Forecast by Type, 2018 to 2033
Table 40: Europe Market Volume (Units) Forecast by Type, 2018 to 2033
Table 41: Europe Market Value (US$ Million) Forecast by Power Source, 2018 to 2033
Table 42: Europe Market Volume (Units) Forecast by Power Source, 2018 to 2033
Table 43: Europe Market Value (US$ Million) Forecast by Pricing, 2018 to 2033
Table 44: Europe Market Volume (Units) Forecast by Pricing, 2018 to 2033
Table 45: Europe Market Value (US$ Million) Forecast by End User, 2018 to 2033
Table 46: Europe Market Volume (Units) Forecast by End User, 2018 to 2033
Table 47: Europe Market Value (US$ Million) Forecast by Application, 2018 to 2033
Table 48: Europe Market Volume (Units) Forecast by Application, 2018 to 2033
Table 49: Asia Pacific Market Value (US$ Million) Forecast by Country, 2018 to 2033
Table 50: Asia Pacific Market Volume (Units) Forecast by Country, 2018 to 2033
Table 51: Asia Pacific Market Value (US$ Million) Forecast by Type, 2018 to 2033
Table 52: Asia Pacific Market Volume (Units) Forecast by Type, 2018 to 2033
Table 53: Asia Pacific Market Value (US$ Million) Forecast by Power Source, 2018 to 2033
Table 54: Asia Pacific Market Volume (Units) Forecast by Power Source, 2018 to 2033
Table 55: Asia Pacific Market Value (US$ Million) Forecast by Pricing, 2018 to 2033
Table 56: Asia Pacific Market Volume (Units) Forecast by Pricing, 2018 to 2033
Table 57: Asia Pacific Market Value (US$ Million) Forecast by End User, 2018 to 2033
Table 58: Asia Pacific Market Volume (Units) Forecast by End User, 2018 to 2033
Table 59: Asia Pacific Market Value (US$ Million) Forecast by Application, 2018 to 2033
Table 60: Asia Pacific Market Volume (Units) Forecast by Application, 2018 to 2033
Table 61: MEA Market Value (US$ Million) Forecast by Country, 2018 to 2033
Table 62: MEA Market Volume (Units) Forecast by Country, 2018 to 2033
Table 63: MEA Market Value (US$ Million) Forecast by Type, 2018 to 2033
Table 64: MEA Market Volume (Units) Forecast by Type, 2018 to 2033
Table 65: MEA Market Value (US$ Million) Forecast by Power Source, 2018 to 2033
Table 66: MEA Market Volume (Units) Forecast by Power Source, 2018 to 2033
Table 67: MEA Market Value (US$ Million) Forecast by Pricing, 2018 to 2033
Table 68: MEA Market Volume (Units) Forecast by Pricing, 2018 to 2033
Table 69: MEA Market Value (US$ Million) Forecast by End User, 2018 to 2033
Table 70: MEA Market Volume (Units) Forecast by End User, 2018 to 2033
Table 71: MEA Market Value (US$ Million) Forecast by Application, 2018 to 2033
Table 72: MEA Market Volume (Units) Forecast by Application, 2018 to 2033
Figure 1: Global Market Value (US$ Million) by Type, 2023 to 2033
Figure 2: Global Market Value (US$ Million) by Power Source, 2023 to 2033
Figure 3: Global Market Value (US$ Million) by Pricing, 2023 to 2033
Figure 4: Global Market Value (US$ Million) by End User, 2023 to 2033
Figure 5: Global Market Value (US$ Million) by Application, 2023 to 2033
Figure 6: Global Market Value (US$ Million) by Region, 2023 to 2033
Figure 7: Global Market Value (US$ Million) Analysis by Region, 2018 to 2033
Figure 8: Global Market Volume (Units) Analysis by Region, 2018 to 2033
Figure 9: Global Market Value Share (%) and BPS Analysis by Region, 2023 to 2033
Figure 10: Global Market Y-o-Y Growth (%) Projections by Region, 2023 to 2033
Figure 11: Global Market Value (US$ Million) Analysis by Type, 2018 to 2033
Figure 12: Global Market Volume (Units) Analysis by Type, 2018 to 2033
Figure 13: Global Market Value Share (%) and BPS Analysis by Type, 2023 to 2033
Figure 14: Global Market Y-o-Y Growth (%) Projections by Type, 2023 to 2033
Figure 15: Global Market Value (US$ Million) Analysis by Power Source, 2018 to 2033
Figure 16: Global Market Volume (Units) Analysis by Power Source, 2018 to 2033
Figure 17: Global Market Value Share (%) and BPS Analysis by Power Source, 2023 to 2033
Figure 18: Global Market Y-o-Y Growth (%) Projections by Power Source, 2023 to 2033
Figure 19: Global Market Value (US$ Million) Analysis by Pricing, 2018 to 2033
Figure 20: Global Market Volume (Units) Analysis by Pricing, 2018 to 2033
Figure 21: Global Market Value Share (%) and BPS Analysis by Pricing, 2023 to 2033
Figure 22: Global Market Y-o-Y Growth (%) Projections by Pricing, 2023 to 2033
Figure 23: Global Market Value (US$ Million) Analysis by End User, 2018 to 2033
Figure 24: Global Market Volume (Units) Analysis by End User, 2018 to 2033
Figure 25: Global Market Value Share (%) and BPS Analysis by End User, 2023 to 2033
Figure 26: Global Market Y-o-Y Growth (%) Projections by End User, 2023 to 2033
Figure 27: Global Market Value (US$ Million) Analysis by Application, 2018 to 2033
Figure 28: Global Market Volume (Units) Analysis by Application, 2018 to 2033
Figure 29: Global Market Value Share (%) and BPS Analysis by Application, 2023 to 2033
Figure 30: Global Market Y-o-Y Growth (%) Projections by Application, 2023 to 2033
Figure 31: Global Market Attractiveness by Type, 2023 to 2033
Figure 32: Global Market Attractiveness by Power Source, 2023 to 2033
Figure 33: Global Market Attractiveness by Pricing, 2023 to 2033
Figure 34: Global Market Attractiveness by End User, 2023 to 2033
Figure 35: Global Market Attractiveness by Application, 2023 to 2033
Figure 36: Global Market Attractiveness by Region, 2023 to 2033
Figure 37: North America Market Value (US$ Million) by Type, 2023 to 2033
Figure 38: North America Market Value (US$ Million) by Power Source, 2023 to 2033
Figure 39: North America Market Value (US$ Million) by Pricing, 2023 to 2033
Figure 40: North America Market Value (US$ Million) by End User, 2023 to 2033
Figure 41: North America Market Value (US$ Million) by Application, 2023 to 2033
Figure 42: North America Market Value (US$ Million) by Country, 2023 to 2033
Figure 43: North America Market Value (US$ Million) Analysis by Country, 2018 to 2033
Figure 44: North America Market Volume (Units) Analysis by Country, 2018 to 2033
Figure 45: North America Market Value Share (%) and BPS Analysis by Country, 2023 to 2033
Figure 46: North America Market Y-o-Y Growth (%) Projections by Country, 2023 to 2033
Figure 47: North America Market Value (US$ Million) Analysis by Type, 2018 to 2033
Figure 48: North America Market Volume (Units) Analysis by Type, 2018 to 2033
Figure 49: North America Market Value Share (%) and BPS Analysis by Type, 2023 to 2033
Figure 50: North America Market Y-o-Y Growth (%) Projections by Type, 2023 to 2033
Figure 51: North America Market Value (US$ Million) Analysis by Power Source, 2018 to 2033
Figure 52: North America Market Volume (Units) Analysis by Power Source, 2018 to 2033
Figure 53: North America Market Value Share (%) and BPS Analysis by Power Source, 2023 to 2033
Figure 54: North America Market Y-o-Y Growth (%) Projections by Power Source, 2023 to 2033
Figure 55: North America Market Value (US$ Million) Analysis by Pricing, 2018 to 2033
Figure 56: North America Market Volume (Units) Analysis by Pricing, 2018 to 2033
Figure 57: North America Market Value Share (%) and BPS Analysis by Pricing, 2023 to 2033
Figure 58: North America Market Y-o-Y Growth (%) Projections by Pricing, 2023 to 2033
Figure 59: North America Market Value (US$ Million) Analysis by End User, 2018 to 2033
Figure 60: North America Market Volume (Units) Analysis by End User, 2018 to 2033
Figure 61: North America Market Value Share (%) and BPS Analysis by End User, 2023 to 2033
Figure 62: North America Market Y-o-Y Growth (%) Projections by End User, 2023 to 2033
Figure 63: North America Market Value (US$ Million) Analysis by Application, 2018 to 2033
Figure 64: North America Market Volume (Units) Analysis by Application, 2018 to 2033
Figure 65: North America Market Value Share (%) and BPS Analysis by Application, 2023 to 2033
Figure 66: North America Market Y-o-Y Growth (%) Projections by Application, 2023 to 2033
Figure 67: North America Market Attractiveness by Type, 2023 to 2033
Figure 68: North America Market Attractiveness by Power Source, 2023 to 2033
Figure 69: North America Market Attractiveness by Pricing, 2023 to 2033
Figure 70: North America Market Attractiveness by End User, 2023 to 2033
Figure 71: North America Market Attractiveness by Application, 2023 to 2033
Figure 72: North America Market Attractiveness by Country, 2023 to 2033
Figure 73: Latin America Market Value (US$ Million) by Type, 2023 to 2033
Figure 74: Latin America Market Value (US$ Million) by Power Source, 2023 to 2033
Figure 75: Latin America Market Value (US$ Million) by Pricing, 2023 to 2033
Figure 76: Latin America Market Value (US$ Million) by End User, 2023 to 2033
Figure 77: Latin America Market Value (US$ Million) by Application, 2023 to 2033
Figure 78: Latin America Market Value (US$ Million) by Country, 2023 to 2033
Figure 79: Latin America Market Value (US$ Million) Analysis by Country, 2018 to 2033
Figure 80: Latin America Market Volume (Units) Analysis by Country, 2018 to 2033
Figure 81: Latin America Market Value Share (%) and BPS Analysis by Country, 2023 to 2033
Figure 82: Latin America Market Y-o-Y Growth (%) Projections by Country, 2023 to 2033
Figure 83: Latin America Market Value (US$ Million) Analysis by Type, 2018 to 2033
Figure 84: Latin America Market Volume (Units) Analysis by Type, 2018 to 2033
Figure 85: Latin America Market Value Share (%) and BPS Analysis by Type, 2023 to 2033
Figure 86: Latin America Market Y-o-Y Growth (%) Projections by Type, 2023 to 2033
Figure 87: Latin America Market Value (US$ Million) Analysis by Power Source, 2018 to 2033
Figure 88: Latin America Market Volume (Units) Analysis by Power Source, 2018 to 2033
Figure 89: Latin America Market Value Share (%) and BPS Analysis by Power Source, 2023 to 2033
Figure 90: Latin America Market Y-o-Y Growth (%) Projections by Power Source, 2023 to 2033
Figure 91: Latin America Market Value (US$ Million) Analysis by Pricing, 2018 to 2033
Figure 92: Latin America Market Volume (Units) Analysis by Pricing, 2018 to 2033
Figure 93: Latin America Market Value Share (%) and BPS Analysis by Pricing, 2023 to 2033
Figure 94: Latin America Market Y-o-Y Growth (%) Projections by Pricing, 2023 to 2033
Figure 95: Latin America Market Value (US$ Million) Analysis by End User, 2018 to 2033
Figure 96: Latin America Market Volume (Units) Analysis by End User, 2018 to 2033
Figure 97: Latin America Market Value Share (%) and BPS Analysis by End User, 2023 to 2033
Figure 98: Latin America Market Y-o-Y Growth (%) Projections by End User, 2023 to 2033
Figure 99: Latin America Market Value (US$ Million) Analysis by Application, 2018 to 2033
Figure 100: Latin America Market Volume (Units) Analysis by Application, 2018 to 2033
Figure 101: Latin America Market Value Share (%) and BPS Analysis by Application, 2023 to 2033
Figure 102: Latin America Market Y-o-Y Growth (%) Projections by Application, 2023 to 2033
Figure 103: Latin America Market Attractiveness by Type, 2023 to 2033
Figure 104: Latin America Market Attractiveness by Power Source, 2023 to 2033
Figure 105: Latin America Market Attractiveness by Pricing, 2023 to 2033
Figure 106: Latin America Market Attractiveness by End User, 2023 to 2033
Figure 107: Latin America Market Attractiveness by Application, 2023 to 2033
Figure 108: Latin America Market Attractiveness by Country, 2023 to 2033
Figure 109: Europe Market Value (US$ Million) by Type, 2023 to 2033
Figure 110: Europe Market Value (US$ Million) by Power Source, 2023 to 2033
Figure 111: Europe Market Value (US$ Million) by Pricing, 2023 to 2033
Figure 112: Europe Market Value (US$ Million) by End User, 2023 to 2033
Figure 113: Europe Market Value (US$ Million) by Application, 2023 to 2033
Figure 114: Europe Market Value (US$ Million) by Country, 2023 to 2033
Figure 115: Europe Market Value (US$ Million) Analysis by Country, 2018 to 2033
Figure 116: Europe Market Volume (Units) Analysis by Country, 2018 to 2033
Figure 117: Europe Market Value Share (%) and BPS Analysis by Country, 2023 to 2033
Figure 118: Europe Market Y-o-Y Growth (%) Projections by Country, 2023 to 2033
Figure 119: Europe Market Value (US$ Million) Analysis by Type, 2018 to 2033
Figure 120: Europe Market Volume (Units) Analysis by Type, 2018 to 2033
Figure 121: Europe Market Value Share (%) and BPS Analysis by Type, 2023 to 2033
Figure 122: Europe Market Y-o-Y Growth (%) Projections by Type, 2023 to 2033
Figure 123: Europe Market Value (US$ Million) Analysis by Power Source, 2018 to 2033
Figure 124: Europe Market Volume (Units) Analysis by Power Source, 2018 to 2033
Figure 125: Europe Market Value Share (%) and BPS Analysis by Power Source, 2023 to 2033
Figure 126: Europe Market Y-o-Y Growth (%) Projections by Power Source, 2023 to 2033
Figure 127: Europe Market Value (US$ Million) Analysis by Pricing, 2018 to 2033
Figure 128: Europe Market Volume (Units) Analysis by Pricing, 2018 to 2033
Figure 129: Europe Market Value Share (%) and BPS Analysis by Pricing, 2023 to 2033
Figure 130: Europe Market Y-o-Y Growth (%) Projections by Pricing, 2023 to 2033
Figure 131: Europe Market Value (US$ Million) Analysis by End User, 2018 to 2033
Figure 132: Europe Market Volume (Units) Analysis by End User, 2018 to 2033
Figure 133: Europe Market Value Share (%) and BPS Analysis by End User, 2023 to 2033
Figure 134: Europe Market Y-o-Y Growth (%) Projections by End User, 2023 to 2033
Figure 135: Europe Market Value (US$ Million) Analysis by Application, 2018 to 2033
Figure 136: Europe Market Volume (Units) Analysis by Application, 2018 to 2033
Figure 137: Europe Market Value Share (%) and BPS Analysis by Application, 2023 to 2033
Figure 138: Europe Market Y-o-Y Growth (%) Projections by Application, 2023 to 2033
Figure 139: Europe Market Attractiveness by Type, 2023 to 2033
Figure 140: Europe Market Attractiveness by Power Source, 2023 to 2033
Figure 141: Europe Market Attractiveness by Pricing, 2023 to 2033
Figure 142: Europe Market Attractiveness by End User, 2023 to 2033
Figure 143: Europe Market Attractiveness by Application, 2023 to 2033
Figure 144: Europe Market Attractiveness by Country, 2023 to 2033
Figure 145: Asia Pacific Market Value (US$ Million) by Type, 2023 to 2033
Figure 146: Asia Pacific Market Value (US$ Million) by Power Source, 2023 to 2033
Figure 147: Asia Pacific Market Value (US$ Million) by Pricing, 2023 to 2033
Figure 148: Asia Pacific Market Value (US$ Million) by End User, 2023 to 2033
Figure 149: Asia Pacific Market Value (US$ Million) by Application, 2023 to 2033
Figure 150: Asia Pacific Market Value (US$ Million) by Country, 2023 to 2033
Figure 151: Asia Pacific Market Value (US$ Million) Analysis by Country, 2018 to 2033
Figure 152: Asia Pacific Market Volume (Units) Analysis by Country, 2018 to 2033
Figure 153: Asia Pacific Market Value Share (%) and BPS Analysis by Country, 2023 to 2033
Figure 154: Asia Pacific Market Y-o-Y Growth (%) Projections by Country, 2023 to 2033
Figure 155: Asia Pacific Market Value (US$ Million) Analysis by Type, 2018 to 2033
Figure 156: Asia Pacific Market Volume (Units) Analysis by Type, 2018 to 2033
Figure 157: Asia Pacific Market Value Share (%) and BPS Analysis by Type, 2023 to 2033
Figure 158: Asia Pacific Market Y-o-Y Growth (%) Projections by Type, 2023 to 2033
Figure 159: Asia Pacific Market Value (US$ Million) Analysis by Power Source, 2018 to 2033
Figure 160: Asia Pacific Market Volume (Units) Analysis by Power Source, 2018 to 2033
Figure 161: Asia Pacific Market Value Share (%) and BPS Analysis by Power Source, 2023 to 2033
Figure 162: Asia Pacific Market Y-o-Y Growth (%) Projections by Power Source, 2023 to 2033
Figure 163: Asia Pacific Market Value (US$ Million) Analysis by Pricing, 2018 to 2033
Figure 164: Asia Pacific Market Volume (Units) Analysis by Pricing, 2018 to 2033
Figure 165: Asia Pacific Market Value Share (%) and BPS Analysis by Pricing, 2023 to 2033
Figure 166: Asia Pacific Market Y-o-Y Growth (%) Projections by Pricing, 2023 to 2033
Figure 167: Asia Pacific Market Value (US$ Million) Analysis by End User, 2018 to 2033
Figure 168: Asia Pacific Market Volume (Units) Analysis by End User, 2018 to 2033
Figure 169: Asia Pacific Market Value Share (%) and BPS Analysis by End User, 2023 to 2033
Figure 170: Asia Pacific Market Y-o-Y Growth (%) Projections by End User, 2023 to 2033
Figure 171: Asia Pacific Market Value (US$ Million) Analysis by Application, 2018 to 2033
Figure 172: Asia Pacific Market Volume (Units) Analysis by Application, 2018 to 2033
Figure 173: Asia Pacific Market Value Share (%) and BPS Analysis by Application, 2023 to 2033
Figure 174: Asia Pacific Market Y-o-Y Growth (%) Projections by Application, 2023 to 2033
Figure 175: Asia Pacific Market Attractiveness by Type, 2023 to 2033
Figure 176: Asia Pacific Market Attractiveness by Power Source, 2023 to 2033
Figure 177: Asia Pacific Market Attractiveness by Pricing, 2023 to 2033
Figure 178: Asia Pacific Market Attractiveness by End User, 2023 to 2033
Figure 179: Asia Pacific Market Attractiveness by Application, 2023 to 2033
Figure 180: Asia Pacific Market Attractiveness by Country, 2023 to 2033
Figure 181: MEA Market Value (US$ Million) by Type, 2023 to 2033
Figure 182: MEA Market Value (US$ Million) by Power Source, 2023 to 2033
Figure 183: MEA Market Value (US$ Million) by Pricing, 2023 to 2033
Figure 184: MEA Market Value (US$ Million) by End User, 2023 to 2033
Figure 185: MEA Market Value (US$ Million) by Application, 2023 to 2033
Figure 186: MEA Market Value (US$ Million) by Country, 2023 to 2033
Figure 187: MEA Market Value (US$ Million) Analysis by Country, 2018 to 2033
Figure 188: MEA Market Volume (Units) Analysis by Country, 2018 to 2033
Figure 189: MEA Market Value Share (%) and BPS Analysis by Country, 2023 to 2033
Figure 190: MEA Market Y-o-Y Growth (%) Projections by Country, 2023 to 2033
Figure 191: MEA Market Value (US$ Million) Analysis by Type, 2018 to 2033
Figure 192: MEA Market Volume (Units) Analysis by Type, 2018 to 2033
Figure 193: MEA Market Value Share (%) and BPS Analysis by Type, 2023 to 2033
Figure 194: MEA Market Y-o-Y Growth (%) Projections by Type, 2023 to 2033
Figure 195: MEA Market Value (US$ Million) Analysis by Power Source, 2018 to 2033
Figure 196: MEA Market Volume (Units) Analysis by Power Source, 2018 to 2033
Figure 197: MEA Market Value Share (%) and BPS Analysis by Power Source, 2023 to 2033
Figure 198: MEA Market Y-o-Y Growth (%) Projections by Power Source, 2023 to 2033
Figure 199: MEA Market Value (US$ Million) Analysis by Pricing, 2018 to 2033
Figure 200: MEA Market Volume (Units) Analysis by Pricing, 2018 to 2033
Figure 201: MEA Market Value Share (%) and BPS Analysis by Pricing, 2023 to 2033
Figure 202: MEA Market Y-o-Y Growth (%) Projections by Pricing, 2023 to 2033
Figure 203: MEA Market Value (US$ Million) Analysis by End User, 2018 to 2033
Figure 204: MEA Market Volume (Units) Analysis by End User, 2018 to 2033
Figure 205: MEA Market Value Share (%) and BPS Analysis by End User, 2023 to 2033
Figure 206: MEA Market Y-o-Y Growth (%) Projections by End User, 2023 to 2033
Figure 207: MEA Market Value (US$ Million) Analysis by Application, 2018 to 2033
Figure 208: MEA Market Volume (Units) Analysis by Application, 2018 to 2033
Figure 209: MEA Market Value Share (%) and BPS Analysis by Application, 2023 to 2033
Figure 210: MEA Market Y-o-Y Growth (%) Projections by Application, 2023 to 2033
Figure 211: MEA Market Attractiveness by Type, 2023 to 2033
Figure 212: MEA Market Attractiveness by Power Source, 2023 to 2033
Figure 213: MEA Market Attractiveness by Pricing, 2023 to 2033
Figure 214: MEA Market Attractiveness by End User, 2023 to 2033
Figure 215: MEA Market Attractiveness by Application, 2023 to 2033
Figure 216: MEA Market Attractiveness by Country, 2023 to 2033
North America generates a CAGR of 40% of the global demand in 2023.
The Asia Pacific market is projected to expand market growth in 2023.
The LPG range is projected to expand significantly at a value of 55% through 2033.
From 2017 to 2022, the global market exhibited a 4.5% CAGR.
Gas ranges for commercial restaurants are dominant in the market.
Explore Commercial Cooking Equipment & Appliances Insights
Thank you!
You will receive an email from our Business Development Manager. Please be sure to check your SPAM/JUNK folder too.