The Commercial Oven Market is estimated to be valued at USD 13.6 billion in 2025 and is projected to reach USD 28.0 billion by 2035, registering a compound annual growth rate (CAGR) of 7.5% over the forecast period.
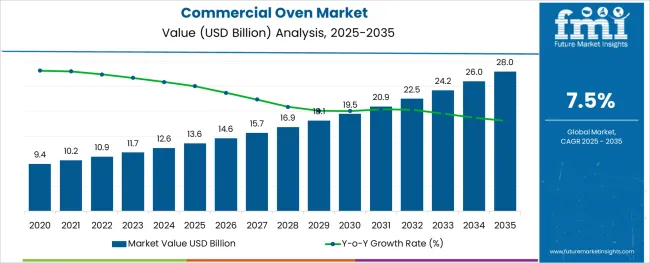
The commercial oven market is undergoing consistent growth driven by rising demand for efficient, energy-conscious, and versatile cooking equipment in the foodservice industry. Increasing consumer expectations for quality and consistency in food preparation have encouraged professional kitchens to upgrade to advanced ovens offering precise temperature control, even heat distribution, and faster cooking times.
Regulatory emphasis on energy efficiency standards and the ongoing shift toward electrification in commercial kitchens are also supporting the adoption of modern ovens. Technological advancements in insulation materials, digital controls, and multifunctional designs are paving the way for broader adoption across diverse foodservice establishments.
Future opportunities are expected to emerge from innovations in compact formats, connectivity features for remote monitoring, and growing investments in quick service and cloud kitchens that prioritize operational efficiency and sustainability.
The market is segmented by Product Type, End Use, Type, Nature, and Distribution Channel and region. By Product Type, the market is divided into Convection Ovens, Deck Ovens, Brick Oven, and Conveyor Oven. In terms of End Use, the market is classified into Restaurants, Hotels, Bakeries, Food Processing, and Others. Based on Type, the market is segmented into Electric and Gas. By Nature, the market is divided into Conventional Commercial Oven and Smart Commercial Oven. By Distribution Channel, the market is segmented into B to B, Hypermarket/Supermarket, B to C, Online Retail, Specialty Stores, and Others. Regionally, the market is classified into North America, Latin America, Western Europe, Eastern Europe, Balkan & Baltic Countries, Russia & Belarus, Central Asia, East Asia, South Asia & Pacific, and the Middle East & Africa.
The market is segmented by Product Type, End Use, Type, Nature, and Distribution Channel and region. By Product Type, the market is divided into Convection Ovens, Deck Ovens, Brick Oven, and Conveyor Oven. In terms of End Use, the market is classified into Restaurants, Hotels, Bakeries, Food Processing, and Others. Based on Type, the market is segmented into Electric and Gas. By Nature, the market is divided into Conventional Commercial Oven and Smart Commercial Oven. By Distribution Channel, the market is segmented into B to B, Hypermarket/Supermarket, B to C, Online Retail, Specialty Stores, and Others. Regionally, the market is classified into North America, Latin America, Western Europe, Eastern Europe, Balkan & Baltic Countries, Russia & Belarus, Central Asia, East Asia, South Asia & Pacific, and the Middle East & Africa.
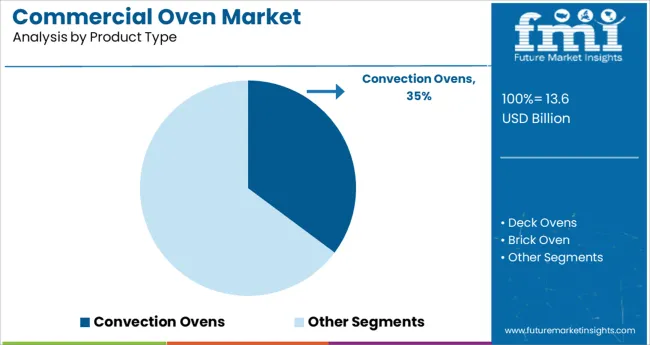
When segmented by product type, the convection ovens segment is expected to hold 35.2 % of the total market revenue in 2025, making it the leading product type. This leadership has been shaped by the ability of convection ovens to deliver uniform heat distribution, reduce cooking time, and enhance food quality, which have become critical criteria in high-volume foodservice settings.
The segment has benefited from its adaptability to a variety of cooking methods and its lower energy consumption compared to traditional radiant ovens. The adoption of convection ovens has also been bolstered by their reliability and cost-effectiveness, as kitchens seek durable equipment that minimizes downtime while meeting production demands.
The versatility to handle a range of menu items efficiently has further reinforced its dominance in professional kitchens prioritizing productivity and consistency.
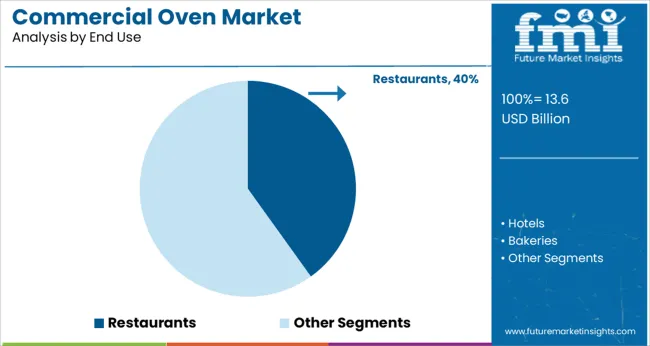
Segmented by end use, restaurants are projected to capture 40.1% of the commercial oven market revenue in 2025, maintaining their leading position. This prominence has been driven by restaurants’ high throughput requirements and the necessity to deliver consistent food quality under time constraints.
Investments in modern ovens by restaurants have been motivated by the need to meet rising customer expectations, improve energy efficiency, and optimize kitchen workflows. The restaurant segment has also demonstrated faster adoption of advanced ovens owing to competitive pressures to enhance service speed and diversify menus.
The ability to integrate ovens with other kitchen technologies and align with sustainability initiatives has made them an indispensable asset in restaurant operations, further solidifying their position as the top end-use segment.
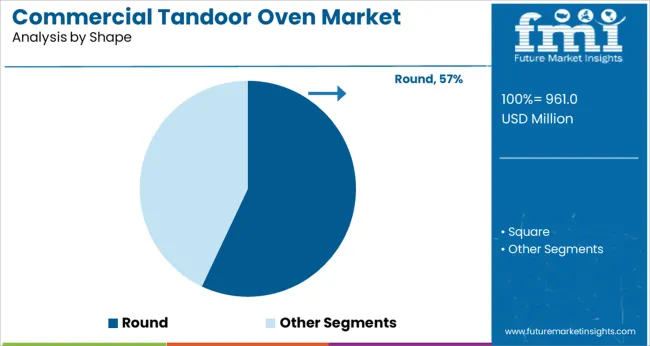
When segmented by type, electric ovens are forecast to account for 57.8% of the market revenue in 2025, establishing themselves as the dominant type segment. This leadership has been reinforced by the global trend toward electrification, driven by environmental considerations and the push to reduce reliance on fossil fuels in commercial kitchens.
Electric ovens have been preferred due to their ease of installation, greater control over temperature settings, and enhanced safety compared to gas counterparts. Advancements in electric heating elements, coupled with declining operational costs through improved energy efficiency, have encouraged widespread adoption.
The segment’s dominance has also been supported by regulatory incentives and compliance requirements favoring electric appliances, positioning electric ovens as the standard choice in modern foodservice environments focused on sustainability and performance.
Modern commercial ovens include inbuilt memory systems that can store up to 100 recipe settings and are highly programmable. These ovens are easier to operate and more accessible for staff and employees thanks to their digital displays, which enable users to quickly explore different choices and set settings. For commercial food service outlets like restaurants, cafés, takeaways, etc., commercial ovens are adaptable and provide faster and more efficient cooking alternatives. Due to their advantageous usage in food reheating, rapid defrosting, and a multitude of cooking choices, these machines are ideally suited for large-scale food businesses
Online food ordering services like Zomato and Swiggy, which also allow customers to receive discounts, have been a major factor in the rise in demand for commercial ovens and43qzqa the expansion of the industry. The commercial oven is divided into grillers of various varieties, convection ovens, and single ovens. Most restaurants and bakeries use conventional ovens for heating purposes because they evenly disperse heat throughout the oven. As opposed to a single oven, which cannot be utilized for baking or grilling. As a result, many hotels favor various types of ovens depending on how they need to prepare their meals.
Some of the factors anticipated to be opportunistic for commercial ovens manufacturers
| Attribute | Details |
|---|---|
| Commercial Oven Market Estimated Size (2025) | USD 13.6 billion |
| Commercial Oven Market CAGR (2025 to 2035) | 7.5% |
| Commercial Oven Market Forecasted Size (2035) | USD 28.0 billion |
Sales of Commercial Ovens to be Driven by Consumer Demand for Energy-efficient Cooking Products
Commercial kitchens are significant energy consumers, using up to three times as much energy per square foot than most other commercial building types, including those found in full-service and quick-service restaurants, hotels, and hospitals. Since energy costs typically make up between 25% and 30% of the total operating costs for these facilities, upgrading equipment to be more energy-efficient can increase bottom-line revenues while also offering significant non-energy benefits, such as improved operating performance, more consistent cooking, and increased comfort for the kitchen staff.
There are many various types of commercial ovens on the market today that may be used to bake a variety of goods, including bread, muffins, loaves of cake, pizza, and other items. The demand for commercial ovens is predicted to rise due to the rising consumer demand for prepared or bakery food items and the quick expansion of bakeries throughout the world.
Since most people don't have as much time as they used to prepare a nice dinner, ready-to-eat foods are becoming more popular. Moreover, as these foods need to be heated to be prepared, ready-to-eat foods are one of the main drivers of industry expansion. The market's expansion may benefit greatly from the rising rate of use of portable ovens. Since the portable oven can perform as well as a regular one, has a long battery life, and is more affordable, it may be in higher demand, which is likely to help the market grow.
Commercial ovens have certain drawbacks, such as quick heating, which frequently results in overdone food, inadequate container ventilation, and uneven cooking, which results in chilly areas. Such elements are anticipated to limit the demand for commercial ovens. Furthermore, the high cost of oven maintenance and the high cost of commercial ovens may also limit market expansion. However, there is likely to be a huge potential for market expansion due to the rising demand for commercial ovens for a variety of applications, but there may also be difficulty due to the fierce rivalry among market competitors.
Around 36.9% of the market share is anticipated to be held by the food processing segment in 2035, and it is anticipated that this segment would expand significantly over the forecast period. The choice for vent-free ovens to produce and process food is predicted to expand throughout the forecast period, propelling the industrial oven market.
Several high-tech industries, including electronics and chemicals, benefit from the strategic use of commercial ovens. It is used to bake sand cores in foundries to create contemporary castings, cure exotic materials in laboratories to process ultra-light and super-strong materials, preheat metals and other materials for anti-corrosion coatings, and serve as diffusion furnaces for semiconductors used in computers.
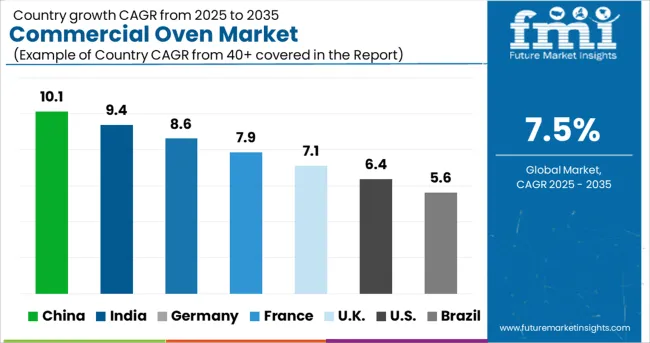
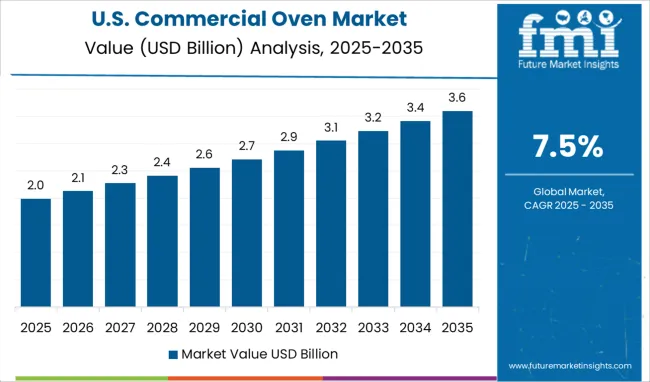
With almost 22% of the market share in terms of sales in 2025, the USA is predicted to dominate the commercial ovens market. The USA is anticipated to be the most profitable market for commercial ovens in North America and is anticipated to account for a sizable value share in 2025. IoT-enabled kitchen appliances are increasing people's preference for smart home products like smart ovens. Additionally, Manufacturers are creating cutting-edge devices like smart ovens that work with cell phones. Furthermore, throughout the projected period, sales of commercial ovens in the USA are anticipated to soar due to rising internet penetration and rising wireless technology usage.
Germany is expected to be one of the most profitable markets for commercial ovens registering a market share of 6.2% during the forecast period. The growth of the oven market is being supported by Germany's high demand for commercial ovens and the rapid increase in industrial capacity.
Furthermore, UK commercial oven market is anticipated to grow at a considerable CAGR of 5.3% during the forecast period. The UK government wants to stabilize the market and boost competition by enforcing regulations on industrial limits. As a result, both major and small businesses are creating technologically cutting-edge items to obtain an advantage in the market. The sales of commercial ovens are anticipated to increase as a result.
The Korean commercial ovens market is expected to grow at a CAGR of 2.3% between 2025 and 2035. Korea has a moderate regional market share in the commercial oven sector. Due to its favorable government laws and growing environmental concerns, the region is using electric commercial ovens more frequently, which is responsible for the increased market share. Due to the region's growing industrialization and urbanization, South Korea is also anticipated to provide market development with additional potential opportunities.
Japan is anticipated to gain a share of 3.3% in the commercial oven market. Due to its fast industrialization, expanding industry base, and advancements in the electric and electronic sectors, Japan's commercial oven market comes under the list of high-potential markets. Technology development and a rise in product innovation are two major drivers boosting the market growth in the region.
The region's thriving food and hotel sectors, the quickly growing food service sector, the rise in food service outlets, and several positive factors are all associated with the market expansion. Due to consumers' increased propensity to spend more money on high-quality kitchen electrical products, the demand for and popularity of commercial ovens may rise overall.
Start-ups in the commercial oven market are concentrating on creating cutting-edge appliances to increase their market share and diversify their product offerings. For instance, Blodgett Corporation introduced their freestanding ventless convection oven with touchscreen controls in February 2024 for fast-casual restaurants, institutional kitchens, hospital cafeterias, and other food service facilities. The firm is concentrating on growing its product line in the energy-efficient appliances category with the introduction of this commercial kitchen equipment since ventless cooking uses less energy and has reduced maintenance and installation costs.
Lucrativeness of the Commercial Oven Industry Encouraging Companies Like Whirlpool Corp. to Boost Investments in Related Product Lines
A large number of manufacturers of the commercial oven are concentrating on strategic alliances and mergers & acquisitions to outperform their rivals and increase their reach among end users. For instance, PartsXpress, the provider of food service and commercial appliance components for Smart Care Equipment Solutions, was bought by Parts Town, a USA-based distributor of commercial food service equipment. For instance, the commercial oven, dishwasher, and ice maker were introduced by Whirlpool Corporation, one of the major participants in the commercial oven market. With its entry into the commercial sector, the business, which already commands a 5.0% revenue share in the entire market for a commercial oven, hopes to further diversify its product offering.
The manufacturing of commercial ovens with automatic timers for effective cooking operations is becoming a growing area of attention for manufacturers, which is very beneficial for the market's expansion. Other significant drivers of market expansion are the growing demand for catering services for social events and seminars, rising living standards, rising disposable incomes, rapid urbanization, and the growing working population and their busy work schedules.
In addition, boosting the manufacturing of frozen food items serves as one of the driving forces behind rising product demand. As frozen food products are often not intended to be consumed without first being defrosted and heated, an oven comes into play here because it can quickly rewarm meals. Consequently, the market growth is greatly influenced by frozen food products.
Smart ovens that use radiofrequency technology to heat, bake, boil, and steam food have grown more appealing to customers and are likely to drive market expansion. The demand for commercial ovens is anticipated to rise as a result of the rapid growth of IoT ovens, which have the potential to link with smartphones and the internet and allow users to alter cooking settings.
One of the key factors boosting the market growth for commercial ovens is the growing trend of ready-to-eat meals. The British Journal on Nutrition claims that consuming prepared foods like pre-packaged meals, dining at fast food establishments, and shopping at convenience stores is a habit connected to the contemporary fast-paced lifestyle.
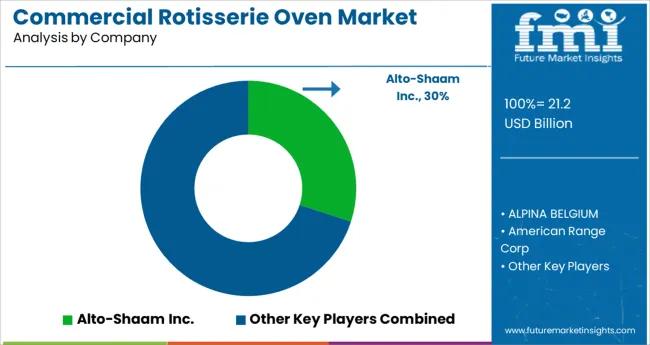
To survive the fierce market rivalry, major corporations have employed methods including mergers, product launches, growth, and agreements. Few major players currently control the majority of the industry in terms of market share. Mid-sized and smaller businesses are, however, expanding their market presence by gaining new partnerships and tapping into new markets thanks to technical improvements and product innovations.
Recent Developments in the Market
| Attribute | Details |
|---|---|
| Growth Rate | CAGR of 7.5% from 2025 to 2035 |
| Base Year of Estimation | 2025 |
| Historical Data | 2020 to 2025 |
| Forecast Period | 2025 to 2035 |
| Quantitative Units | Revenue in million and Volume in Units and F-CAGR from 2025 to 2035 |
| Report Coverage | Revenue Forecast, Volume Forecast, Company Ranking, Competitive Landscape, growth factors, Trends, and Pricing Analysis |
| Key Segments Covered | By Product Type, By End Use, By Type, By Nature, By Distribution Channel, By Region |
| Regions Covered | North America; Latin America; Europe; East Asia; South Asia; Middle East & Africa; Oceania |
| Key Countries Profiled | The USA, Canada, Brazil, Mexico, Germany, Italy, France, The UK, Spain, Russia, China, Japan, India, GCC Countries, Australia |
| Key Companies Profiled | Duke Manufacturing; Admiral Craft Equipment; Alto-Shaam; Montague; Moffat Group; BKI; Merrychef; Cadco; Machinery Point; HEATING TOOLS & SYSTEMS; Safire Industries; Jomind; Orange Foodstuff Equipment Pvt. Ltd; Rehan Engineering; LEWCO; HeatTek, Inc.; TurboChef Technologies; Toastmaster; American Range; Garland Group; Hadala Kitchen |
| Customization & Pricing | Available upon Request |
The global commercial oven market is estimated to be valued at USD 13.6 billion in 2025.
It is projected to reach USD 28.0 billion by 2035.
The market is expected to grow at a 7.5% CAGR between 2025 and 2035.
The key product types are convection ovens, deck ovens, brick oven and conveyor oven.
restaurants segment is expected to dominate with a 40.1% industry share in 2025.


Full Research Suite comprises of:
Market outlook & trends analysis
Interviews & case studies
Strategic recommendations
Vendor profiles & capabilities analysis
5-year forecasts
8 regions and 60+ country-level data splits
Market segment data splits
12 months of continuous data updates
DELIVERED AS:
PDF EXCEL ONLINE
Commercial Oven for Bakery Market Size and Share Forecast Outlook 2025 to 2035
Commercial Pizza Oven Market Size and Share Forecast Outlook 2025 to 2035
Commercial Combi Oven Market – Versatile Cooking Innovation 2025-2035
Commercial Tandoor Oven Market Size and Share Forecast Outlook 2025 to 2035
Commercial Air Fryer Oven Market Size and Share Forecast Outlook 2025 to 2035
Commercial Microwave Ovens Market Analysis – Size, Share, and Forecast 2025 to 2035
Commercial High-Speed Oven Market Size and Share Forecast Outlook 2025 to 2035
Commercial Convection Ovens Market Size and Share Forecast Outlook 2025 to 2035
Commercial Rotisserie Oven Market Size and Share Forecast Outlook 2025 to 2035
Commercial Blast Freezer Market Size and Share Forecast Outlook 2025 to 2035
Commercial Water Heater Market Size and Share Forecast Outlook 2025 to 2035
Commercial Turboprop Aircrafts Market Size and Share Forecast Outlook 2025 to 2035
Commercial Vehicle Foundation Brakes Market Size and Share Forecast Outlook 2025 to 2035
Commercial Vehicle Brake Chambers Market Size and Share Forecast Outlook 2025 to 2035
Commercial Vehicles LED Bar Lights Market Size and Share Forecast Outlook 2025 to 2035
Commercial Vehicle AMT Transmission Market Size and Share Forecast Outlook 2025 to 2035
Commercial Greenhouse Market Size and Share Forecast Outlook 2025 to 2035
Commercial Vessel Market Size and Share Forecast Outlook 2025 to 2035
Commercial Slush Machine Market Size and Share Forecast Outlook 2025 to 2035
Commercial Medium Voltage Distribution Panel Market Size and Share Forecast Outlook 2025 to 2035

Thank you!
You will receive an email from our Business Development Manager. Please be sure to check your SPAM/JUNK folder too.
Chat With
MaRIA