Reports

- Global Locations -

Headquarters

Future Market Insights, Inc.

Christiana Corporate, 200
Continental Drive, Suite 401,
Newark, Delaware - 19713,
United States

T: +1-845-579-5705

Americas

Future Market Insights, Inc.

616 Corporate Way, Suite 2-9018,
Valley Cottage, NY 10989, United States

T: +1-347-918-3531

MEA

Future Market Insights

1602-6 Jumeirah Bay X2 Tower, Plot No: JLT-PH2-X2A,
Jumeirah Lakes Towers, Dubai,
United Arab Emirates

Europe

Future Market Insights

3rd Floor, 207 Regent Street,
W1B 3HH London
United Kingdom

T: + 44 (0) 20 8123 9659
D: +44 (0) 20 3287 4268

Asia Pacific

Future Market Insights

IndiaLand Global Tech Park, Unit UG-1, Behind Grand HighStreet, Phase 1, Hinjawadi, MH, Pune – 411057, India

Commercial Air Fryer Oven Market Outlook (2023 to 2033)

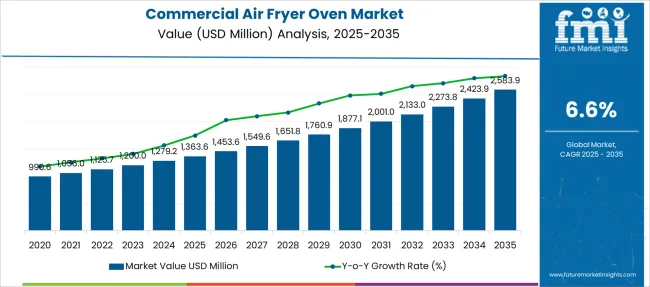
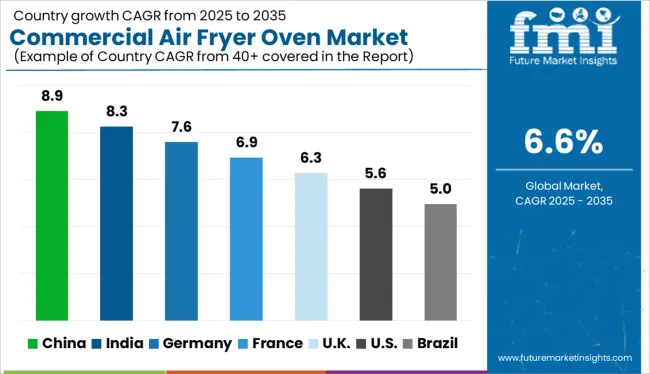
The commercial air fryer oven market is anticipated to increase, from US$ 1,200 million in 2023 to US$ 2,273.8 million in 2033. According to FMI, the market is expected to expand at a CAGR of 6.6%.

The global commercial air fryer oven market is expanding rapidly due to businesses’ growing interest in air fryer ovens with multifunctional features. In contrast to conventional deep fryers, air fryers have multiple uses, including deep frying, skillet cooking, air roasting, baking, broiling, and toasting. This versatility has drawn a sizable home customer base and increased the overall market share.

More companies are inclining towards offering more advanced commercial air fryer ovens with different cooking modes to cater to residential demand as well. For instance, in 2021, EPEIOS launched the latest model EPEIOS CP247A of its Epicure+ Air Fryer Oven series. This air fryer is highly functional and comes with a larger capacity, such as an oven.

Moreover, the EPEIOS CP247A air fryer is launched with 6 functions, such as air frying, oven, bread toaster, food dryer, defrost, and dough proofing. It is also equipped with a dual heating mode, which lets the user choose between top and bottom heating based on the food.

Commercial air fryer oven makers are developing air fryers that produce healthier ways to prepare deep-fried foods, rather than displacing traditional, healthy methods of preparing food, such as boiling and grilling.

The adoption of production tools based on cutting-edge technology in response to the demand for air-fried food products is predicted to boost the demand for commercial air fryer ovens worldwide over the estimated period. For instance, Philips released the Philips Airfryer XXL in 2019 with Smart Sensing technology, which makes cooking easier.

The adoption of the commercial air fryer oven market is being driven by the increasing innovation in new product performance coupled with superior design. Additionally, the gastronomy sector is expected to increase, and there are many air fryers available on various internet platforms, including social media.

The sales of commercial air fryer ovens are being pushed by the increase in global food consumption, as well as the expansion of the food processing sector. As the food processing industry develops, food processing technology improves, and consumer demand for processed foods increases, the commercial air fryer oven market share is anticipated to expand.

Attributes Details
Commercial Air Fryer Oven Market Size Value in 2023 US$ 1,200.0 Million
Commercial Air Fryer Oven Market Forecast Value in 2033 US$ 2,273.8 Million
Commercial Air Fryer Oven Market Global Growth Rate 2023 to 2033 6.6%
Commercial Air Fryer Oven Market Share of India in South Asia 26%

Don't pay for what you don't need

Customize your report by selecting specific countries or regions and save 30%!

Commercial Air Fryer Oven Market Matures With Healthy, Practical Meals

Air fryers have lately gained popularity due to the enduring desire for fried foods and rising health concerns. More potatoes are consumed in America than any other vegetable, and 40% of the market is made up of frozen foods like French fries.

The growth of nuclear families, which promotes the consumption of nutritious foods and changes in lifestyle and customer preferences, is another factor boosting demand for commercial air fryer oven.

The need for new, innovative, and technologically sophisticated products is also expected to increase, and consumers' preference for less-oily, healthier meals is likely to fuel the market's expansion over the forecast period.

Commercial air fryer ovens promote their product as a way to prepare and consume fried meals without the negative health impacts of fried food. To address the increased demand for healthy functional meals and drinks, manufacturers are expected to invest in revolutionary technology. T

The rise in food production capacity and the food processing industry in emerging economies is likely to boost the growth of the commercial air fryer oven market.

Commercial Air Fryer Oven Market

Deep-dive into Growth Drivers Impacting Commercial Air Fryer Oven Market

Some people are dubious about the alleged health benefits of air-fried foods, while others are cautious about the potential health risks of using this unique method of cooking, primarily as they are concerned about toxicity and cancer. High initial investment costs and rising manufacturing expenses as a result of rising energy and labor costs impede commercial air fryer oven market expansion.

Continuous improvements in product performance are driving up the cost of the finished product, and the availability of substitute products at low prices is anticipated to limit the commercial air fryer oven market growth.

Additionally, the longer cooking times of air fryers that result in higher energy and electricity usage are hampering the demand for commercial air fryer ovens. Additionally, an air fryer takes at least 20 to 25 minutes, compared to 10 to 12 minutes for a standard fryer. Therefore, it is anticipated that these factors are likely to restrain market expansion throughout the upcoming years.
Nandini Roy Choudhury

Principal Consultant

Talk to Analyst

Find your sweet spots for generating winning opportunities in this market.

Comparative View of Adjacent Commercial Air Fryer Oven Market

Commercial Air Fryer Oven Market:

Attributes Commercial Air Fryer Oven Market
CAGR (2023 to 2033) 6.6%
Market Value (2033) US$ 2,273.8 million
Growth Factor Demand increases as a result of changes in lifestyle and consumer preferences, as well as the consumption of healthy meals.
Opportunity The need for commercial air fryer ovens is anticipated to increase due to the adoption of production tools based on cutting-edge technology in response to the demand for air-fried culinary products.
Key Trends Demand for new, innovative, and technologically sophisticated products is expected to increase, giving new prospects to manufacturers.

Air Fryer Market:

Attributes Air Fryer Market
CAGR (2023 to 2033) 7.3%
Market Value (2033) US$ 2142.97 million
Growth Factor Increased adoption as a result of improvements to features like touchpads, intelligent sensors, and LED screens
Opportunity Social media, blogs, and websites that promote low- or no-oil diets and their benefits are becoming more and more prevalent, offering market players new opportunities.
Key Trends Leading companies are raising demand from residential demographics and piquing consumer interest through extensive marketing and advertising campaigns.

Oven Market:

Attributes Oven Market
CAGR (2023 to 2033) 4.9%
Market Value (2033) US$ 4741.38 million
Growth Factor Demand is expanding as a result of rising sales of smart kitchen appliances and the rising need for fresh and ready-to-eat foods.
Opportunity New potential in the market can be seen as a result of growing urbanization and the development of the hospitality sector.
Key Trends Growing consumer demand for user-friendly, energy-efficient ovens is pushing manufacturers to create new features.

Country-wise Insights

Renowned Manufacturers are Shaping the USA Commercial Air Fryer Oven Market

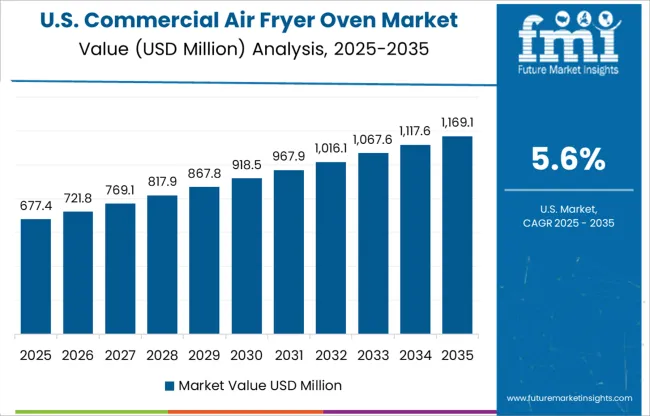
Switching to air-fried dishes from deep-fried ones and regularly consuming fewer harmful oils can also help with weight loss. The USA commercial air fryer oven market is therefore anticipated to reach USD 310.1 million in 2023 due to its adaptability.

Sales are being boosted by consumers' growing acceptance of modular design and smart kitchen appliances. Additionally, manufacturers are pushing for improved market access and increased investment in Research and Development (R&D).

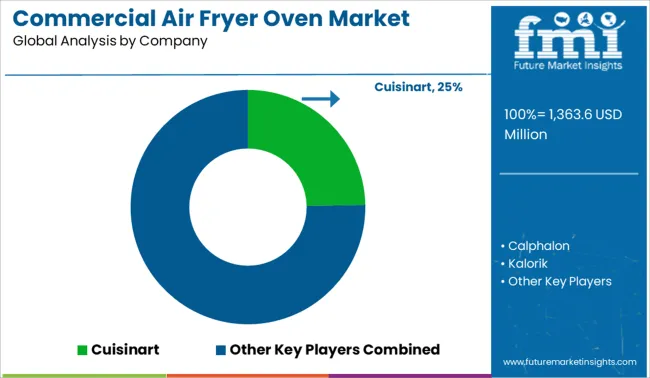
The USA market is somewhat consolidated, with the bulk of commercial air fryer oven market share going to well-established, internationally renowned manufacturers, with the exception of Tier 2 businesses and start-ups, who provide a greater variety of product choices.
How Germany’s Economic Stability Makes Europe a Leader in the Commercial Air Fryer Oven Market?

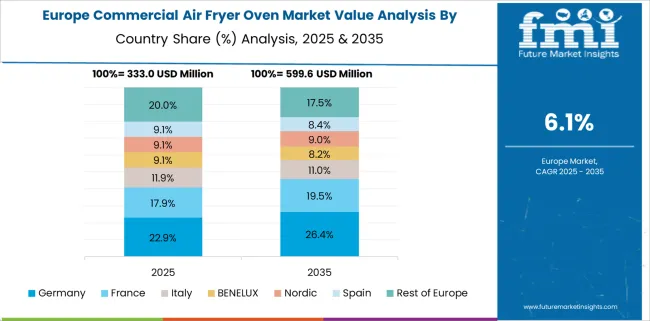
By 2033, Europe is anticipated to have the biggest market share, at 40%. The most influential local market in Europe is Germany. Consumer health awareness is rising, online usage is expanding, and easy financing options, together with specials and promotions from major e-retailers, are all contributing to the increase in sales of commercial air fryer ovens.

Furthermore, it is anticipated that the presence of well-known producers like Philips, Ninja, and Prestige is likely to increase demand for commercial air fryer oven in Germany.

Due to its developing economy, expanding industrial base of food processing services driven by rapid urbanization, and rising demand for convenience food, which is fueled by customers' soaring disposable income and spending power of convenient yet healthy and less oily food, the German market is witnessing notable progress.

Commercial Air Fryer Oven Sales in Asia Pacific are Tempted By the Region's Focus on Innovation

Country Innovations
Korea Although the general elements of commercial air fryer ovens remain the same. But manufacturers are still concentrating on innovation and customization. For instance:
  • The Philips Air Fryer is available in a stylish black hue with a red accent on the front, and functions as both an oven and an air fryer.
  • A timer on the Daewoo Digital Air Fryer, which costs about KRW 60,000, lets you know when your food is finished frying.
China The commercial air fryer oven market is likely to expand as a result of an increase in the domestic use of air fryers due to China's availability of low-cost goods and customers' increased disposable incomes.

Get the data you need at a Fraction of the cost

Personalize your report by choosing insights you need
and save 40%!

Category-wise Outlook

Digital Commercial Air Fryer Oven-Creating Fresh Opportunities for Manufacturers

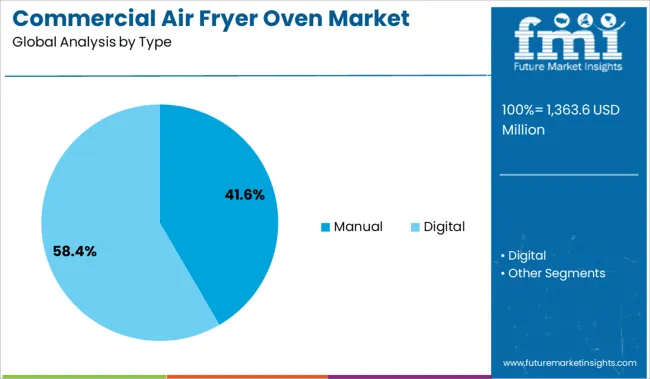
Digital commercial air fryer ovens are leading the market value and are expected to grow with more than 4.5% CAGR over the forecast period. The preference of consumers for digital commercial air fryers over manual air fryers has mostly changed as a result of time savings, high cooking capabilities, and consistency in flavor and texture.

As a result, digital commercial air fryers are quickly increasing their market share, and manufacturers have been concentrating on making products that are trendy and have modern features.

According to Capacity, Which Segment of the Commercial Air Fryer Oven Market Generates the Largest Sales Revenue?

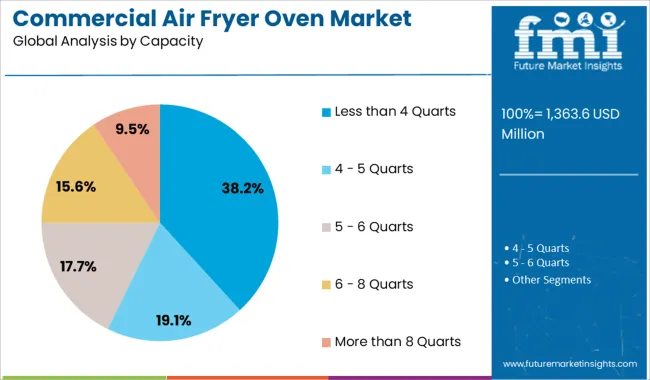
Commercial air fryer ovens with a capacity of more than 8 quarts hold the majority of the market share. This is because air fryers retain heat rather than increasing the temperature of the kitchen area like a regular oven does, which saves a lot of space for the food service and food processing industries and maintains the ambient temperature at a comfortable level.
Synopsis of Competition Scenario of Commercial Air Fryer Oven Market

Active commercial air fryer oven market participants have been able to survive in the fiercely competitive consumer-centric industry due to ongoing improvements in product performance and functionality, as well as ongoing consumer input.

Recent Development

  • Xiaomi released the MIJIA Smart Air Fryer 3.5 L in March 2021. It costs 399 Yuan and has other uses as an oven, microwave, yogurt maker, and fruit press.
  • Major US players are leaning toward launching small, technologically advanced items to meet this need.
    • Proluxury (ecLiving) introduced a line of multipurpose air fryers in November 2020. The Proluxury air fryer has eight cooking settings and can cook fried meals without oil to cut down on the fat content.

Key Players

  • Cuisinart
  • Calphalon
  • Kalorik
  • Black & Decker
  • Havells
  • Brava Home
  • Ninja Kitchen
  • Hamilton Beach Brands
  • COSORI
  • Breville
  • Philips
  • GoWISE
  • Inalsa
  • KENT

Scope of the Report

Attribute Details
Forecast Period 2023 to 2033
Historical Data Available for 2017 to 2022
Market Analysis USD Million for Value and Units for Volume
Key Regions Covered North America, Latin America, Europe, Asia Pacific, Oceania, and MEA
Key Countries Covered USA, Canada, Mexico, Germany, United Kingdom, France, Italy, Spain, China, Japan, India, South Korea, Australia, Brazil, Argentina, South Africa, and UAE
Key Segments Covered
  • Product Type
  • Wattage
  • Capacity
  • Region
Key Companies Profiled
  • Cuisinart
  • Calphalon
  • Kalorik
  • Black & Decker
  • Havells
  • Brava Home
  • Ninja Kitchen
  • Hamilton Beach Brands
  • COSORI
  • Breville
  • Philips
  • GoWISE
  • Inalsa
  • KENT
Report Coverage Market Forecast, Company Share Analysis, Competition Intelligence, DROT Analysis, Market Dynamics and Challenges, and Strategic Growth Initiatives
Customization & Pricing Available upon Request

Commercial Air Fryer Oven Market by Category

By Type:

  • Manual
  • Digital

By Wattage:

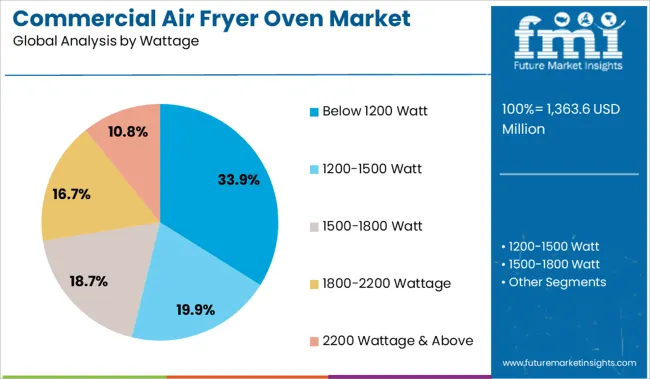
  • Below 1200 Watt
  • 1200-1500 Watt
  • 1500-1800 Watt
  • 1800-2200 Wattage
  • 2200 Wattage & Above

By Capacity:

  • Less than 4 Quarts
  • 4 - 5 Quarts
  • 5 - 6 Quarts
  • 6 - 8 Quarts
  • More than 8 Quarts

By Region:

  • North America
  • Latin America
  • Europe
  • East Asia
  • South Asia
  • Oceania
  • Middle East & Africa

Frequently Asked Questions

How Big is the Commercial Air Fryer Oven Market?

The commercial air fryer oven market is estimated to have a value of USD 1,200.0 million in 2023.

What is the North America Commercial Air Fryer Oven Market Outlook?

The North America commercial air fryer oven is expected to register a 4.0% CAGR by 2033.

What is the Historical Outlook of the Commercial Air Fryer Oven Market?

In terms of sales, commercial air fryer ovens expanded at a CAGR of around 3.7% from 2017 to 2022.

What is the Demand Outlook for the Commercial Air Fryer Oven Market?

The global commercial air fryer oven market is expected to be worth US$ 2,273.8 million by 2033.

What is the Europe Outlook for the Commercial Air Fryer Oven Market?

Europe holds around 40.0% of the total commercial air fryer oven revenue share.

Table of Content

1. Executive Summary | Commercial Air Fryer Oven Market

    1.1. Global Market Outlook

    1.2. Demand-side Trends

    1.3. Supply-side Trends

    1.4. Technology Roadmap Analysis

    1.5. Analysis and Recommendations

2. Market Overview

    2.1. Market Coverage / Taxonomy

    2.2. Market Definition / Scope / Limitations

3. Market Background

    3.1. Market Dynamics

        3.1.1. Drivers

        3.1.2. Restraints

        3.1.3. Opportunity

        3.1.4. Trends

    3.2. Scenario Forecast

        3.2.1. Demand in Optimistic Scenario

        3.2.2. Demand in Likely Scenario

        3.2.3. Demand in Conservative Scenario

    3.3. Product launches & Recent Developments

    3.4. Product Life Cycle Analysis

    3.5. Value Chain Analysis

        3.5.1. Supply Side Participants and their Roles

            3.5.1.1. Producers

            3.5.1.2. Mid-Level Participants (Traders/ Agents/ Brokers)

            3.5.1.3. Wholesalers and Distributors

        3.5.2. % of Operating Margin Analysis

        3.5.3. List of Existing and Potential Buyer’s

    3.6. Global Market - Pricing Analysis

        3.6.1. Price Point Assessment by Region

        3.6.2. Price Point Assessment by Product Type

        3.6.3. Price Forecast till 2032

        3.6.4. Factors affecting pricing

    3.7. Forecast Factors - Relevance & Impact

    3.8. PESTLE and Porter’s Analysis

    3.9. Regulatory Landscape

    3.10. Regional Parent Market Outlook

    3.11. Production and Consumption Statistics

    3.12. Import and Export Statistics

    3.13. Consumers Survey Analysis

    3.14. Macro-Economic Factors

4. Global Market Analysis 2018 to 2022 and Forecast, 2023 to 2033

    4.1. Historical Market Size Value (US$ million) & Volume (Unit) Analysis, 2018 to 2022

    4.2. Current and Future Market Size Value (US$ million) & Volume (Unit) Projections, 2023 to 2033

        4.2.1. Y-o-Y Growth Trend Analysis

        4.2.2. Absolute $ Opportunity Analysis

5. Global Market Analysis 2018 to 2022 and Forecast 2023 to 2033, By Product Type

    5.1. Introduction / Key Findings

    5.2. Historical Market Size Value (US$ million) & Volume (Unit) Analysis By Product Type, 2018 to 2022

    5.3. Current and Future Market Size Value (US$ million) & Volume (Unit) Analysis and Forecast By Product Type, 2023 to 2033

        5.3.1. Manual

        5.3.2. Digital

    5.4. Y-o-Y Growth Trend Analysis By Product Type, 2018 to 2022

    5.5. Absolute $ Opportunity Analysis By Product Type, 2023 to 2033

6. Global Market Analysis 2018 to 2022 and Forecast 2023 to 2033, By Wattage

    6.1. Introduction / Key Findings

    6.2. Historical Market Size Value (US$ million) & Volume (Unit) Analysis By Wattage, 2018 to 2022

    6.3. Current and Future Market Size Value (US$ million) & Volume (Unit) Analysis and Forecast By Wattage, 2023 to 2033

        6.3.1. Below 1200 Watt

        6.3.2. 1200-1500 Watt

        6.3.3. 1500-1800 Watt

        6.3.4. 1800-2200 Wattage

        6.3.5. 2200 Wattage & Above

    6.4. Y-o-Y Growth Trend Analysis By Wattage, 2018 to 2022

    6.5. Absolute $ Opportunity Analysis By Wattage, 2023 to 2033

7. Global Market Analysis 2018 to 2022 and Forecast 2023 to 2033, By Capacity

    7.1. Introduction / Key Findings

    7.2. Historical Market Size Value (US$ million) & Volume (Unit) Analysis By Capacity, 2018 to 2022

    7.3. Current and Future Market Size Value (US$ million) & Volume (Unit) Analysis and Forecast By Capacity, 2023 to 2033

        7.3.1. Less than 4 Quarts

        7.3.2. 4 - 5 Quarts

        7.3.3. 5- 6 Quarts

        7.3.4. 6 - 8 Quarts

        7.3.5. more than 8 Quarts

    7.4. Y-o-Y Growth Trend Analysis By Capacity, 2018 to 2022

    7.5. Absolute $ Opportunity Analysis By Capacity, 2023 to 2033

8. Global Market Analysis 2018 to 2022 and Forecast 2023 to 2033, By Region

    8.1. Introduction

    8.2. Historical Market Size Value (US$ million) & Volume (Unit) Analysis By Region, 2018 to 2022

    8.3. Current Market Size Value (US$ million) & Volume (Unit) Analysis and Forecast By Region, 2023 to 2033

        8.3.1. North America

        8.3.2. Latin America

        8.3.3. Europe

        8.3.4. East Asia

        8.3.5. South Asia

        8.3.6. Oceania

        8.3.7. Middle East and Africa (MEA)

    8.4. Market Attractiveness Analysis By Region

9. North America Market Analysis 2018 to 2022 and Forecast 2023 to 2033, By Country

    9.1. Historical Market Size Value (US$ million) & Volume (Unit) Trend Analysis By Market Taxonomy, 2018 to 2022

    9.2. Market Size Value (US$ million) & Volume (Unit) Forecast By Market Taxonomy, 2023 to 2033

        9.2.1. By Country

            9.2.1.1. USA

            9.2.1.2. Canada

        9.2.2. By Product Type

        9.2.3. By Wattage

        9.2.4. By Capacity

    9.3. Market Attractiveness Analysis

        9.3.1. By Country

        9.3.2. By Product Type

        9.3.3. By Wattage

        9.3.4. By Capacity

    9.4. Key Takeaways

10. Latin America Market Analysis 2018 to 2022 and Forecast 2023 to 2033, By Country

    10.1. Historical Market Size Value (US$ million) & Volume (Unit) Trend Analysis By Market Taxonomy, 2018 to 2022

    10.2. Market Size Value (US$ million) & Volume (Unit) Forecast By Market Taxonomy, 2023 to 2033

        10.2.1. By Country

            10.2.1.1. Brazil

            10.2.1.2. Mexico

            10.2.1.3. Argentina

            10.2.1.4. Chile

            10.2.1.5. Peru

            10.2.1.6. Rest of Latin America

        10.2.2. By Product Type

        10.2.3. By Wattage

        10.2.4. By Capacity

    10.3. Market Attractiveness Analysis

        10.3.1. By Country

        10.3.2. By Product Type

        10.3.3. By Wattage

        10.3.4. By Capacity

    10.4. Key Takeaways

11. Europe Market Analysis 2018 to 2022 and Forecast 2023 to 2033, By Country

    11.1. Historical Market Size Value (US$ million) & Volume (Unit) Trend Analysis By Market Taxonomy, 2018 to 2022

    11.2. Market Size Value (US$ million) & Volume (Unit) Forecast By Market Taxonomy, 2023 to 2033

        11.2.1. By Country

            11.2.1.1. Germany

            11.2.1.2. Italy

            11.2.1.3. France

            11.2.1.4. United Kingdom

            11.2.1.5. Spain

            11.2.1.6. Russia

            11.2.1.7. BENELUX

            11.2.1.8. Poland

            11.2.1.9. Nordic Countries

            11.2.1.10. Rest of Europe

        11.2.2. By Product Type

        11.2.3. By Wattage

        11.2.4. By Capacity

    11.3. Market Attractiveness Analysis

        11.3.1. By Country

        11.3.2. By Product Type

        11.3.3. By Wattage

        11.3.4. By Capacity

    11.4. Key Takeaways

12. East Asia Market Analysis 2018 to 2022 and Forecast 2023 to 2033, By Country

    12.1. Historical Market Size Value (US$ million) & Volume (Unit) Trend Analysis By Market Taxonomy, 2018 to 2022

    12.2. Market Size Value (US$ million) & Volume (Unit) Forecast By Market Taxonomy, 2023 to 2033

        12.2.1. By Country

            12.2.1.1. China

            12.2.1.2. Japan

            12.2.1.3. South Korea

        12.2.2. By Product Type

        12.2.3. By Wattage

        12.2.4. By Capacity

    12.3. Market Attractiveness Analysis

        12.3.1. By Country

        12.3.2. By Product Type

        12.3.3. By Wattage

        12.3.4. By Capacity

    12.4. Key Takeaways

13. South Asia Market Analysis 2018 to 2022 and Forecast 2023 to 2033, By Country

    13.1. Historical Market Size Value (US$ million) & Volume (Unit) Trend Analysis By Market Taxonomy, 2018 to 2022

    13.2. Market Size Value (US$ million) & Volume (Unit) Forecast By Market Taxonomy, 2023 to 2033

        13.2.1. By Country

            13.2.1.1. India

            13.2.1.2. Thailand

            13.2.1.3. Malaysia

            13.2.1.4. Indonesia

            13.2.1.5. Singapore

            13.2.1.6. Rest of South Asia

        13.2.2. By Product Type

        13.2.3. By Wattage

        13.2.4. By Capacity

    13.3. Market Attractiveness Analysis

        13.3.1. By Country

        13.3.2. By Product Type

        13.3.3. By Wattage

        13.3.4. By Capacity

    13.4. Key Takeaways

14. Oceania Market Analysis 2018 to 2022 and Forecast 2023 to 2033, By Country

    14.1. Historical Market Size Value (US$ million) & Volume (Unit) Trend Analysis By Market Taxonomy, 2018 to 2022

    14.2. Market Size Value (US$ million) & Volume (Unit) Forecast By Market Taxonomy, 2023 to 2033

        14.2.1. By Country

            14.2.1.1. Australia

            14.2.1.2. New Zealand

        14.2.2. By Product Type

        14.2.3. By Wattage

        14.2.4. By Capacity

    14.3. Market Attractiveness Analysis

        14.3.1. By Country

        14.3.2. By Product Type

        14.3.3. By Wattage

        14.3.4. By Capacity

    14.4. Key Takeaways

15. MEA Market Analysis 2018 to 2022 and Forecast 2023 to 2033, By Country

    15.1. Historical Market Size Value (US$ million) & Volume (Unit) Trend Analysis By Market Taxonomy, 2018 to 2022

    15.2. Market Size Value (US$ million) & Volume (Unit) Forecast By Market Taxonomy, 2023 to 2033

        15.2.1. By Country

            15.2.1.1. GCC Countries

            15.2.1.2. South Africa

            15.2.1.3. Central Africa

            15.2.1.4. North Africa

        15.2.2. By Product Type

        15.2.3. By Wattage

        15.2.4. By Capacity

    15.3. Market Attractiveness Analysis

        15.3.1. By Country

        15.3.2. By Product Type

        15.3.3. By Wattage

        15.3.4. By Capacity

    15.4. Key Takeaways

16. Key Countries Market Analysis

    16.1. USA

        16.1.1. Pricing Analysis

        16.1.2. Market Share Analysis, 2023

            16.1.2.1. By Product Type

            16.1.2.2. By Wattage

            16.1.2.3. By Capacity

    16.2. Canada

        16.2.1. Pricing Analysis

        16.2.2. Market Share Analysis, 2023

            16.2.2.1. By Product Type

            16.2.2.2. By Wattage

            16.2.2.3. By Capacity

    16.3. Brazil

        16.3.1. Pricing Analysis

        16.3.2. Market Share Analysis, 2023

            16.3.2.1. By Product Type

            16.3.2.2. By Wattage

            16.3.2.3. By Capacity

    16.4. Mexico

        16.4.1. Pricing Analysis

        16.4.2. Market Share Analysis, 2023

            16.4.2.1. By Product Type

            16.4.2.2. By Wattage

            16.4.2.3. By Capacity

    16.5. Argentina

        16.5.1. Pricing Analysis

        16.5.2. Market Share Analysis, 2023

            16.5.2.1. By Product Type

            16.5.2.2. By Wattage

            16.5.2.3. By Capacity

    16.6. Chile

        16.6.1. Pricing Analysis

        16.6.2. Market Share Analysis, 2023

            16.6.2.1. By Product Type

            16.6.2.2. By Wattage

            16.6.2.3. By Capacity

    16.7. Peru

        16.7.1. Pricing Analysis

        16.7.2. Market Share Analysis, 2023

            16.7.2.1. By Product Type

            16.7.2.2. By Wattage

            16.7.2.3. By Capacity

    16.8. Germany

        16.8.1. Pricing Analysis

        16.8.2. Market Share Analysis, 2023

            16.8.2.1. By Product Type

            16.8.2.2. By Wattage

            16.8.2.3. By Capacity

    16.9. Italy

        16.9.1. Pricing Analysis

        16.9.2. Market Share Analysis, 2023

            16.9.2.1. By Product Type

            16.9.2.2. By Wattage

            16.9.2.3. By Capacity

    16.10. France

        16.10.1. Pricing Analysis

        16.10.2. Market Share Analysis, 2023

            16.10.2.1. By Product Type

            16.10.2.2. By Wattage

            16.10.2.3. By Capacity

    16.11. Spain

        16.11.1. Pricing Analysis

        16.11.2. Market Share Analysis, 2023

            16.11.2.1. By Product Type

            16.11.2.2. By Wattage

            16.11.2.3. By Capacity

    16.12. United Kingdom

        16.12.1. Pricing Analysis

        16.12.2. Market Share Analysis, 2023

            16.12.2.1. By Product Type

            16.12.2.2. By Wattage

            16.12.2.3. By Capacity

    16.13. Russia

        16.13.1. Pricing Analysis

        16.13.2. Market Share Analysis, 2023

            16.13.2.1. By Product Type

            16.13.2.2. By Wattage

            16.13.2.3. By Capacity

    16.14. Poland

        16.14.1. Pricing Analysis

        16.14.2. Market Share Analysis, 2023

            16.14.2.1. By Product Type

            16.14.2.2. By Wattage

            16.14.2.3. By Capacity

    16.15. BENELUX

        16.15.1. Pricing Analysis

        16.15.2. Market Share Analysis, 2023

            16.15.2.1. By Product Type

            16.15.2.2. By Wattage

            16.15.2.3. By Capacity

    16.16. Nordic Countries

        16.16.1. Pricing Analysis

        16.16.2. Market Share Analysis, 2023

            16.16.2.1. By Product Type

            16.16.2.2. By Wattage

            16.16.2.3. By Capacity

    16.17. China

        16.17.1. Pricing Analysis

        16.17.2. Market Share Analysis, 2023

            16.17.2.1. By Product Type

            16.17.2.2. By Wattage

            16.17.2.3. By Capacity

    16.18. Japan

        16.18.1. Pricing Analysis

        16.18.2. Market Share Analysis, 2023

            16.18.2.1. By Product Type

            16.18.2.2. By Wattage

            16.18.2.3. By Capacity

    16.19. South Korea

        16.19.1. Pricing Analysis

        16.19.2. Market Share Analysis, 2023

            16.19.2.1. By Product Type

            16.19.2.2. By Wattage

            16.19.2.3. By Capacity

    16.20. India

        16.20.1. Pricing Analysis

        16.20.2. Market Share Analysis, 2023

            16.20.2.1. By Product Type

            16.20.2.2. By Wattage

            16.20.2.3. By Capacity

    16.21. Thailand

        16.21.1. Pricing Analysis

        16.21.2. Market Share Analysis, 2023

            16.21.2.1. By Product Type

            16.21.2.2. By Wattage

            16.21.2.3. By Capacity

    16.22. Indonesia

        16.22.1. Pricing Analysis

        16.22.2. Market Share Analysis, 2023

            16.22.2.1. By Product Type

            16.22.2.2. By Wattage

            16.22.2.3. By Capacity

    16.23. Malaysia

        16.23.1. Pricing Analysis

        16.23.2. Market Share Analysis, 2023

            16.23.2.1. By Product Type

            16.23.2.2. By Wattage

            16.23.2.3. By Capacity

    16.24. Singapore

        16.24.1. Pricing Analysis

        16.24.2. Market Share Analysis, 2023

            16.24.2.1. By Product Type

            16.24.2.2. By Wattage

            16.24.2.3. By Capacity

    16.25. Australia

        16.25.1. Pricing Analysis

        16.25.2. Market Share Analysis, 2023

            16.25.2.1. By Product Type

            16.25.2.2. By Wattage

            16.25.2.3. By Capacity

    16.26. New Zealand

        16.26.1. Pricing Analysis

        16.26.2. Market Share Analysis, 2023

            16.26.2.1. By Product Type

            16.26.2.2. By Wattage

            16.26.2.3. By Capacity

    16.27. GCC Countries

        16.27.1. Pricing Analysis

        16.27.2. Market Share Analysis, 2023

            16.27.2.1. By Product Type

            16.27.2.2. By Wattage

            16.27.2.3. By Capacity

    16.28. South Africa

        16.28.1. Pricing Analysis

        16.28.2. Market Share Analysis, 2023

            16.28.2.1. By Product Type

            16.28.2.2. By Wattage

            16.28.2.3. By Capacity

    16.29. North Africa

        16.29.1. Pricing Analysis

        16.29.2. Market Share Analysis, 2023

            16.29.2.1. By Product Type

            16.29.2.2. By Wattage

            16.29.2.3. By Capacity

    16.30. Central Africa

        16.30.1. Pricing Analysis

        16.30.2. Market Share Analysis, 2023

            16.30.2.1. By Product Type

            16.30.2.2. By Wattage

            16.30.2.3. By Capacity

17. Market Structure Analysis

    17.1. Competition Dashboard

    17.2. Competition Benchmarking

    17.3. Market Share Analysis of Top Players

        17.3.1. By Regional

        17.3.2. By Product Type

        17.3.3. By Wattage

        17.3.4. By Capacity

18. Competition Analysis

    18.1. Competition Deep Dive

        18.1.1. Cuisinart

            18.1.1.1. Overview

            18.1.1.2. Product Portfolio

            18.1.1.3. Profitability by Market Segments (Product/Age /Sales Channel/Region)

            18.1.1.4. Sales Footprint

            18.1.1.5. Strategy Overview

                18.1.1.5.1. Marketing Strategy

                18.1.1.5.2. Product Strategy

                18.1.1.5.3. Channel Strategy

        18.1.2. Calphalon

            18.1.2.1. Overview

            18.1.2.2. Product Portfolio

            18.1.2.3. Profitability by Market Segments (Product/Age /Sales Channel/Region)

            18.1.2.4. Sales Footprint

            18.1.2.5. Strategy Overview

                18.1.2.5.1. Marketing Strategy

                18.1.2.5.2. Product Strategy

                18.1.2.5.3. Channel Strategy

        18.1.3. Kalorik

            18.1.3.1. Overview

            18.1.3.2. Product Portfolio

            18.1.3.3. Profitability by Market Segments (Product/Age /Sales Channel/Region)

            18.1.3.4. Sales Footprint

            18.1.3.5. Strategy Overview

                18.1.3.5.1. Marketing Strategy

                18.1.3.5.2. Product Strategy

                18.1.3.5.3. Channel Strategy

        18.1.4. Black & Decker

            18.1.4.1. Overview

            18.1.4.2. Product Portfolio

            18.1.4.3. Profitability by Market Segments (Product/Age /Sales Channel/Region)

            18.1.4.4. Sales Footprint

            18.1.4.5. Strategy Overview

                18.1.4.5.1. Marketing Strategy

                18.1.4.5.2. Product Strategy

                18.1.4.5.3. Channel Strategy

        18.1.5. Havells 

            18.1.5.1. Overview

            18.1.5.2. Product Portfolio

            18.1.5.3. Profitability by Market Segments (Product/Age /Sales Channel/Region)

            18.1.5.4. Sales Footprint

            18.1.5.5. Strategy Overview

                18.1.5.5.1. Marketing Strategy

                18.1.5.5.2. Product Strategy

                18.1.5.5.3. Channel Strategy

        18.1.6. Brava Home

            18.1.6.1. Overview

            18.1.6.2. Product Portfolio

            18.1.6.3. Profitability by Market Segments (Product/Age /Sales Channel/Region)

            18.1.6.4. Sales Footprint

            18.1.6.5. Strategy Overview

                18.1.6.5.1. Marketing Strategy

                18.1.6.5.2. Product Strategy

                18.1.6.5.3. Channel Strategy

        18.1.7. Ninja Kitchen

            18.1.7.1. Overview

            18.1.7.2. Product Portfolio

            18.1.7.3. Profitability by Market Segments (Product/Age /Sales Channel/Region)

            18.1.7.4. Sales Footprint

            18.1.7.5. Strategy Overview

                18.1.7.5.1. Marketing Strategy

                18.1.7.5.2. Product Strategy

                18.1.7.5.3. Channel Strategy

        18.1.8. Hamilton Beach Brands

            18.1.8.1. Overview

            18.1.8.2. Product Portfolio

            18.1.8.3. Profitability by Market Segments (Product/Age /Sales Channel/Region)

            18.1.8.4. Sales Footprint

            18.1.8.5. Strategy Overview

                18.1.8.5.1. Marketing Strategy

                18.1.8.5.2. Product Strategy

                18.1.8.5.3. Channel Strategy

        18.1.9. COSORI

            18.1.9.1. Overview

            18.1.9.2. Product Portfolio

            18.1.9.3. Profitability by Market Segments (Product/Age /Sales Channel/Region)

            18.1.9.4. Sales Footprint

            18.1.9.5. Strategy Overview

                18.1.9.5.1. Marketing Strategy

                18.1.9.5.2. Product Strategy

                18.1.9.5.3. Channel Strategy

        18.1.10. Breville

            18.1.10.1. Overview

            18.1.10.2. Product Portfolio

            18.1.10.3. Profitability by Market Segments (Product/Age /Sales Channel/Region)

            18.1.10.4. Sales Footprint

            18.1.10.5. Strategy Overview

                18.1.10.5.1. Marketing Strategy

                18.1.10.5.2. Product Strategy

                18.1.10.5.3. Channel Strategy

        18.1.11. Philips

            18.1.11.1. Overview

            18.1.11.2. Product Portfolio

            18.1.11.3. Profitability by Market Segments (Product/Age /Sales Channel/Region)

            18.1.11.4. Sales Footprint

            18.1.11.5. Strategy Overview

                18.1.11.5.1. Marketing Strategy

                18.1.11.5.2. Product Strategy

                18.1.11.5.3. Channel Strategy

        18.1.12. GoWISE

            18.1.12.1. Overview

            18.1.12.2. Product Portfolio

            18.1.12.3. Profitability by Market Segments (Product/Age /Sales Channel/Region)

            18.1.12.4. Sales Footprint

            18.1.12.5. Strategy Overview

                18.1.12.5.1. Marketing Strategy

                18.1.12.5.2. Product Strategy

                18.1.12.5.3. Channel Strategy

        18.1.13. Inalsa

            18.1.13.1. Overview

            18.1.13.2. Product Portfolio

            18.1.13.3. Profitability by Market Segments (Product/Age /Sales Channel/Region)

            18.1.13.4. Sales Footprint

            18.1.13.5. Strategy Overview

                18.1.13.5.1. Marketing Strategy

                18.1.13.5.2. Product Strategy

                18.1.13.5.3. Channel Strategy

        18.1.14. KENT

            18.1.14.1. Overview

            18.1.14.2. Product Portfolio

            18.1.14.3. Profitability by Market Segments (Product/Age /Sales Channel/Region)

            18.1.14.4. Sales Footprint

            18.1.14.5. Strategy Overview

                18.1.14.5.1. Marketing Strategy

                18.1.14.5.2. Product Strategy

                18.1.14.5.3. Channel Strategy

19. Assumptions & Acronyms Used

20. Research Methodology

List of Tables

Table 1: Global Market Value (US$ million) Forecast by Region, 2018 to 2033

Table 2: Global Market Volume (Unit) Forecast by Region, 2018 to 2033

Table 3: Global Market Value (US$ million) Forecast by Product Type, 2018 to 2033

Table 4: Global Market Volume (Unit) Forecast by Product Type, 2018 to 2033

Table 5: Global Market Value (US$ million) Forecast by Wattage, 2018 to 2033

Table 6: Global Market Volume (Unit) Forecast by Wattage, 2018 to 2033

Table 7: Global Market Value (US$ million) Forecast by Capacity, 2018 to 2033

Table 8: Global Market Volume (Unit) Forecast by Capacity, 2018 to 2033

Table 9: North America Market Value (US$ million) Forecast by Country, 2018 to 2033

Table 10: North America Market Volume (Unit) Forecast by Country, 2018 to 2033

Table 11: North America Market Value (US$ million) Forecast by Product Type, 2018 to 2033

Table 12: North America Market Volume (Unit) Forecast by Product Type, 2018 to 2033

Table 13: North America Market Value (US$ million) Forecast by Wattage, 2018 to 2033

Table 14: North America Market Volume (Unit) Forecast by Wattage, 2018 to 2033

Table 15: North America Market Value (US$ million) Forecast by Capacity, 2018 to 2033

Table 16: North America Market Volume (Unit) Forecast by Capacity, 2018 to 2033

Table 17: Latin America Market Value (US$ million) Forecast by Country, 2018 to 2033

Table 18: Latin America Market Volume (Unit) Forecast by Country, 2018 to 2033

Table 19: Latin America Market Value (US$ million) Forecast by Product Type, 2018 to 2033

Table 20: Latin America Market Volume (Unit) Forecast by Product Type, 2018 to 2033

Table 21: Latin America Market Value (US$ million) Forecast by Wattage, 2018 to 2033

Table 22: Latin America Market Volume (Unit) Forecast by Wattage, 2018 to 2033

Table 23: Latin America Market Value (US$ million) Forecast by Capacity, 2018 to 2033

Table 24: Latin America Market Volume (Unit) Forecast by Capacity, 2018 to 2033

Table 25: Europe Market Value (US$ million) Forecast by Country, 2018 to 2033

Table 26: Europe Market Volume (Unit) Forecast by Country, 2018 to 2033

Table 27: Europe Market Value (US$ million) Forecast by Product Type, 2018 to 2033

Table 28: Europe Market Volume (Unit) Forecast by Product Type, 2018 to 2033

Table 29: Europe Market Value (US$ million) Forecast by Wattage, 2018 to 2033

Table 30: Europe Market Volume (Unit) Forecast by Wattage, 2018 to 2033

Table 31: Europe Market Value (US$ million) Forecast by Capacity, 2018 to 2033

Table 32: Europe Market Volume (Unit) Forecast by Capacity, 2018 to 2033

Table 33: East Asia Market Value (US$ million) Forecast by Country, 2018 to 2033

Table 34: East Asia Market Volume (Unit) Forecast by Country, 2018 to 2033

Table 35: East Asia Market Value (US$ million) Forecast by Product Type, 2018 to 2033

Table 36: East Asia Market Volume (Unit) Forecast by Product Type, 2018 to 2033

Table 37: East Asia Market Value (US$ million) Forecast by Wattage, 2018 to 2033

Table 38: East Asia Market Volume (Unit) Forecast by Wattage, 2018 to 2033

Table 39: East Asia Market Value (US$ million) Forecast by Capacity, 2018 to 2033

Table 40: East Asia Market Volume (Unit) Forecast by Capacity, 2018 to 2033

Table 41: South Asia Market Value (US$ million) Forecast by Country, 2018 to 2033

Table 42: South Asia Market Volume (Unit) Forecast by Country, 2018 to 2033

Table 43: South Asia Market Value (US$ million) Forecast by Product Type, 2018 to 2033

Table 44: South Asia Market Volume (Unit) Forecast by Product Type, 2018 to 2033

Table 45: South Asia Market Value (US$ million) Forecast by Wattage, 2018 to 2033

Table 46: South Asia Market Volume (Unit) Forecast by Wattage, 2018 to 2033

Table 47: South Asia Market Value (US$ million) Forecast by Capacity, 2018 to 2033

Table 48: South Asia Market Volume (Unit) Forecast by Capacity, 2018 to 2033

Table 49: Oceania Market Value (US$ million) Forecast by Country, 2018 to 2033

Table 50: Oceania Market Volume (Unit) Forecast by Country, 2018 to 2033

Table 51: Oceania Market Value (US$ million) Forecast by Product Type, 2018 to 2033

Table 52: Oceania Market Volume (Unit) Forecast by Product Type, 2018 to 2033

Table 53: Oceania Market Value (US$ million) Forecast by Wattage, 2018 to 2033

Table 54: Oceania Market Volume (Unit) Forecast by Wattage, 2018 to 2033

Table 55: Oceania Market Value (US$ million) Forecast by Capacity, 2018 to 2033

Table 56: Oceania Market Volume (Unit) Forecast by Capacity, 2018 to 2033

Table 57: MEA Market Value (US$ million) Forecast by Country, 2018 to 2033

Table 58: MEA Market Volume (Unit) Forecast by Country, 2018 to 2033

Table 59: MEA Market Value (US$ million) Forecast by Product Type, 2018 to 2033

Table 60: MEA Market Volume (Unit) Forecast by Product Type, 2018 to 2033

Table 61: MEA Market Value (US$ million) Forecast by Wattage, 2018 to 2033

Table 62: MEA Market Volume (Unit) Forecast by Wattage, 2018 to 2033

Table 63: MEA Market Value (US$ million) Forecast by Capacity, 2018 to 2033

Table 64: MEA Market Volume (Unit) Forecast by Capacity, 2018 to 2033

List of Charts

Figure 1: Global Market Value (US$ million) by Product Type, 2023 to 2033

Figure 2: Global Market Value (US$ million) by Wattage, 2023 to 2033

Figure 3: Global Market Value (US$ million) by Capacity, 2023 to 2033

Figure 4: Global Market Value (US$ million) by Region, 2023 to 2033

Figure 5: Global Market Value (US$ million) Analysis by Region, 2018 to 2033

Figure 6: Global Market Volume (Unit) Analysis by Region, 2018 to 2033

Figure 7: Global Market Value Share (%) and BPS Analysis by Region, 2023 to 2033

Figure 8: Global Market Y-o-Y Growth (%) Projections by Region, 2023 to 2033

Figure 9: Global Market Value (US$ million) Analysis by Product Type, 2018 to 2033

Figure 10: Global Market Volume (Unit) Analysis by Product Type, 2018 to 2033

Figure 11: Global Market Value Share (%) and BPS Analysis by Product Type, 2023 to 2033

Figure 12: Global Market Y-o-Y Growth (%) Projections by Product Type, 2023 to 2033

Figure 13: Global Market Value (US$ million) Analysis by Wattage, 2018 to 2033

Figure 14: Global Market Volume (Unit) Analysis by Wattage, 2018 to 2033

Figure 15: Global Market Value Share (%) and BPS Analysis by Wattage, 2023 to 2033

Figure 16: Global Market Y-o-Y Growth (%) Projections by Wattage, 2023 to 2033

Figure 17: Global Market Value (US$ million) Analysis by Capacity, 2018 to 2033

Figure 18: Global Market Volume (Unit) Analysis by Capacity, 2018 to 2033

Figure 19: Global Market Value Share (%) and BPS Analysis by Capacity, 2023 to 2033

Figure 20: Global Market Y-o-Y Growth (%) Projections by Capacity, 2023 to 2033

Figure 21: Global Market Attractiveness by Product Type, 2023 to 2033

Figure 22: Global Market Attractiveness by Wattage, 2023 to 2033

Figure 23: Global Market Attractiveness by Capacity, 2023 to 2033

Figure 24: Global Market Attractiveness by Region, 2023 to 2033

Figure 25: North America Market Value (US$ million) by Product Type, 2023 to 2033

Figure 26: North America Market Value (US$ million) by Wattage, 2023 to 2033

Figure 27: North America Market Value (US$ million) by Capacity, 2023 to 2033

Figure 28: North America Market Value (US$ million) by Country, 2023 to 2033

Figure 29: North America Market Value (US$ million) Analysis by Country, 2018 to 2033

Figure 30: North America Market Volume (Unit) Analysis by Country, 2018 to 2033

Figure 31: North America Market Value Share (%) and BPS Analysis by Country, 2023 to 2033

Figure 32: North America Market Y-o-Y Growth (%) Projections by Country, 2023 to 2033

Figure 33: North America Market Value (US$ million) Analysis by Product Type, 2018 to 2033

Figure 34: North America Market Volume (Unit) Analysis by Product Type, 2018 to 2033

Figure 35: North America Market Value Share (%) and BPS Analysis by Product Type, 2023 to 2033

Figure 36: North America Market Y-o-Y Growth (%) Projections by Product Type, 2023 to 2033

Figure 37: North America Market Value (US$ million) Analysis by Wattage, 2018 to 2033

Figure 38: North America Market Volume (Unit) Analysis by Wattage, 2018 to 2033

Figure 39: North America Market Value Share (%) and BPS Analysis by Wattage, 2023 to 2033

Figure 40: North America Market Y-o-Y Growth (%) Projections by Wattage, 2023 to 2033

Figure 41: North America Market Value (US$ million) Analysis by Capacity, 2018 to 2033

Figure 42: North America Market Volume (Unit) Analysis by Capacity, 2018 to 2033

Figure 43: North America Market Value Share (%) and BPS Analysis by Capacity, 2023 to 2033

Figure 44: North America Market Y-o-Y Growth (%) Projections by Capacity, 2023 to 2033

Figure 45: North America Market Attractiveness by Product Type, 2023 to 2033

Figure 46: North America Market Attractiveness by Wattage, 2023 to 2033

Figure 47: North America Market Attractiveness by Capacity, 2023 to 2033

Figure 48: North America Market Attractiveness by Country, 2023 to 2033

Figure 49: Latin America Market Value (US$ million) by Product Type, 2023 to 2033

Figure 50: Latin America Market Value (US$ million) by Wattage, 2023 to 2033

Figure 51: Latin America Market Value (US$ million) by Capacity, 2023 to 2033

Figure 52: Latin America Market Value (US$ million) by Country, 2023 to 2033

Figure 53: Latin America Market Value (US$ million) Analysis by Country, 2018 to 2033

Figure 54: Latin America Market Volume (Unit) Analysis by Country, 2018 to 2033

Figure 55: Latin America Market Value Share (%) and BPS Analysis by Country, 2023 to 2033

Figure 56: Latin America Market Y-o-Y Growth (%) Projections by Country, 2023 to 2033

Figure 57: Latin America Market Value (US$ million) Analysis by Product Type, 2018 to 2033

Figure 58: Latin America Market Volume (Unit) Analysis by Product Type, 2018 to 2033

Figure 59: Latin America Market Value Share (%) and BPS Analysis by Product Type, 2023 to 2033

Figure 60: Latin America Market Y-o-Y Growth (%) Projections by Product Type, 2023 to 2033

Figure 61: Latin America Market Value (US$ million) Analysis by Wattage, 2018 to 2033

Figure 62: Latin America Market Volume (Unit) Analysis by Wattage, 2018 to 2033

Figure 63: Latin America Market Value Share (%) and BPS Analysis by Wattage, 2023 to 2033

Figure 64: Latin America Market Y-o-Y Growth (%) Projections by Wattage, 2023 to 2033

Figure 65: Latin America Market Value (US$ million) Analysis by Capacity, 2018 to 2033

Figure 66: Latin America Market Volume (Unit) Analysis by Capacity, 2018 to 2033

Figure 67: Latin America Market Value Share (%) and BPS Analysis by Capacity, 2023 to 2033

Figure 68: Latin America Market Y-o-Y Growth (%) Projections by Capacity, 2023 to 2033

Figure 69: Latin America Market Attractiveness by Product Type, 2023 to 2033

Figure 70: Latin America Market Attractiveness by Wattage, 2023 to 2033

Figure 71: Latin America Market Attractiveness by Capacity, 2023 to 2033

Figure 72: Latin America Market Attractiveness by Country, 2023 to 2033

Figure 73: Europe Market Value (US$ million) by Product Type, 2023 to 2033

Figure 74: Europe Market Value (US$ million) by Wattage, 2023 to 2033

Figure 75: Europe Market Value (US$ million) by Capacity, 2023 to 2033

Figure 76: Europe Market Value (US$ million) by Country, 2023 to 2033

Figure 77: Europe Market Value (US$ million) Analysis by Country, 2018 to 2033

Figure 78: Europe Market Volume (Unit) Analysis by Country, 2018 to 2033

Figure 79: Europe Market Value Share (%) and BPS Analysis by Country, 2023 to 2033

Figure 80: Europe Market Y-o-Y Growth (%) Projections by Country, 2023 to 2033

Figure 81: Europe Market Value (US$ million) Analysis by Product Type, 2018 to 2033

Figure 82: Europe Market Volume (Unit) Analysis by Product Type, 2018 to 2033

Figure 83: Europe Market Value Share (%) and BPS Analysis by Product Type, 2023 to 2033

Figure 84: Europe Market Y-o-Y Growth (%) Projections by Product Type, 2023 to 2033

Figure 85: Europe Market Value (US$ million) Analysis by Wattage, 2018 to 2033

Figure 86: Europe Market Volume (Unit) Analysis by Wattage, 2018 to 2033

Figure 87: Europe Market Value Share (%) and BPS Analysis by Wattage, 2023 to 2033

Figure 88: Europe Market Y-o-Y Growth (%) Projections by Wattage, 2023 to 2033

Figure 89: Europe Market Value (US$ million) Analysis by Capacity, 2018 to 2033

Figure 90: Europe Market Volume (Unit) Analysis by Capacity, 2018 to 2033

Figure 91: Europe Market Value Share (%) and BPS Analysis by Capacity, 2023 to 2033

Figure 92: Europe Market Y-o-Y Growth (%) Projections by Capacity, 2023 to 2033

Figure 93: Europe Market Attractiveness by Product Type, 2023 to 2033

Figure 94: Europe Market Attractiveness by Wattage, 2023 to 2033

Figure 95: Europe Market Attractiveness by Capacity, 2023 to 2033

Figure 96: Europe Market Attractiveness by Country, 2023 to 2033

Figure 97: East Asia Market Value (US$ million) by Product Type, 2023 to 2033

Figure 98: East Asia Market Value (US$ million) by Wattage, 2023 to 2033

Figure 99: East Asia Market Value (US$ million) by Capacity, 2023 to 2033

Figure 100: East Asia Market Value (US$ million) by Country, 2023 to 2033

Figure 101: East Asia Market Value (US$ million) Analysis by Country, 2018 to 2033

Figure 102: East Asia Market Volume (Unit) Analysis by Country, 2018 to 2033

Figure 103: East Asia Market Value Share (%) and BPS Analysis by Country, 2023 to 2033

Figure 104: East Asia Market Y-o-Y Growth (%) Projections by Country, 2023 to 2033

Figure 105: East Asia Market Value (US$ million) Analysis by Product Type, 2018 to 2033

Figure 106: East Asia Market Volume (Unit) Analysis by Product Type, 2018 to 2033

Figure 107: East Asia Market Value Share (%) and BPS Analysis by Product Type, 2023 to 2033

Figure 108: East Asia Market Y-o-Y Growth (%) Projections by Product Type, 2023 to 2033

Figure 109: East Asia Market Value (US$ million) Analysis by Wattage, 2018 to 2033

Figure 110: East Asia Market Volume (Unit) Analysis by Wattage, 2018 to 2033

Figure 111: East Asia Market Value Share (%) and BPS Analysis by Wattage, 2023 to 2033

Figure 112: East Asia Market Y-o-Y Growth (%) Projections by Wattage, 2023 to 2033

Figure 113: East Asia Market Value (US$ million) Analysis by Capacity, 2018 to 2033

Figure 114: East Asia Market Volume (Unit) Analysis by Capacity, 2018 to 2033

Figure 115: East Asia Market Value Share (%) and BPS Analysis by Capacity, 2023 to 2033

Figure 116: East Asia Market Y-o-Y Growth (%) Projections by Capacity, 2023 to 2033

Figure 117: East Asia Market Attractiveness by Product Type, 2023 to 2033

Figure 118: East Asia Market Attractiveness by Wattage, 2023 to 2033

Figure 119: East Asia Market Attractiveness by Capacity, 2023 to 2033

Figure 120: East Asia Market Attractiveness by Country, 2023 to 2033

Figure 121: South Asia Market Value (US$ million) by Product Type, 2023 to 2033

Figure 122: South Asia Market Value (US$ million) by Wattage, 2023 to 2033

Figure 123: South Asia Market Value (US$ million) by Capacity, 2023 to 2033

Figure 124: South Asia Market Value (US$ million) by Country, 2023 to 2033

Figure 125: South Asia Market Value (US$ million) Analysis by Country, 2018 to 2033

Figure 126: South Asia Market Volume (Unit) Analysis by Country, 2018 to 2033

Figure 127: South Asia Market Value Share (%) and BPS Analysis by Country, 2023 to 2033

Figure 128: South Asia Market Y-o-Y Growth (%) Projections by Country, 2023 to 2033

Figure 129: South Asia Market Value (US$ million) Analysis by Product Type, 2018 to 2033

Figure 130: South Asia Market Volume (Unit) Analysis by Product Type, 2018 to 2033

Figure 131: South Asia Market Value Share (%) and BPS Analysis by Product Type, 2023 to 2033

Figure 132: South Asia Market Y-o-Y Growth (%) Projections by Product Type, 2023 to 2033

Figure 133: South Asia Market Value (US$ million) Analysis by Wattage, 2018 to 2033

Figure 134: South Asia Market Volume (Unit) Analysis by Wattage, 2018 to 2033

Figure 135: South Asia Market Value Share (%) and BPS Analysis by Wattage, 2023 to 2033

Figure 136: South Asia Market Y-o-Y Growth (%) Projections by Wattage, 2023 to 2033

Figure 137: South Asia Market Value (US$ million) Analysis by Capacity, 2018 to 2033

Figure 138: South Asia Market Volume (Unit) Analysis by Capacity, 2018 to 2033

Figure 139: South Asia Market Value Share (%) and BPS Analysis by Capacity, 2023 to 2033

Figure 140: South Asia Market Y-o-Y Growth (%) Projections by Capacity, 2023 to 2033

Figure 141: South Asia Market Attractiveness by Product Type, 2023 to 2033

Figure 142: South Asia Market Attractiveness by Wattage, 2023 to 2033

Figure 143: South Asia Market Attractiveness by Capacity, 2023 to 2033

Figure 144: South Asia Market Attractiveness by Country, 2023 to 2033

Figure 145: Oceania Market Value (US$ million) by Product Type, 2023 to 2033

Figure 146: Oceania Market Value (US$ million) by Wattage, 2023 to 2033

Figure 147: Oceania Market Value (US$ million) by Capacity, 2023 to 2033

Figure 148: Oceania Market Value (US$ million) by Country, 2023 to 2033

Figure 149: Oceania Market Value (US$ million) Analysis by Country, 2018 to 2033

Figure 150: Oceania Market Volume (Unit) Analysis by Country, 2018 to 2033

Figure 151: Oceania Market Value Share (%) and BPS Analysis by Country, 2023 to 2033

Figure 152: Oceania Market Y-o-Y Growth (%) Projections by Country, 2023 to 2033

Figure 153: Oceania Market Value (US$ million) Analysis by Product Type, 2018 to 2033

Figure 154: Oceania Market Volume (Unit) Analysis by Product Type, 2018 to 2033

Figure 155: Oceania Market Value Share (%) and BPS Analysis by Product Type, 2023 to 2033

Figure 156: Oceania Market Y-o-Y Growth (%) Projections by Product Type, 2023 to 2033

Figure 157: Oceania Market Value (US$ million) Analysis by Wattage, 2018 to 2033

Figure 158: Oceania Market Volume (Unit) Analysis by Wattage, 2018 to 2033

Figure 159: Oceania Market Value Share (%) and BPS Analysis by Wattage, 2023 to 2033

Figure 160: Oceania Market Y-o-Y Growth (%) Projections by Wattage, 2023 to 2033

Figure 161: Oceania Market Value (US$ million) Analysis by Capacity, 2018 to 2033

Figure 162: Oceania Market Volume (Unit) Analysis by Capacity, 2018 to 2033

Figure 163: Oceania Market Value Share (%) and BPS Analysis by Capacity, 2023 to 2033

Figure 164: Oceania Market Y-o-Y Growth (%) Projections by Capacity, 2023 to 2033

Figure 165: Oceania Market Attractiveness by Product Type, 2023 to 2033

Figure 166: Oceania Market Attractiveness by Wattage, 2023 to 2033

Figure 167: Oceania Market Attractiveness by Capacity, 2023 to 2033

Figure 168: Oceania Market Attractiveness by Country, 2023 to 2033

Figure 169: MEA Market Value (US$ million) by Product Type, 2023 to 2033

Figure 170: MEA Market Value (US$ million) by Wattage, 2023 to 2033

Figure 171: MEA Market Value (US$ million) by Capacity, 2023 to 2033

Figure 172: MEA Market Value (US$ million) by Country, 2023 to 2033

Figure 173: MEA Market Value (US$ million) Analysis by Country, 2018 to 2033

Figure 174: MEA Market Volume (Unit) Analysis by Country, 2018 to 2033

Figure 175: MEA Market Value Share (%) and BPS Analysis by Country, 2023 to 2033

Figure 176: MEA Market Y-o-Y Growth (%) Projections by Country, 2023 to 2033

Figure 177: MEA Market Value (US$ million) Analysis by Product Type, 2018 to 2033

Figure 178: MEA Market Volume (Unit) Analysis by Product Type, 2018 to 2033

Figure 179: MEA Market Value Share (%) and BPS Analysis by Product Type, 2023 to 2033

Figure 180: MEA Market Y-o-Y Growth (%) Projections by Product Type, 2023 to 2033

Figure 181: MEA Market Value (US$ million) Analysis by Wattage, 2018 to 2033

Figure 182: MEA Market Volume (Unit) Analysis by Wattage, 2018 to 2033

Figure 183: MEA Market Value Share (%) and BPS Analysis by Wattage, 2023 to 2033

Figure 184: MEA Market Y-o-Y Growth (%) Projections by Wattage, 2023 to 2033

Figure 185: MEA Market Value (US$ million) Analysis by Capacity, 2018 to 2033

Figure 186: MEA Market Volume (Unit) Analysis by Capacity, 2018 to 2033

Figure 187: MEA Market Value Share (%) and BPS Analysis by Capacity, 2023 to 2033

Figure 188: MEA Market Y-o-Y Growth (%) Projections by Capacity, 2023 to 2033

Figure 189: MEA Market Attractiveness by Product Type, 2023 to 2033

Figure 190: MEA Market Attractiveness by Wattage, 2023 to 2033

Figure 191: MEA Market Attractiveness by Capacity, 2023 to 2033

Figure 192: MEA Market Attractiveness by Country, 2023 to 2033

Explore Process Automation Insights

View Reports

Commercial Air Fryer Oven Market