Reports

- Global Locations -

Headquarters

Future Market Insights, Inc.

Christiana Corporate, 200
Continental Drive, Suite 401,
Newark, Delaware - 19713,
United States

T: +1-845-579-5705

Americas

Future Market Insights, Inc.

616 Corporate Way, Suite 2-9018,
Valley Cottage, NY 10989, United States

T: +1-347-918-3531

MEA

Future Market Insights

1602-6 Jumeirah Bay X2 Tower, Plot No: JLT-PH2-X2A,
Jumeirah Lakes Towers, Dubai,
United Arab Emirates

Europe

Future Market Insights

3rd Floor, 207 Regent Street,
W1B 3HH London
United Kingdom

T: + 44 (0) 20 8123 9659
D: +44 (0) 20 3287 4268

Asia Pacific

Future Market Insights

IndiaLand Global Tech Park, Unit UG-1, Behind Grand HighStreet, Phase 1, Hinjawadi, MH, Pune – 411057, India

Commercial Drink Mixers Market Outlook (2022 to 2032)

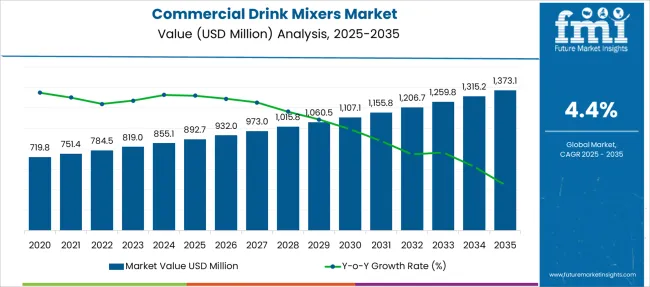
The 2022 to 2032 period is expected to bring a steady 4.4% CAGR to the global commercial drink mixers market. By 2022 end, the market’s valuation is poised to reach US$ 784.5 Million. By the end of 2032, a US$ 1208.1 million valuation is likely.

Commercial drink mixers are liquid non-alcoholic products that are primarily used for adding volume and flavor to cocktails. Popular commercial drink mixers include club soda, ginger ale, tonic water, sour mixes, bitters, and grenadine. In addition to making cocktails, commercial drink mixers can be also used to enhance the taste of alcoholic beverages such as rum, vodka, whiskey, and gin.

Around the world, commercial drink mixers are used in bars, pubs, and other establishments where alcohol is served. More and more consumers of alcohol are turning to these mixers, which can be used to make alcoholic beverages savory, sour, or sweet. Some consumers may also prefer mixers owing to their ability to change drinks’ consistencies and textures.

Nowadays, many commercial drink mixer brands are selling their products across physical and online retail stores. Until a few years ago, the majority of these products were purchased exclusively by drinking establishments.

However, the pandemic transformed this trend as bars, pubs, and restaurants were forced to stay closed for extended periods. Players in the commercial drink mixers saw this as an opportunity and made their products available for consumers on different distribution channels.

As a result of these developments, consumers became more aware of commercial drink mixers and began to purchase them for use at home as well. Once lockdown restrictions were lifted, drinking establishments reopened their doors to customers and set in motion the rapid expansion of the commercial drink mixers industry. As consumers continue to become more aware of commercial drink mixers and their uses, FMI anticipates further market expansion.

Both prominent and emerging market players have leveraged the power of social media to raise awareness of their products among consumers. Additionally, they have started to pay more attention to packaging to enhance their products’ visual appeal. Investors have also been keen on backing this market for making the most of potential opportunities.

For instance, in March 2021, Jimmy’s Cocktails, one of the leading names in India’s commercial drink mixers industry, raised Rs. 6 crores. Radiohead Brands, the parent company of Jimmy’s Cocktails, raised the money in a pre-series funding round, which was led by the likes of Keki Mistry, the CEO of HDFC Ltd., and Vinay Agarwal, the Director of First State Stewart Asia.

Attributes Key Insights
Global Commercial Drink Mixers Market Estimated Size (2022E) US$ 784.5 Million
Projected Market Valuation (2032F) US$ 1208.1 Million
Value-based CAGR (2022 to 2032) 4.4%
Market Share of the USA 25.83%

Don't pay for what you don't need

Customize your report by selecting specific countries or regions and save 30%!

2017 to 2021 Commercial Drink Mixers Market Outlook Compared to 2022 to 2032 Demand Forecast

During the 2017 to 2021 historical period, the global commercial drink mixers industry is estimated to have expanded significantly, especially after most of the world eased lockdown restrictions. By this time, consumers had already started to use commercial drink mixers at home, which had given the market a much-needed boost. As public drinking establishments started to operate again, consumers rushed to them and as a result, demand for commercial drink mixers skyrocketed.

During the forecast period, FMI expects the market to keep expanding as consumers of alcohol are set to fuel demand for commercial drink mixers. Also, packaging innovations and clever marketing strategies are likely to promote the use of commercial drink mixers at home.

Online delivery platforms are anticipated to contribute immensely to market expansion in the next ten years as these platforms make it easy for consumers to purchase their preferred products. For instance, Swiggy, a prominent online food delivery service in India, offers commercial drink mixers in Swiggy Instamart. Consumers can opt for quick 15-minute deliveries on the platform, which makes shopping for commercial drink mixers convenient.

Market-o-nomics - Highlighting the Key Trends

According to FMI, several crucial factors are responsible for driving the commercial drink mixers industry. FMI’s leading analysts have evaluated emerging opportunities, market restraints, and potential threats that are likely to impact market expansion.

The drivers, restraints, opportunities, and threats (DROTs) identified are as follows:

DRIVERS

  • Growing awareness of commercial drink mixers among consumers is expected to generate more demand
  • Convenient buying options for consumers are anticipated to make the commercial drink mixers industry more accessible

RESTRAINTS

  • Limited availability of commercial drink mixers in certain regions is predicted to restrict market expansion
  • Consumers of alcohol from low-income groups are not likely to buy commercial drink mixers, which is set to hinder sales.

OPPORTUNITIES

  • Key players are poised to offer more innovative products during the forecast period.
  • Social media platforms serve as marketing channels for emerging brands that want to increase brand awareness

THREATS

  • Increasing awareness of the health risks associated with alcohol consumption may lead to a decline in demand and sales.
Nandini Roy Choudhury

Principal Consultant

Talk to Analyst

Find your sweet spots for generating winning opportunities in this market.

Country-wise insights

Why has the U.S. Emerged as One of the Leading Commercial Drink Mixers Industries?

“Increasing Demand for Cocktails Set to Drive Sales of Commercial Drink Mixers in the US.”

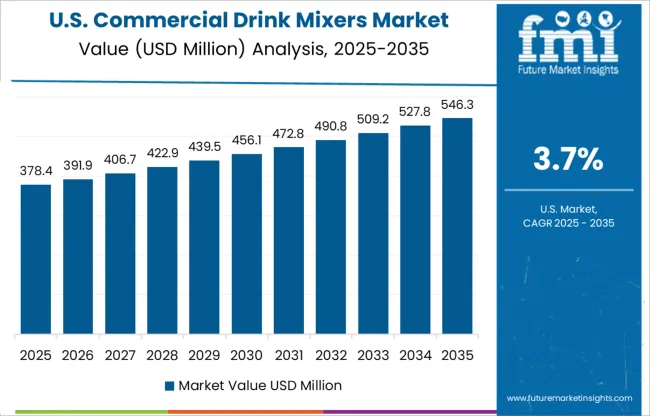
North America holds approximately 38% of the global commercial drink mixers market share. The US. market accounts for around 68% of the North American commercial drink mixers industry.

The US. is home to thousands of bars, restaurants, and nightclubs. The majority of commercial drink mixers are used across these public drinking establishments owing to the high demand for cocktails.

What are the Future Projections for the Commercial Drink Mixers Market in the UK?

“Cultural Significance of Alcohol Consumption to Impact Demand for Commercial Drink Mixers in the UK”

Europe accounts for approximately 40% of the global commercial drink mixers market, and the UK is predicted to spearhead the European market during the forecast period. The UK has a 22% share in the Europe commercial drink mixers industry, and its market is valued at US$ 69.1 Million.

In the UK, the consumption of alcoholic beverages is slated to increase in the coming years due to their cultural significance. As a result, the UK commercial drink mixers industry is poised to benefit.

Why is France One of the Most Lucrative Countries for Commercial Drink Mixers?

“Expansion of French Tourism Help Broaden the Field of Commercial Drink Mixers”

France’s commercial drink mixers market is predicted to experience expansion during the forecast period owing to factors such as bars and pubs promoting the combination of liquor with mixers and the rising popularity of cocktails.

The country also happens to be one of the most popular tourist destinations in Europe. Over the next ten years, the French tourism industry is set for rapid growth, and this would have a positive impact on the country’s commercial drink mixers industry.

Why is India Experiencing Growth in the Commercial Drink Mixers Market?

“Rising Disposable Income and Increasing Popularity of Mixers to Drive India”

In recent years, India’s growth in the commercial drink mixers industry has been significant. This is due to a number of factors including the growing popularity of mixed drinks and the increasing disposable income in the country.

There are a wide variety of commercial drink mixers available in the Indian market, ranging from simple fruit juices to more complex syrups and liqueurs. The most popular type of drink mixer in India is fruit juice, which is used to make a wide variety of mixed drinks.

The growing popularity of mixed drinks in India has led to an increasing demand for commercial drink mixers. As a result, many companies have started to produce and sell commercial drink mixers specifically for this market.

Category-wise Insights

What are the Reasons Behind the Increasing Popularity of Club Soda?

“Growing Use of Club Soda as a Mixer with Various Alcoholic Beverages to Boost Sales”

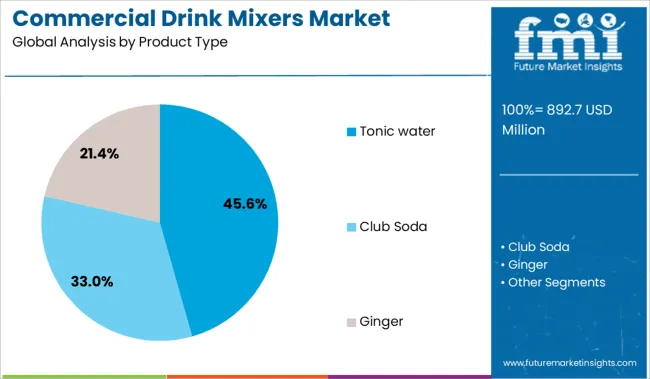
Club soda is predicted to experience the largest growth by product category between 2022 and 2032, registering a steady 4.4% CAGR. The growing popularity of club soda among consumers around the globe is promoting market expansion.

The significant use of cocktail mixers with alcoholic beverages such as vodka and gin is the segment's main driver. In addition, the industry growth of club soda is attributed to the resurgence of cocktail traditions among young people in both developed and emerging economies, as well as the increased demand for premium spirits.

Why is Tonic Water Becoming More Popular?

“Rising Public Awareness of Tonic Water’s Health Benefits to Increase its Popularity as a Drink Mixer”

The segment that sold tonic water had the biggest revenue share in 2022. The expansion of the industry is being driven by the global trend toward utilizing more tonic water in beverages. The fact that tonic water contains the medicine quinine, which is used to treat malaria and babesiosis, further contributes to its widespread use as a healthy beverage.

Additionally, the market is expected to grow in the approaching years due to a variety of tonic water's health advantages. The manufacturers of tonic water also offer diverse product ranges with flavoring and sweeteners.
Get the data you need at a Fraction of the cost

Personalize your report by choosing insights you need
and save 40%!

Competitive landscape

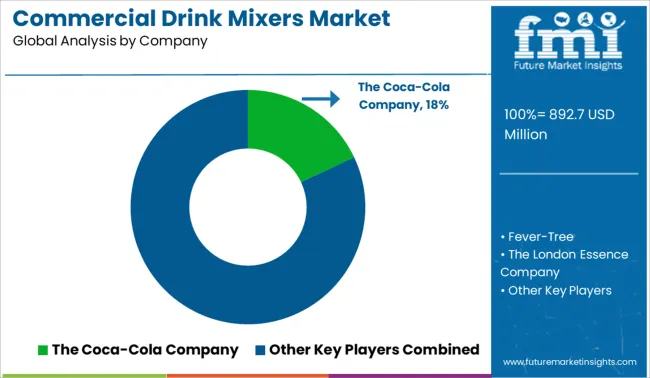
The global market for cocktail mixers is highly fragmented and houses a large number of international and local companies. Many companies are focusing on providing unique options to their consumers by launching new products. Some of the renowned companies are focusing on technological developments to strengthen their positions.

For instance,

  • In August 2021, Total Beverage Solution announced the introduction of its award-winning Double Dutch Drinks in the US.

Scope of the Report

Attribute Details
Estimated Market Size (2022) US$ 784.5 Million
Projected Market Valuation (2032) US$ 1208.1 Million
Value-based CAGR (2022 to 2032) 4.4%
Forecast Period 2022 to 2032
Historical Data Available for 2017 to 2021
Market Analysis Value (US$ Million)
Key Regions Covered
  • North America
  • Europe
  • Asia Pacific
  • Middle East & Africa (MEA)
  • Central & South America
Key Countries Covered
  • The USA
  • Canada
  • Mexico
  • Germany
  • The UK
  • France
  • Italy
  • Spain
  • China
  • Japan
  • India
  • South Korea
  • Australia
  • Brazil
  • Argentina
  • South Africa
  • UAE
Key Segments Covered
  • Product Type
  • Region
Key Companies Profiled
  • Fever-Tree
  • The London Essence Company
  • Keurig Dr. Pepper, Inc.
  • The Coca-Cola Company
  • THOMAS HENRY GMBH
  • East Imperial
  • Fentimans
  • Q MIXERS
  • Britvic
  • White Rock Products Corporation
  • Bartisans
  • Three Cents
Report Coverage Market forecast, Company Share Analysis, Competitive Landscape, DROT Analysis, Market Dynamics and Challenges, and Strategic Growth Initiatives

Commercial Drink Mixers Market Segmentation by Category

By Product Type :

  • Tonic water
  • Club Soda
  • Ginger

By Region :

  • North America
  • Latin America
  • Asia Pacific
  • Eastern Europe
  • Western Europe
  • Japan
  • Middle East & Africa (MEA)

Frequently Asked Questions

How big is the commercial drink mixers industry?

The commercial drink mixers industry is estimated to be valued at US$ 784.5 Million by the end of 2022.

At what rate is the commercial drink mixers industry expected to rise?

The commercial drink mixers industry is expected to rise at a steady CAGR of 4.4% in the forecast period.

What is the North America commercial drink mixers industry outlook?

The North American commercial drink mixers industry is expected to have a 38% share in the global market by 2022 end, which is likely to grow bigger as the US market is poised to experience further expansion from 2022 to 2032.

Which are the major countries driving the demand for commercial drink mixers?

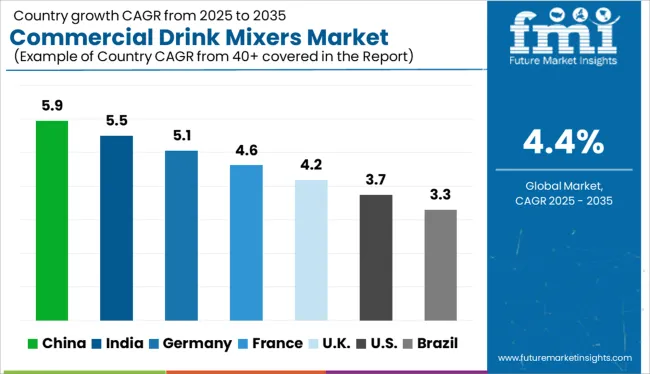
The US, the UK, and France are the major countries driving demand for commercial drink mixers.

Who are the key players in the market?

Fever-Tree, The London Essence Company, Keurig Dr. Pepper, Inc., The Coca-Cola Company, THOMAS HENRY GMBH, East Imperial, Fentimans, Q MIXERS, Britvic, White Rock Products Corporation, Bartisans, and Three Cents are the key players in the market.

What is the demand outlook forecast for the commercial drink mixers industry?

The global commercial drink mixers industry is anticipated to go beyond US$ 1208.1 Million by the end of 2032.

Table of Content

1. Executive Summary | Commercial Drink Mixers Market

    1.1. Global Market Outlook

    1.2. Demand-side Trends

    1.3. Supply-side Trends

    1.4. Technology Roadmap Analysis

    1.5. Analysis and Recommendations

2. Market Overview

    2.1. Market Coverage / Taxonomy

    2.2. Market Definition / Scope / Limitations

3. Market Background

    3.1. Market Dynamics

        3.1.1. Drivers

        3.1.2. Restraints

        3.1.3. Opportunity

        3.1.4. Trends

    3.2. Scenario Forecast

        3.2.1. Demand in Optimistic Scenario

        3.2.2. Demand in Likely Scenario

        3.2.3. Demand in Conservative Scenario

    3.3. Product launches & Recent Developments

    3.4. Product Life Cycle Analysis

    3.5. Value Chain Analysis

        3.5.1. Supply Side Participants and their Roles

            3.5.1.1. Producers

            3.5.1.2. Mid-Level Participants (Traders / Agents / Brokers)

            3.5.1.3. Wholesalers and Distributors

        3.5.2. % of Operating Margin Analysis

        3.5.3. List of Raw Material Suppliers

        3.5.4. List of Existing and Potential Buyers

    3.6. Global Market - Pricing Analysis

        3.6.1. Price Point Assessment by Region

        3.6.2. Price Point Assessment by Product Type

        3.6.3. Price Forecast till 2032

        3.6.4. Factors affecting pricing

    3.7. Forecast Factors - Relevance & Impact

    3.8. PESTLE and Porter’s Analysis

    3.9. Regulatory Landscape

        3.9.1. Packaging & Labelling Regulations

        3.9.2. Certifications and Certifying Agency Overview

        3.9.3. Import/Export Policies

    3.10. Regional Parent Market Outlook

    3.11. Production and Consumption Statistics

    3.12. Import and Export Statistics

    3.13. Consumers Survey Analysis

    3.14. Macro-Economic Factors

    3.15. Product Claims & Nutritional Information scanned by Buyers

4. Global Market Analysis 2017 to 2021 and Forecast, 2022 to 2032

    4.1. Historical Market Size Value (US$ Mn) & Volume (MT) Analysis, 2017 to 2021

    4.2. Current and Future Market Size Value (US$ Mn) & Volume (MT) Projections, 2022 to 2032

        4.2.1. Y-o-Y Growth Trend Analysis

        4.2.2. Absolute $ Opportunity Analysis

5. Global Market Analysis 2017 to 2021 and Forecast 2022 to 2032, By Product Type

    5.1. Introduction / Key Findings

    5.2. Historical Market Size Value (US$ Mn) & Volume (MT) Analysis By Product Type, 2017 to 2021

    5.3. Current and Future Market Size Value (US$ Mn) & Volume (MT) Analysis and Forecast By Product Type, 2022 to 2032

        5.3.1. Tonic water

        5.3.2. Club soda

        5.3.3. Ginger

    5.4. Y-o-Y Growth Trend Analysis By Product Type, 2017 to 2021

    5.5. Absolute $ Opportunity Analysis By Product Type, 2022 to 2032

6. Global Market Analysis 2017 to 2021 and Forecast 2022 to 2032, By Region

    6.1. Introduction

    6.2. Historical Market Size Value (US$ Mn) & Volume (MT) Analysis By Region, 2017 to 2021

    6.3. Current Market Size Value (US$ Mn) & Volume (MT) Analysis and Forecast By Region, 2022 to 2032

        6.3.1. North America

        6.3.2. Latin America

        6.3.3. Europe

        6.3.4. East Asia

        6.3.5. South Asia

        6.3.6. Oceania

        6.3.7. Middle East & Africa (MEA)

    6.4. Market Attractiveness Analysis By Region

7. North America Market Analysis 2017 to 2021 and Forecast 2022 to 2032, By Country

    7.1. Historical Market Size Value (US$ Mn) & Volume (MT) Trend Analysis By Market Taxonomy, 2017 to 2021

    7.2. Market Size Value (US$ Mn) & Volume (MT) Forecast By Market Taxonomy, 2022 to 2032

        7.2.1. By Country

            7.2.1.1. The US

            7.2.1.2. Canada

        7.2.2. By Product Type

    7.3. Market Attractiveness Analysis

        7.3.1. By Country

        7.3.2. By Product Type

    7.4. Key Takeaways

8. Latin America Market Analysis 2017 to 2021 and Forecast 2022 to 2032, By Country

    8.1. Historical Market Size Value (US$ Mn) & Volume (MT) Trend Analysis By Market Taxonomy, 2017 to 2021

    8.2. Market Size Value (US$ Mn) & Volume (MT) Forecast By Market Taxonomy, 2022 to 2032

        8.2.1. By Country

            8.2.1.1. Brazil

            8.2.1.2. Mexico

            8.2.1.3. Argentina

            8.2.1.4. Chile

            8.2.1.5. Peru

            8.2.1.6. Rest of Latin America

        8.2.2. By Product Type

    8.3. Market Attractiveness Analysis

        8.3.1. By Country

        8.3.2. By Product Type

    8.4. Key Takeaways

9. Europe Market Analysis 2017 to 2021 and Forecast 2022 to 2032, By Country

    9.1. Historical Market Size Value (US$ Mn) & Volume (MT) Trend Analysis By Market Taxonomy, 2017 to 2021

    9.2. Market Size Value (US$ Mn) & Volume (MT) Forecast By Market Taxonomy, 2022 to 2032

        9.2.1. By Country

            9.2.1.1. Germany

            9.2.1.2. Italy

            9.2.1.3. France

            9.2.1.4. The UK

            9.2.1.5. Spain

            9.2.1.6. Russia

            9.2.1.7. BENELUX

            9.2.1.8. Poland

            9.2.1.9. Nordic Countries

            9.2.1.10. Rest of Europe

        9.2.2. By Product Type

    9.3. Market Attractiveness Analysis

        9.3.1. By Country

        9.3.2. By Product Type

    9.4. Key Takeaways

10. East Asia Market Analysis 2017 to 2021 and Forecast 2022 to 2032, By Country

    10.1. Historical Market Size Value (US$ Mn) & Volume (MT) Trend Analysis By Market Taxonomy, 2017 to 2021

    10.2. Market Size Value (US$ Mn) & Volume (MT) Forecast By Market Taxonomy, 2022 to 2032

        10.2.1. By Country

            10.2.1.1. China

            10.2.1.2. Japan

            10.2.1.3. South Korea

        10.2.2. By Product Type

    10.3. Market Attractiveness Analysis

        10.3.1. By Country

        10.3.2. By Product Type

    10.4. Key Takeaways

11. South Asia Market Analysis 2017 to 2021 and Forecast 2022 to 2032, By Country

    11.1. Historical Market Size Value (US$ Mn) & Volume (MT) Trend Analysis By Market Taxonomy, 2017 to 2021

    11.2. Market Size Value (US$ Mn) & Volume (MT) Forecast By Market Taxonomy, 2022 to 2032

        11.2.1. By Country

            11.2.1.1. India

            11.2.1.2. Thailand

            11.2.1.3. Malaysia

            11.2.1.4. Indonesia

            11.2.1.5. Singapore

            11.2.1.6. Rest of South Asia

        11.2.2. By Product Type

    11.3. Market Attractiveness Analysis

        11.3.1. By Country

        11.3.2. By Product Type

    11.4. Key Takeaways

12. Oceania Market Analysis 2017 to 2021 and Forecast 2022 to 2032, By Country

    12.1. Historical Market Size Value (US$ Mn) & Volume (MT) Trend Analysis By Market Taxonomy, 2017 to 2021

    12.2. Market Size Value (US$ Mn) & Volume (MT) Forecast By Market Taxonomy, 2022 to 2032

        12.2.1. By Country

            12.2.1.1. Australia

            12.2.1.2. New Zealand

        12.2.2. By Product Type

    12.3. Market Attractiveness Analysis

        12.3.1. By Country

        12.3.2. By Product Type

    12.4. Key Takeaways

13. MEA Market Analysis 2017 to 2021 and Forecast 2022 to 2032, By Country

    13.1. Historical Market Size Value (US$ Mn) & Volume (MT) Trend Analysis By Market Taxonomy, 2017 to 2021

    13.2. Market Size Value (US$ Mn) & Volume (MT) Forecast By Market Taxonomy, 2022 to 2032

        13.2.1. By Country

            13.2.1.1. GCC Countries

            13.2.1.2. South Africa

            13.2.1.3. Central Africa

            13.2.1.4. North Africa

        13.2.2. By Product Type

    13.3. Market Attractiveness Analysis

        13.3.1. By Country

        13.3.2. By Product Type

    13.4. Key Takeaways

14. Key Countries Market Analysis

    14.1. The US

        14.1.1. Pricing Analysis

        14.1.2. Market Share Analysis, 2021

            14.1.2.1. By Product Type

    14.2. Canada

        14.2.1. Pricing Analysis

        14.2.2. Market Share Analysis, 2021

            14.2.2.1. By Product Type

    14.3. Brazil

        14.3.1. Pricing Analysis

        14.3.2. Market Share Analysis, 2021

            14.3.2.1. By Product Type

    14.4. Mexico

        14.4.1. Pricing Analysis

        14.4.2. Market Share Analysis, 2021

            14.4.2.1. By Product Type

    14.5. Argentina

        14.5.1. Pricing Analysis

        14.5.2. Market Share Analysis, 2021

            14.5.2.1. By Product Type

    14.6. Chile

        14.6.1. Pricing Analysis

        14.6.2. Market Share Analysis, 2021

            14.6.2.1. By Product Type

    14.7. Peru

        14.7.1. Pricing Analysis

        14.7.2. Market Share Analysis, 2021

            14.7.2.1. By Product Type

    14.8. Germany

        14.8.1. Pricing Analysis

        14.8.2. Market Share Analysis, 2021

            14.8.2.1. By Product Type

    14.9. Italy

        14.9.1. Pricing Analysis

        14.9.2. Market Share Analysis, 2021

            14.9.2.1. By Product Type

    14.10. France

        14.10.1. Pricing Analysis

        14.10.2. Market Share Analysis, 2021

            14.10.2.1. By Product Type

    14.11. Spain

        14.11.1. Pricing Analysis

        14.11.2. Market Share Analysis, 2021

            14.11.2.1. By Product Type

    14.12. The UK

        14.12.1. Pricing Analysis

        14.12.2. Market Share Analysis, 2021

            14.12.2.1. By Product Type

    14.13. Russia

        14.13.1. Pricing Analysis

        14.13.2. Market Share Analysis, 2021

            14.13.2.1. By Product Type

    14.14. Poland

        14.14.1. Pricing Analysis

        14.14.2. Market Share Analysis, 2021

            14.14.2.1. By Product Type

    14.15. BENELUX

        14.15.1. Pricing Analysis

        14.15.2. Market Share Analysis, 2021

            14.15.2.1. By Product Type

    14.16. Nordic Countries

        14.16.1. Pricing Analysis

        14.16.2. Market Share Analysis, 2021

            14.16.2.1. By Product Type

    14.17. China

        14.17.1. Pricing Analysis

        14.17.2. Market Share Analysis, 2021

            14.17.2.1. By Product Type

    14.18. Japan

        14.18.1. Pricing Analysis

        14.18.2. Market Share Analysis, 2021

            14.18.2.1. By Product Type

    14.19. South Korea

        14.19.1. Pricing Analysis

        14.19.2. Market Share Analysis, 2021

            14.19.2.1. By Product Type

    14.20. India

        14.20.1. Pricing Analysis

        14.20.2. Market Share Analysis, 2021

            14.20.2.1. By Product Type

    14.21. Thailand

        14.21.1. Pricing Analysis

        14.21.2. Market Share Analysis, 2021

            14.21.2.1. By Product Type

    14.22. Indonesia

        14.22.1. Pricing Analysis

        14.22.2. Market Share Analysis, 2021

            14.22.2.1. By Product Type

    14.23. Malaysia

        14.23.1. Pricing Analysis

        14.23.2. Market Share Analysis, 2021

            14.23.2.1. By Product Type

    14.24. Singapore

        14.24.1. Pricing Analysis

        14.24.2. Market Share Analysis, 2021

            14.24.2.1. By Product Type

    14.25. Australia

        14.25.1. Pricing Analysis

        14.25.2. Market Share Analysis, 2021

            14.25.2.1. By Product Type

    14.26. New Zealand

        14.26.1. Pricing Analysis

        14.26.2. Market Share Analysis, 2021

            14.26.2.1. By Product Type

    14.27. GCC Countries

        14.27.1. Pricing Analysis

        14.27.2. Market Share Analysis, 2021

            14.27.2.1. By Product Type

    14.28. South Africa

        14.28.1. Pricing Analysis

        14.28.2. Market Share Analysis, 2021

            14.28.2.1. By Product Type

    14.29. North Africa

        14.29.1. Pricing Analysis

        14.29.2. Market Share Analysis, 2021

            14.29.2.1. By Product Type

    14.30. Central Africa

        14.30.1. Pricing Analysis

        14.30.2. Market Share Analysis, 2021

            14.30.2.1. By Product Type

15. Market Structure Analysis

    15.1. Competition Dashboard

    15.2. Competition Benchmarking

    15.3. Market Share Analysis of Top Players

        15.3.1. By Regional

        15.3.2. By Product Type

16. Competition Analysis

    16.1. Competition Deep Dive

        16.1.1. Fever-Tree

            16.1.1.1. Overview

            16.1.1.2. Product Portfolio

            16.1.1.3. Profitability by Market Segments (Product Type / Region)

            16.1.1.4. Sales Footprint

            16.1.1.5. Strategy Overview

                16.1.1.5.1. Marketing Strategy

                16.1.1.5.2. Product Strategy

                16.1.1.5.3. Channel Strategy

        16.1.2. The London Essence Company

            16.1.2.1. Overview

            16.1.2.2. Product Portfolio

            16.1.2.3. Profitability by Market Segments (Product Type / Region)

            16.1.2.4. Sales Footprint

            16.1.2.5. Strategy Overview

                16.1.2.5.1. Marketing Strategy

                16.1.2.5.2. Product Strategy

                16.1.2.5.3. Channel Strategy

        16.1.3. Keurig Dr Pepper, Inc.

            16.1.3.1. Overview

            16.1.3.2. Product Portfolio

            16.1.3.3. Profitability by Market Segments (Product Type / Region)

            16.1.3.4. Sales Footprint

            16.1.3.5. Strategy Overview

                16.1.3.5.1. Marketing Strategy

                16.1.3.5.2. Product Strategy

                16.1.3.5.3. Channel Strategy

        16.1.4. The Coca-Cola Company

            16.1.4.1. Overview

            16.1.4.2. Product Portfolio

            16.1.4.3. Profitability by Market Segments (Product Type / Region)

            16.1.4.4. Sales Footprint

            16.1.4.5. Strategy Overview

                16.1.4.5.1. Marketing Strategy

                16.1.4.5.2. Product Strategy

                16.1.4.5.3. Channel Strategy

        16.1.5. THOMAS HENRY GMBH

            16.1.5.1. Overview

            16.1.5.2. Product Portfolio

            16.1.5.3. Profitability by Market Segments (Product Type / Region)

            16.1.5.4. Sales Footprint

            16.1.5.5. Strategy Overview

                16.1.5.5.1. Marketing Strategy

                16.1.5.5.2. Product Strategy

                16.1.5.5.3. Channel Strategy

        16.1.6. East Imperial

            16.1.6.1. Overview

            16.1.6.2. Product Portfolio

            16.1.6.3. Profitability by Market Segments (Product Type / Region)

            16.1.6.4. Sales Footprint

            16.1.6.5. Strategy Overview

                16.1.6.5.1. Marketing Strategy

                16.1.6.5.2. Product Strategy

                16.1.6.5.3. Channel Strategy

        16.1.7. Fentimans

            16.1.7.1. Overview

            16.1.7.2. Product Portfolio

            16.1.7.3. Profitability by Market Segments (Product Type / Region)

            16.1.7.4. Sales Footprint

            16.1.7.5. Strategy Overview

                16.1.7.5.1. Marketing Strategy

                16.1.7.5.2. Product Strategy

                16.1.7.5.3. Channel Strategy

        16.1.8. Q MIXERS

            16.1.8.1. Overview

            16.1.8.2. Product Portfolio

            16.1.8.3. Profitability by Market Segments (Product Type / Region)

            16.1.8.4. Sales Footprint

            16.1.8.5. Strategy Overview

                16.1.8.5.1. Marketing Strategy

                16.1.8.5.2. Product Strategy

                16.1.8.5.3. Channel Strategy

        16.1.9. Britvic

            16.1.9.1. Overview

            16.1.9.2. Product Portfolio

            16.1.9.3. Profitability by Market Segments (Product Type / Region)

            16.1.9.4. Sales Footprint

            16.1.9.5. Strategy Overview

                16.1.9.5.1. Marketing Strategy

                16.1.9.5.2. Product Strategy

                16.1.9.5.3. Channel Strategy

        16.1.10. White Rock Products Corporation

            16.1.10.1. Overview

            16.1.10.2. Product Portfolio

            16.1.10.3. Profitability by Market Segments (Product Type / Region)

            16.1.10.4. Sales Footprint

            16.1.10.5. Strategy Overview

                16.1.10.5.1. Marketing Strategy

                16.1.10.5.2. Product Strategy

                16.1.10.5.3. Channel Strategy

        16.1.11. Bartisans

            16.1.11.1. Overview

            16.1.11.2. Product Portfolio

            16.1.11.3. Profitability by Market Segments (Product Type / Region)

            16.1.11.4. Sales Footprint

            16.1.11.5. Strategy Overview

                16.1.11.5.1. Marketing Strategy

                16.1.11.5.2. Product Strategy

                16.1.11.5.3. Channel Strategy

        16.1.12. Three Cents

            16.1.12.1. Overview

            16.1.12.2. Product Portfolio

            16.1.12.3. Profitability by Market Segments (Product Type / Region)

            16.1.12.4. Sales Footprint

            16.1.12.5. Strategy Overview

                16.1.12.5.1. Marketing Strategy

                16.1.12.5.2. Product Strategy

                16.1.12.5.3. Channel Strategy

17. Assumptions & Acronyms Used

18. Research Methodology

Don't pay for what you don't need

Customize your report by selecting specific countries or regions and save 30%!

List of Tables

Table 1: Global Market Value (US$ Million) Forecast by Region, 2017 to 2032

Table 2: Global Market Volume (MT) Forecast by Region, 2017 to 2032

Table 3: Global Market Value (US$ Million) Forecast by Product Type, 2017 to 2032

Table 4: Global Market Volume (MT) Forecast by Product Type, 2017 to 2032

Table 5: North America Market Value (US$ Million) Forecast by Country, 2017 to 2032

Table 6: North America Market Volume (MT) Forecast by Country, 2017 to 2032

Table 7: North America Market Value (US$ Million) Forecast by Product Type, 2017 to 2032

Table 8: North America Market Volume (MT) Forecast by Product Type, 2017 to 2032

Table 9: Latin America Market Value (US$ Million) Forecast by Country, 2017 to 2032

Table 10: Latin America Market Volume (MT) Forecast by Country, 2017 to 2032

Table 11: Latin America Market Value (US$ Million) Forecast by Product Type, 2017 to 2032

Table 12: Latin America Market Volume (MT) Forecast by Product Type, 2017 to 2032

Table 13: Europe Market Value (US$ Million) Forecast by Country, 2017 to 2032

Table 14: Europe Market Volume (MT) Forecast by Country, 2017 to 2032

Table 15: Europe Market Value (US$ Million) Forecast by Product Type, 2017 to 2032

Table 16: Europe Market Volume (MT) Forecast by Product Type, 2017 to 2032

Table 17: East Asia Market Value (US$ Million) Forecast by Country, 2017 to 2032

Table 18: East Asia Market Volume (MT) Forecast by Country, 2017 to 2032

Table 19: East Asia Market Value (US$ Million) Forecast by Product Type, 2017 to 2032

Table 20: East Asia Market Volume (MT) Forecast by Product Type, 2017 to 2032

Table 21: South Asia Market Value (US$ Million) Forecast by Country, 2017 to 2032

Table 22: South Asia Market Volume (MT) Forecast by Country, 2017 to 2032

Table 23: South Asia Market Value (US$ Million) Forecast by Product Type, 2017 to 2032

Table 24: South Asia Market Volume (MT) Forecast by Product Type, 2017 to 2032

Table 25: Oceania Market Value (US$ Million) Forecast by Country, 2017 to 2032

Table 26: Oceania Market Volume (MT) Forecast by Country, 2017 to 2032

Table 27: Oceania Market Value (US$ Million) Forecast by Product Type, 2017 to 2032

Table 28: Oceania Market Volume (MT) Forecast by Product Type, 2017 to 2032

Table 29: MEA Market Value (US$ Million) Forecast by Country, 2017 to 2032

Table 30: MEA Market Volume (MT) Forecast by Country, 2017 to 2032

Table 31: MEA Market Value (US$ Million) Forecast by Product Type, 2017 to 2032

Table 32: MEA Market Volume (MT) Forecast by Product Type, 2017 to 2032
Nandini Roy Choudhury

Principal Consultant

Talk to Analyst

Find your sweet spots for generating winning opportunities in this market.

List of Charts

Figure 1: Global Market Value (US$ Million) by Product Type, 2022 to 2032

Figure 2: Global Market Value (US$ Million) by Region, 2022 to 2032

Figure 3: Global Market Value (US$ Million) Analysis by Region, 2017 to 2032

Figure 4: Global Market Volume (MT) Analysis by Region, 2017 to 2032

Figure 5: Global Market Value Share (%) and BPS Analysis by Region, 2022 to 2032

Figure 6: Global Market Y-o-Y Growth (%) Projections by Region, 2022 to 2032

Figure 7: Global Market Value (US$ Million) Analysis by Product Type, 2017 to 2032

Figure 8: Global Market Volume (MT) Analysis by Product Type, 2017 to 2032

Figure 9: Global Market Value Share (%) and BPS Analysis by Product Type, 2022 to 2032

Figure 10: Global Market Y-o-Y Growth (%) Projections by Product Type, 2022 to 2032

Figure 11: Global Market Attractiveness by Product Type, 2022 to 2032

Figure 12: Global Market Attractiveness by Region, 2022 to 2032

Figure 13: North America Market Value (US$ Million) by Product Type, 2022 to 2032

Figure 14: North America Market Value (US$ Million) by Country, 2022 to 2032

Figure 15: North America Market Value (US$ Million) Analysis by Country, 2017 to 2032

Figure 16: North America Market Volume (MT) Analysis by Country, 2017 to 2032

Figure 17: North America Market Value Share (%) and BPS Analysis by Country, 2022 to 2032

Figure 18: North America Market Y-o-Y Growth (%) Projections by Country, 2022 to 2032

Figure 19: North America Market Value (US$ Million) Analysis by Product Type, 2017 to 2032

Figure 20: North America Market Volume (MT) Analysis by Product Type, 2017 to 2032

Figure 21: North America Market Value Share (%) and BPS Analysis by Product Type, 2022 to 2032

Figure 22: North America Market Y-o-Y Growth (%) Projections by Product Type, 2022 to 2032

Figure 23: North America Market Attractiveness by Product Type, 2022 to 2032

Figure 24: North America Market Attractiveness by Country, 2022 to 2032

Figure 25: Latin America Market Value (US$ Million) by Product Type, 2022 to 2032

Figure 26: Latin America Market Value (US$ Million) by Country, 2022 to 2032

Figure 27: Latin America Market Value (US$ Million) Analysis by Country, 2017 to 2032

Figure 28: Latin America Market Volume (MT) Analysis by Country, 2017 to 2032

Figure 29: Latin America Market Value Share (%) and BPS Analysis by Country, 2022 to 2032

Figure 30: Latin America Market Y-o-Y Growth (%) Projections by Country, 2022 to 2032

Figure 31: Latin America Market Value (US$ Million) Analysis by Product Type, 2017 to 2032

Figure 32: Latin America Market Volume (MT) Analysis by Product Type, 2017 to 2032

Figure 33: Latin America Market Value Share (%) and BPS Analysis by Product Type, 2022 to 2032

Figure 34: Latin America Market Y-o-Y Growth (%) Projections by Product Type, 2022 to 2032

Figure 35: Latin America Market Attractiveness by Product Type, 2022 to 2032

Figure 36: Latin America Market Attractiveness by Country, 2022 to 2032

Figure 37: Europe Market Value (US$ Million) by Product Type, 2022 to 2032

Figure 38: Europe Market Value (US$ Million) by Country, 2022 to 2032

Figure 39: Europe Market Value (US$ Million) Analysis by Country, 2017 to 2032

Figure 40: Europe Market Volume (MT) Analysis by Country, 2017 to 2032

Figure 41: Europe Market Value Share (%) and BPS Analysis by Country, 2022 to 2032

Figure 42: Europe Market Y-o-Y Growth (%) Projections by Country, 2022 to 2032

Figure 43: Europe Market Value (US$ Million) Analysis by Product Type, 2017 to 2032

Figure 44: Europe Market Volume (MT) Analysis by Product Type, 2017 to 2032

Figure 45: Europe Market Value Share (%) and BPS Analysis by Product Type, 2022 to 2032

Figure 46: Europe Market Y-o-Y Growth (%) Projections by Product Type, 2022 to 2032

Figure 47: Europe Market Attractiveness by Product Type, 2022 to 2032

Figure 48: Europe Market Attractiveness by Country, 2022 to 2032

Figure 49: East Asia Market Value (US$ Million) by Product Type, 2022 to 2032

Figure 50: East Asia Market Value (US$ Million) by Country, 2022 to 2032

Figure 51: East Asia Market Value (US$ Million) Analysis by Country, 2017 to 2032

Figure 52: East Asia Market Volume (MT) Analysis by Country, 2017 to 2032

Figure 53: East Asia Market Value Share (%) and BPS Analysis by Country, 2022 to 2032

Figure 54: East Asia Market Y-o-Y Growth (%) Projections by Country, 2022 to 2032

Figure 55: East Asia Market Value (US$ Million) Analysis by Product Type, 2017 to 2032

Figure 56: East Asia Market Volume (MT) Analysis by Product Type, 2017 to 2032

Figure 57: East Asia Market Value Share (%) and BPS Analysis by Product Type, 2022 to 2032

Figure 58: East Asia Market Y-o-Y Growth (%) Projections by Product Type, 2022 to 2032

Figure 59: East Asia Market Attractiveness by Product Type, 2022 to 2032

Figure 60: East Asia Market Attractiveness by Country, 2022 to 2032

Figure 61: South Asia Market Value (US$ Million) by Product Type, 2022 to 2032

Figure 62: South Asia Market Value (US$ Million) by Country, 2022 to 2032

Figure 63: South Asia Market Value (US$ Million) Analysis by Country, 2017 to 2032

Figure 64: South Asia Market Volume (MT) Analysis by Country, 2017 to 2032

Figure 65: South Asia Market Value Share (%) and BPS Analysis by Country, 2022 to 2032

Figure 66: South Asia Market Y-o-Y Growth (%) Projections by Country, 2022 to 2032

Figure 67: South Asia Market Value (US$ Million) Analysis by Product Type, 2017 to 2032

Figure 68: South Asia Market Volume (MT) Analysis by Product Type, 2017 to 2032

Figure 69: South Asia Market Value Share (%) and BPS Analysis by Product Type, 2022 to 2032

Figure 70: South Asia Market Y-o-Y Growth (%) Projections by Product Type, 2022 to 2032

Figure 71: South Asia Market Attractiveness by Product Type, 2022 to 2032

Figure 72: South Asia Market Attractiveness by Country, 2022 to 2032

Figure 73: Oceania Market Value (US$ Million) by Product Type, 2022 to 2032

Figure 74: Oceania Market Value (US$ Million) by Country, 2022 to 2032

Figure 75: Oceania Market Value (US$ Million) Analysis by Country, 2017 to 2032

Figure 76: Oceania Market Volume (MT) Analysis by Country, 2017 to 2032

Figure 77: Oceania Market Value Share (%) and BPS Analysis by Country, 2022 to 2032

Figure 78: Oceania Market Y-o-Y Growth (%) Projections by Country, 2022 to 2032

Figure 79: Oceania Market Value (US$ Million) Analysis by Product Type, 2017 to 2032

Figure 80: Oceania Market Volume (MT) Analysis by Product Type, 2017 to 2032

Figure 81: Oceania Market Value Share (%) and BPS Analysis by Product Type, 2022 to 2032

Figure 82: Oceania Market Y-o-Y Growth (%) Projections by Product Type, 2022 to 2032

Figure 83: Oceania Market Attractiveness by Product Type, 2022 to 2032

Figure 84: Oceania Market Attractiveness by Country, 2022 to 2032

Figure 85: MEA Market Value (US$ Million) by Product Type, 2022 to 2032

Figure 86: MEA Market Value (US$ Million) by Country, 2022 to 2032

Figure 87: MEA Market Value (US$ Million) Analysis by Country, 2017 to 2032

Figure 88: MEA Market Volume (MT) Analysis by Country, 2017 to 2032

Figure 89: MEA Market Value Share (%) and BPS Analysis by Country, 2022 to 2032

Figure 90: MEA Market Y-o-Y Growth (%) Projections by Country, 2022 to 2032

Figure 91: MEA Market Value (US$ Million) Analysis by Product Type, 2017 to 2032

Figure 92: MEA Market Volume (MT) Analysis by Product Type, 2017 to 2032

Figure 93: MEA Market Value Share (%) and BPS Analysis by Product Type, 2022 to 2032

Figure 94: MEA Market Y-o-Y Growth (%) Projections by Product Type, 2022 to 2032

Figure 95: MEA Market Attractiveness by Product Type, 2022 to 2032

Figure 96: MEA Market Attractiveness by Country, 2022 to 2032

Recommendations

Food and Beverage

RTD Canned Cocktail Market

Published : April 2023

Food and Beverage

Soft Drinks Concentrates Market

Published : October 2022

Food and Beverage

RTD Bottled Cocktails Market

Published : July 2022

Food and Beverage

Drinkable Yogurt Market

Published : June 2022

Explore Food and Beverage Insights

View Reports

Commercial Drink Mixers Market