Reports

- Global Locations -

Headquarters

Future Market Insights, Inc.

Christiana Corporate, 200
Continental Drive, Suite 401,
Newark, Delaware - 19713,
United States

T: +1-845-579-5705

Americas

Future Market Insights, Inc.

616 Corporate Way, Suite 2-9018,
Valley Cottage, NY 10989, United States

T: +1-347-918-3531

MEA

Future Market Insights

1602-6 Jumeirah Bay X2 Tower, Plot No: JLT-PH2-X2A,
Jumeirah Lakes Towers, Dubai,
United Arab Emirates

Europe

Future Market Insights

3rd Floor, 207 Regent Street,
W1B 3HH London
United Kingdom

T: + 44 (0) 20 8123 9659
D: +44 (0) 20 3287 4268

Asia Pacific

Future Market Insights

IndiaLand Global Tech Park, Unit UG-1, Behind Grand HighStreet, Phase 1, Hinjawadi, MH, Pune – 411057, India

Commercial Griddle Market: A Synopsis of Market Crescendos (2023 to 2033)

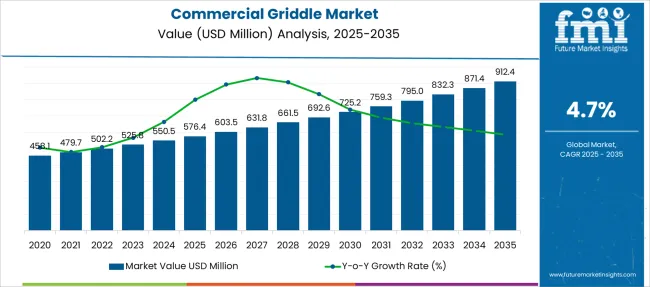
The global commercial griddle market is estimated to develop at a moderate CAGR of 4.7% during the forecast period. The present-day value of this market is US$ 525.8 million in 2023. By 2033, the commercial griddle market is estimated to reach US$ 834.2 million. Researchers from Future Market Insights discovered a historical market valuation of US$ 496.0 million for the studied market during the base year when the market expanded at a CAGR of 3.7%.

Report Attribute Details
Commercial Griddle Market Value (2023) US$ 525.8 Million
Commercial Griddle Market Anticipated Value (2033) US$ 834.2 Million
Commercial Griddle Market Projected Growth Rate (2023 to 2033) 4.7%
Commercial Griddle Market Historical Growth Rate (2017 to 2022) 3.7%

The adoption of griddles is increasing among consumers, resulting in market expansion. This expansion is facilitated by the following factors:

  • Commercial griddles typically deliver uniform heating throughout the whole griddle plate surface, allowing for consistently high-quality food preparation.
  • Heat-setting modification options in commercial griddles aid in cooking fresh food at exact temperatures, reducing the risk of overcooking in commercial kitchens.
  • There is a rising emphasis on maximizing productivity in commercial kitchens, in addition to focusing on energy-efficient cooking alternatives.
  • Rising premium product acceptance across categories and desire for technically advanced attributes such as compactness and convenience.
  • The increased popularity of outdoor cooking has resulted in a rise in demand for commercial outdoor griddle from the residential sector.
  • The growing need for hyper-convenience has aided the market expansion of commercial electric griddle.
  • Large commercial griddles are commonly used in hotels, restaurants, and cafés since they are the flexible and multifunctional appliance that is suitable for cooking.
  • Consumers choose commercial griddles with thermostat controls since they give the functionality to alter the temperature accordingly and let the consumer set the correct cooking temperature for different foods according to their specific requirements.
  • The manufacturers are now focusing on expanding their best commercial griddle product line to provide items that best meet the demands of household and commercial cooks.
  • The competitors are pushing their griddles as nonstick and Energy Star-certified items, which indicates that the griddles are much more fuel-intensive, assuring high manufacturing capability.

Don't pay for what you don't need

Customize your report by selecting specific countries or regions and save 30%!

Growing Demand for Quick Meal Formats is Creating Market Buzz for Commercial Griddle - A Snowball Effect

A commercial griddle is a flat surface used for cooking meals. It is often composed of metal and has a huge surface area, making it ideal for cooking huge portions of food in one go. Commercial ovens with griddle are frequently used in restaurants to cook dishes such as pancakes, eggs, bacon, sausages, and so on. According to FMI data, these types of meals are getting more popular among audiences in different countries. Given the rising demand for these foods, several manufacturers have included novel features in commercial griddle. Here are some trends and possibilities in the commercial griddle market:

  • Consumers are increasingly choosing food products that are simple and quick to prepare due to their hurried lifestyles and stressful schedules.
  • Rising demand for cooking equipment with novel and advanced features in terms of capacity, energy consumption, and pricing is prompting manufacturers to introduce new and advanced-featured griddles at energy-efficient and cost-effective rates.
  • The shifting desires for griddles are driving the popularity of commercial flat top grill with oven.
  • Aside from the food service industry, the catering industry is increasing its requirement for restaurant griddles.
  • Technology such as three heating zones and automated temperature management is becoming increasingly popular in the market.
  • It might be inconvenient to have a separate air fryer, griddle, or equipment to help with sous vide, thus manufacturers are now merging several functionalities into single products.

Glimpse of the Historical Market Scenario and Current Growth Indicators

FMI specialists revealed that the commercial griddle market has undergone outstanding development in recent years after performing in-depth market research. Following an in-depth market investigation, FMI analysts revealed that the commercial griddle industry has undergone outstanding development in recent years. The studied market CAGR increased gradually from 3.7% between 2017 and 2022 to 4.7% between 2023 and 2033. There is an approximate rise of US$ 308.4 million surge in the total market value from 2022 to 2023.

A griddle is commercial and home culinary equipment with a large flat surface heated by electricity, gas, wood, or coal. Complete health, sustainability, convenience, and innovation are all elements that are predicted to influence customer dietary habits in the upcoming years. At the moment, griddles are having a moment.Commercial kitchen griddle is a fantastic choice for fajitas, grilled sandwiches, and hamburgers apart from regular food items like pancakes, sausages, bacon, eggs, hash browns, and French toast. Griddles have a lengthy and colorful past. They originated from a time before ovens were a widespread fixture in houses when chefs utilized flat-top grills made of brick, stone, or clay.

Griddle cooking, as opposed to the more conventional cooking methods given by charcoal, gas, and pellet grills, is helping to redefine the quickly growing outdoor cooking sector by giving consumers a speedier, more convenient, more diverse cooking experience. The ability to cook breakfast, lunch, and supper outside has been made available by manufacturers to home cooks of all skill levels. In comparison to other outdoor cooking methods, griddling has higher customer engagement, which enables manufacturers to quickly enter the traditional outdoor cooking market and expand the overall category. This is because it enables consumers to cook outdoors more frequently and for more meal occasions.

At present, people are just cooking more at home and rediscovering the versatility of a traditional griddle, which has contributed significantly to their appeal. They prepare these foods at home with the help of a commercial indoor grill instead of getting grilled cheese at the neighborhood lunch place or pancakes at the restaurant, and griddle kitchen equipment is a very helpful appliance. On the other hand, Cooking in the backyard or outdoors is becoming increasingly popular and fashionable. The development of outdoor cooking tools like griddles has been significantly fueled by this new trend. The idea of outdoor cooking is quite well-known in western nations. Through the decades, the forefathers have engaged in this ritual of outdoor cooking. On holidays and other special occasions, people like to cook outside. These customs of cooking outside are also gradually gaining popularity. During the anticipated years, these customs are promoting market expansion.

Nandini Roy Choudhury

Principal Consultant

Talk to Analyst

Find your sweet spots for generating winning opportunities in this market.

Comparative Analysis of Adjacent Markets

Commercial Griddle Market:

Differentiating Aspects Commercial Griddle Market
CAGR 4.7%
Market Valuation in 2023 US$ 525.8 million
Projected Market Value in 2033 US$ 834.2 million
Drivers
  • Commercial griddles generally provide even heating throughout the whole griddle plate surface, allowing the preparation of high-quality meals continually.
  • Three heating zones and automatic temperature control are two technological innovations that are gaining popularity.
  • Commercial electric griddle sales have increased as a result of the increasing need of consumers for hyper-convenience.

Commercial Charbroiler Market:

Differentiating Aspects Commercial Charbroiler Market
CAGR 4.6%
Market Valuation in 2023 US$ 785 Million
Projected Market Value in 2033 US$ 1,230 Million
Drivers
  • The spike in the number of dining outlets offering charbroiled dishes is closely correlated with an increase in demand for commercial charbroilers.
  • Particularly among meat lovers, grilled cuisine is becoming more and more popular.
  • Changes in lifestyles and a rise in the usage of high-end appliances for both indoor and outdoor cooking.

Electric Grills Market:

Differentiating Aspects Electric Grills Market
CAGR 5.5%
Market Valuation in 2023 US$ 4.64 Billion
Projected Market Value in 2033 US$ 7.93 Billion
Drivers
  • People now have a preference for electric grills over charcoal ones because of increasing environmental apprehensions.
  • Grilled food is becoming more and more well-liked, which is driving up demand for electric grill possession globally.
  • With their uniformly heated surface, electrical grills simplify cooking and aid in the consistent heating of meals.

Category-wise Insights

Domineering Segments Gaining Reputation in Light of Individual Rudiments

Table Top - By Top Installation Type

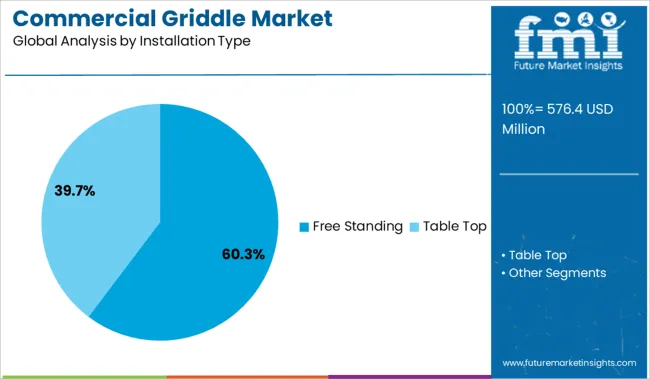
Based on top installation type, the commercial griddle market is bifurcated into free-standing and table-top. During the forecast period, the tabletop category is expected to hold the biggest market share across the world, according to FMI. This segment is currently expanding fast and efficiently, at a CAGR of 5.0%. From 2017 to 2022, the category recorded a CAGR of 4.2% historically. The following elements are fueling the market expansion:

  • Even while a tabletop oven needs to occupy a little amount of counter space, they really wind up conserving a lot more room than a regular oven would. As long as there is an outlet for it to be plugged into, a tabletop oven can be put on whichever countertop the user chooses.
  • Since tabletop ovens are more compact and powerful, they require less electricity to cook food, which reduces monthly power expenditure.
  • A tabletop oven has functionality that is quite comparable to that of conventional ovens and is also very simple to operate.
  • Cleaning a tabletop oven only requires wiping down the interior and the crumb tray. Additionally, it costs less to maintain them so that they are continually working.

Flat - By Top Plate Type

As far as the top plate type is concerned, the commercial griddle market is categorized into flat, ribbed, and mixed. Given that it is the most popular product among consumers in these categories, the flat sector has the largest market share. Currently, the CAGR for the flat category is predicted to be 4.4%, which would indicate rapid growth. The category accounted for a CAGR of 3.5% over the reference period of 2017 to 2022. Development of commercial flat-top griddle has continued due to the following factors:
  • Flat plates are frequently used because they can easily prepare a variety of foods such as eggs, bacon, pancakes, and French toast.
  • The flat cooktop heats up rapidly, allowing users to easily regulate the power to cook meals speedily or gradually.
  • The flat-top griddle allows for the preparation of any food without the need for extra fat or oil.
  • Many people utilize them in outdoor dining islands as associate ovens next to built-in grills.
  • With the aid of a flat commercial griddle, individuals include everyone at backyard gatherings to gather people around the griddle for a teppanyaki grill session.

Get the data you need at a Fraction of the cost

Personalize your report by choosing insights you need
and save 40%!

Country-wise Insights

Exposition of the Methods Used by Different Nations that Aid Commercial Griddle to Sell Like Hot Cakes!

Country United States
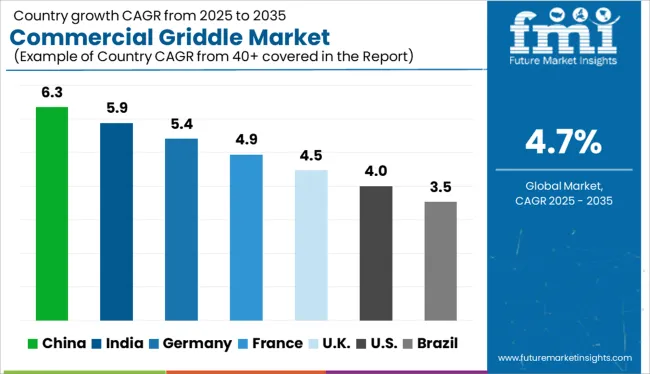
Statistics The commercial griddle market in North America is still dominated by the United States. By the end of 2033, the market is expected to have a US$ 208.5 million valuation. In the historical and projection periods, the CAGR for the United States commercial griddle market was 4.4% and 5.2%, respectively. From the base year to the present, there has been an increase of almost US$ 82.4 million.
Growth propellants These factors explain the growing market dominance:
  • Modern griddles have benefited from the introduction of new technologies in this region.
  • Growing griddle usage has aided regional griddles market expansion in the US since there is a significant demand for griddles from both the commercial and residential sectors.
  • Millennials in particular are driving up demand for healthy eating alternatives.
  • Products are widely available at retail establishments. Due to an increase in demand for the same, manufacturers are focusing on improving their products and raising their quality.
Country United Kingdom
Statistics A substantial portion of the commercial griddle industry is believed to be controlled by Europe. The U.K. commercial griddle market is currently growing at a rapid CAGR of 6.4%, compared to a historical CAGR of only 3.7%. By 2033, it is anticipated that the market valuation would exceed US$ 58.40 million. From the base year to the present, there has been an about US$ 26.80 million increase.
Growth propellants The following factors help drive market expansion in the UK:
  • Technical breakthroughs, a large manufacturing sector, and an increase in demand for vegan cuisine.
  • Larger adoption of indoor and outdoor courtyards barbeques.
  • Mounting awareness of the health advantages of utilizing electric griddles
Country China
Statistics The Chinese commercial griddle market is predicted to grow at a CAGR of 6.2% during the forecast period. Historically, this market's CAGR was 3.7%. By 2033, the experts at FMI expect the market to be worth US$ 125.1 million. From the base year to the present, there has been an about US$ 56.7 million increase.
Growth propellants The following are some of the elements contributing to the market growth in China:
  • Griddles are selling better online because of growing e-Commerce adoption.
  • Production of commercial goods and inventions related to electric countertop griddles
  • Restaurants and hotels are opening up more often, which is related to the adoption of commercial griddles.
Country Japan
Statistics Japan is anticipated to grow moderately, with a CAGR of 4.9% during the projection period, up from 3.7% over the historical period. By the end of 2033, the value is expected to exceed $52.5 million, according to FMI. From previous years to the present, there has been an about US$ 19.9 million increase.
Growth propellants Factors contributing to the growth of the Japanese commercial griddle market are:
  • The changing preferences in the industry of food service from conventional to contemporary cooking apparatus.
  • Increasing expenditures made in extending their commercial activities by multinational players
  • A growing inclination among consumers for healthier eating alternatives

Start-up Ecosystem

Developing Businesses Add an Advantage to the Commercial Griddle Market Diminuendos

Utilizing technological advancements, new players in the commercial griddle market are introducing novel products and gaining a competitive edge. To keep up with shifting consumer preferences and end-use sector expectations, these businesses continually make investments in Research and Development (R&D). The commercial griddle sector is being supported by efforts to strengthen its position in the forum.

Top Start-ups to Watch For

Start-up Company June
Country United States
Description The first company to provide smart top ovens online in June. The oven's sensors automatically set the temperature after determining the weight. Its app offers features including meal planning, video monitoring, and intelligent notifications. Users of iOS and Android devices can download the app.
Start-up Company Pune Kitchen
Country India
Description An established brand from Pune is Pune Kitchen. Pune Kitchen, established in the year 2006, is one of the well-known producers and exporters of a wide range of kitchen appliances for both domestic and commercial settings, with projects done across India. We deal with a variety of goods. such as kitchen equipment, commercial chimneys, exhaust hoods, residential kitchen equipment, Hot Brian Marie, Wadapav Counter Hotel Table, Deep Fat Fryers, Dough Kneader, Tandoor, Washing Sink, Wet Masala Grinder, Bulk Cooker, Tilting Braising Pan, Sandwich Griller, Steam Cooking Vessels, Electric Pizza Oven, and many more.

Competitive Landscape

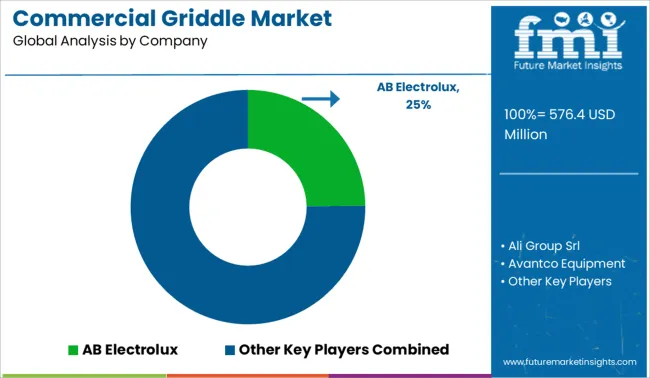
From Pancakes to Fajitas: AB Electrolux, Ali Group Srl, and Avantco Equipment are Hogging the Commercial Griddle Market

Asia-Pacific, the Middle East, Africa, and Europe are just a few of the regions where AB Electrolux conducts business. The business provides a large selection of commercial griddles, such as the Libero Point, 3 unit freestanding counter, Libero Point, 3 HP unit freestanding counter, and 3 unit freestanding refrigerated counter.

Ali Group Srl currently operates through Contract, Distribution & Service, Ice Cream and Beverage Dispense, Ice Makers, Coffee Machines, and Cooking, Bakery, Meal Delivery, Preparation, and Storage Solutions. A variety of gasoline and electric griddles are available from the firm, including the E9941, E3741, LD5, LD6, G9541, G9541CR, E9541, and G3441R.

Through its Unified division, Avantco Equipment does business. A detachable grease pan and heavy-duty stainless steel structure with 3 high sides and backsplashes are among the company's several griddles that are simple to use. Avantco EG16N 16 Electric Countertop Griddle - 120V and Avantco AG36MG 3 Countertop Gas Griddle with Manual Controls - 90,000 BTU are a couple of the griddles in this group.

Recent Developments

  • In August 2022, Illinois Tool Works invested in 2 companies and completed 14 acquisitions. For the purchases, the corporation has invested about $ 185 million. Illinois Tool Works has made investments in a variety of industries, including life sciences platforms and tools, drug delivery, sensors, and other areas.
  • In April 2022, the Chef Series CAG-36-RC 36 Gas Countertop Radiant griddle with 90,000 BTU was introduced by Avantco. It is excellent for grilling burgers, prawns, or vegetable skewers since each burner can be set to a different temperature. Radiants are used in this oven to reflect heat onto the cooking surface, ensuring quick recovery and practical heat retention.
  • In April 2021, with the assistance of ANA Catering Service Co., Ltd., fujimak company and TechMagic K.K began testing finibo, an automatic dish-sorting robot that the two businesses jointly created.

Some of the other key companies proliferating in the market are

Key Segments in the Commercial Griddle Market

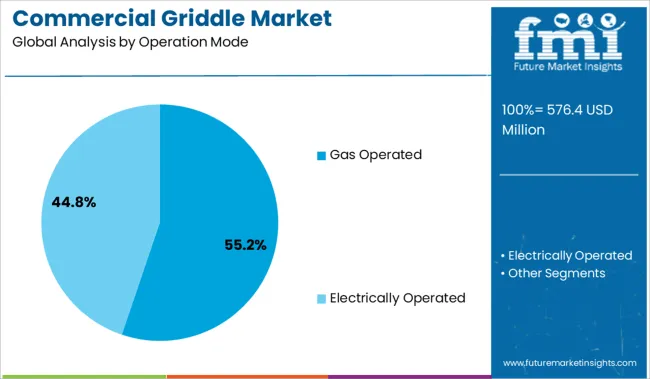
By Operation Mode:

  • Gas Operated
  • Electrically Operated

Installation Type:

  • Free Standing
  • Table Top

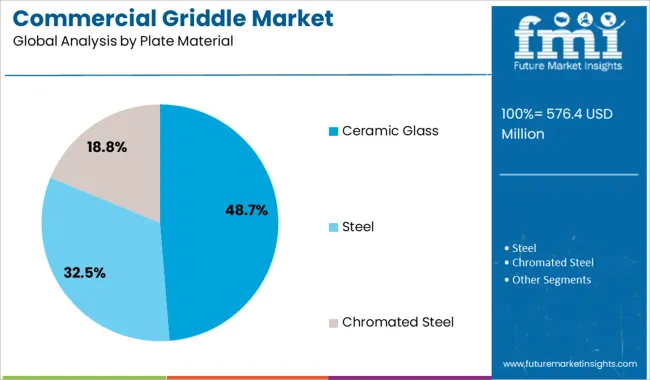
Plate Material:

  • Ceramic Glass
  • Steel
  • Chromated Steel

By Plate Type:

  • Flat
  • Ribbed
  • Mixed

By End User:

  • Food Service Sector
  • Food Processors
  • Institutions

By Sales Channel:

  • Offline
  • Online

By Region:

  • North America
  • Latin America
  • Europe
  • East Asia
  • South Asia & ASEAN
  • Oceania
  • Middle East & Africa

Frequently Asked Questions

What is the Growth Outlook for the Commercial Griddle Market?

The growth outlook for the commercial griddle market is predicted to advance at a CAGR of 4.7% from 2023 to 2033.

Which Country Leads the Commercial Griddle Market?

The United States is anticipated to lead the commercial griddle market during the forecast period.

How much Growth Potential does Commercial Griddle hold?

The commercial griddle market is likely to hold a valuation of US$ 834.2 Million by 2033.

Table of Content

1. Market - Executive Summary | Commercial Griddle Market

2. Market Overview

    2.1. Market Definition and Introduction

    2.2. Market Taxonomy/ Research Scope

3. Market Background and Foundation Data 

    3.1. Commercial Griddle: Apparent Production & Shipment Analysis

        3.1.1. Production Capacity (Units)

            3.1.1.1. By Key Regions

            3.1.1.2. By Key Companies

        3.1.2. Sales Statistics

        3.1.3. Apparent Trade Analysis

    3.2. Market Opportunity Assessment

        3.2.1. Total Available Market (US$ million)

        3.2.2. Serviceable Addressable Market (US$ million)

        3.2.3. Serviceable Obtainable Market (US$ million)

    3.3. Market White Space Assessment

    3.4. Investment Feasibility Analysis

    3.5. Market Dynamics

        3.5.1. Market Growth Drivers

        3.5.2. Market Restraints

        3.5.3. Market Opportunity

        3.5.4. Market Trends

    3.6. Industry Value and Supply Chain Analysis

        3.6.1. Value Added at Each Node of Supply Chain

        3.6.2. Gross Profitability Margins (at Every Level)

        3.6.3. List of Key Participants

            3.6.3.1. Raw Material Suppliers

            3.6.3.2. Manufacturers

            3.6.3.3. Distributors

            3.6.3.4. End Users

    3.7. Forecast and Macro-Economic Factors - Relevance and Impact

    3.8. PESTLE Analysis

    3.9. Porter’s Five Forces Analysis

4. Global Demand (Units) Analysis and Forecast

    4.1. Historical Market Demand (Units) Analysis, 2018 to 2022

    4.2. Current and Future Market Demand (Units) Projections, 2023 to 2033

    4.3. Y-o-Y Volume Growth Trend Analysis

5. Global Market - Pricing Analysis

    5.1. Product Category and Country-Level Pricing Analysis

    5.2. Global Average Pricing Analysis Benchmark

    5.3. Factors Influencing Pricing

6. Global Market Value (US$ million) Analysis and Forecast

    6.1. Historical Market Value (US$ million) Analysis, 2018 to 2022

    6.2. Current and Future Market Value (US$ million) Projections, 2023 to 2033

        6.2.1. Y-o-Y Growth Trend Analysis

        6.2.2. Absolute $ Opportunity Analysis

7. Global Market Analysis and Forecast, By Operation Mode 

    7.1. Introduction / Key Findings

    7.2. Historical Market Size (US$ million) and Demand (Units) Analysis By Operation Mode, 2018 to 2022

    7.3. Current and Future Market Size (US$ million) Analysis and Demand (Units) Forecast By Operation Mode, 2023 to 2033

        7.3.1. Gas operated

        7.3.2. Electrically operated

    7.4. Market Attractiveness Analysis By Operation Mode

8. Global Market Analysis and Forecast, By Installation Type 

    8.1. Introduction / Key Findings

    8.2. Historical Market Size (US$ million) and Demand (Units) Analysis By Installation Type, 2018 to 2022

    8.3. Current and Future Market Size (US$ million) Analysis and Demand (Units) Forecast By Installation Type, 2023 to 2033

        8.3.1. Freestanding

        8.3.2. Tabletop

    8.4. Market Attractiveness Analysis By Installation Type

9. Global Market Analysis and Forecast, By Plate Material 

    9.1. Introduction / Key Findings

    9.2. Historical Market Size (US$ million) and Demand (Units) Analysis By Plate Material, 2018 to 2022

    9.3. Current and Future Market Size (US$ million) Analysis and Demand (Units) Forecast By Plate Material, 2023 to 2033

        9.3.1. Ceramic Glass

        9.3.2. Steel

        9.3.3. Chromated Steel

    9.4. Market Attractiveness Analysis By Plate Material

10. Global Market Analysis and Forecast, By Plate Type

    10.1. Introduction / Key Findings

    10.2. Historical Market Size (US$ million) and Demand (Units) Analysis By Plate Type, 2018 to 2022

    10.3. Current and Future Market Size (US$ million) Analysis and Demand (Units) Forecast By Plate Type, 2023 to 2033

        10.3.1. Flat

        10.3.2. Ribbed

        10.3.3. Mixed

    10.4. Market Attractiveness Analysis By Plate Type

11. Global Market Analysis and Forecast, By End User

    11.1. Introduction / Key Findings

    11.2. Historical Market Size (US$ million) and Demand (Units) Analysis By End User, 2018 to 2022

    11.3. Current and Future Market Size (US$ million) Analysis and Demand (Units) Forecast By End User, 2023 to 2033

        11.3.1. Food Service Sector

        11.3.2. Food Processors

        11.3.3. Institutions

            11.3.3.1. Schools & Universities

            11.3.3.2. Hospitals

            11.3.3.3. Office Spaces

            11.3.3.4. Others

    11.4. Market Attractiveness Analysis By End User

12. Global Market Analysis and Forecast, By Sales Channel

    12.1. Introduction / Key Findings

    12.2. Historical Market Size (US$ million) and Demand (Units) Analysis By Sales Channel, 2018 to 2022

    12.3. Current and Future Market Size (US$ million) Analysis and Demand (Units) Forecast By Sales Channel, 2023 to 2033

        12.3.1. Offline

        12.3.2. Online

    12.4. Market Attractiveness Analysis By Sales Channel

13. Global Market Analysis and Forecast, by Region

    13.1. Introduction

    13.2. Historical Market Size (US$ million) and Demand (Units) Analysis By Region, 2018 to 2022

    13.3. Current Market Size (US$ million) Analysis and Demand (Units) Forecast By Region, 2023 to 2033

        13.3.1. North America

        13.3.2. Latin America

        13.3.3. Europe

        13.3.4. East Asia

        13.3.5. South Asia & Oceania

        13.3.6. Middle East & Africa

    13.4. Market Attractiveness Analysis By Region

14. North America Market Analysis and Forecast 

    14.1. Introduction / Key Findings

    14.2. Pricing Analysis

    14.3. Historical Market Size (US$ million) and Demand (Units) Trend Analysis By Market Taxonomy, 2018 to 2022

    14.4. Market Size (US$ million) and Demand (Units) Forecast By Market Taxonomy, 2023 to 2033

        14.4.1. By Country

            14.4.1.1. The USA

            14.4.1.2. Canada

        14.4.2. By Operation Mode

        14.4.3. By Installation Type

        14.4.4. By Plate Material

        14.4.5. By Plate Type

        14.4.6. By End User

        14.4.7. By Sales Channel

    14.5. Market Attractiveness Analysis

        14.5.1. By Country

        14.5.2. By Operation Mode

        14.5.3. By Installation Type

        14.5.4. By Plate Material

        14.5.5. By Plate Type

        14.5.6. By End User

        14.5.7. By Sales Channel

15. Latin America Market Analysis and Forecast 

    15.1. Introduction / Key Findings

    15.2. Pricing Analysis

    15.3. Historical Market Size (US$ million) and Demand (Units) Trend Analysis By Market Taxonomy, 2018 to 2022

    15.4. Market Size (US$ million) and Demand (Units) Forecast By Market Taxonomy, 2023 to 2033

        15.4.1. By Country

            15.4.1.1. Brazil

            15.4.1.2. Mexico

            15.4.1.3. Argentina

            15.4.1.4. Rest of Latin America

        15.4.2. By Operation Mode

        15.4.3. By Installation Type

        15.4.4. By Plate Material

        15.4.5. By Plate Type

        15.4.6. By End User

        15.4.7. By Sales Channel

    15.5. Market Attractiveness Analysis

        15.5.1. By Country

        15.5.2. By Operation Mode

        15.5.3. By Installation Type

        15.5.4. By Plate Material

        15.5.5. By Plate Type

        15.5.6. By End User

        15.5.7. By Sales Channel

16. Europe Market Analysis and Forecast 

    16.1. Introduction / Key Findings

    16.2. Pricing Analysis

    16.3. Historical Market Size (US$ million) and Demand (Units) Trend Analysis By Market Taxonomy, 2018 to 2022

    16.4. Market Size (US$ million) and Demand (Units) Forecast By Market Taxonomy, 2023 to 2033

        16.4.1. By Country

            16.4.1.1. Germany

            16.4.1.2. Italy

            16.4.1.3. France

            16.4.1.4. United Kingdom

            16.4.1.5. Spain

            16.4.1.6. BENELUX

            16.4.1.7. Russia

            16.4.1.8. Rest of Europe

        16.4.2. By Operation Mode

        16.4.3. By Installation Type

        16.4.4. By Plate Material

        16.4.5. By Plate Type

        16.4.6. By End User

        16.4.7. By Sales Channel

    16.5. Market Attractiveness Analysis

        16.5.1. By Country

        16.5.2. By Operation Mode

        16.5.3. By Installation Type

        16.5.4. By Plate Material

        16.5.5. By Plate Type

        16.5.6. By End User

        16.5.7. By Sales Channel

17. East Asia Market Analysis and Forecast 

    17.1. Introduction / Key Findings

    17.2. Pricing Analysis

    17.3. Historical Market Size (US$ million) and Demand (Units) Trend Analysis By Market Taxonomy, 2018 to 2022

    17.4. Market Size (US$ million) and Demand (Units) Forecast By Market Taxonomy, 2023 to 2033

        17.4.1. By Country

            17.4.1.1. China

            17.4.1.2. Japan

            17.4.1.3. South Korea

        17.4.2. By Operation Mode

        17.4.3. By Installation Type

        17.4.4. By Plate Material

        17.4.5. By Plate Type

        17.4.6. By End User

        17.4.7. By Sales Channel

    17.5. Market Attractiveness Analysis

        17.5.1. By Country

        17.5.2. By Operation Mode

        17.5.3. By Installation Type

        17.5.4. By Plate Material

        17.5.5. By Plate Type

        17.5.6. By End User

        17.5.7. By Sales Channel

18. South Asia & Oceania Market Analysis and Forecast 

    18.1. Introduction / Key Findings

    18.2. Pricing Analysis

    18.3. Historical Market Size (US$ million) and Demand (Units) Trend Analysis By Market Taxonomy, 2018 to 2022

    18.4. Market Size (US$ million) and Demand (Units) Forecast By Market Taxonomy, 2023 to 2033

        18.4.1. By Country

            18.4.1.1. India

            18.4.1.2. Thailand

            18.4.1.3. Indonesia

            18.4.1.4. Malaysia

            18.4.1.5. Australia & New Zealand

            18.4.1.6. Rest of South Asia & Oceania

        18.4.2. By Operation Mode

        18.4.3. By Installation Type

        18.4.4. By Plate Material

        18.4.5. By Plate Type

        18.4.6. By End User

        18.4.7. By Sales Channel

    18.5. Market Attractiveness Analysis

        18.5.1. By Country

        18.5.2. By Operation Mode

        18.5.3. By Installation Type

        18.5.4. By Plate Material

        18.5.5. By Plate Type

        18.5.6. By End User

        18.5.7. By Sales Channel

19. Middle East & Africa Market Analysis and Forecast 

    19.1. Introduction / Key Findings

    19.2. Pricing Analysis

    19.3. Historical Market Size (US$ million) and Demand (Units) Trend Analysis By Market Taxonomy, 2018 to 2022

    19.4. Market Size (US$ million) and Demand (Units) Forecast By Market Taxonomy, 2023 to 2033

        19.4.1. By Country

            19.4.1.1. GCC Countries

            19.4.1.2. Turkey

            19.4.1.3. Northern Africa

            19.4.1.4. South Africa

            19.4.1.5. Rest of Middle East and Africa

        19.4.2. By Operation Mode

        19.4.3. By Installation Type

        19.4.4. By Plate Material

        19.4.5. By Plate Type

        19.4.6. By End User

        19.4.7. By Sales Channel

    19.5. Market Attractiveness Analysis

        19.5.1. By Country

        19.5.2. By Operation Mode

        19.5.3. By Installation Type

        19.5.4. By Plate Material

        19.5.5. By Plate Type

        19.5.6. By End User

        19.5.7. By Sales Channel

20. Country-level Market Analysis and Forecast 

    20.1. Introduction / Key Findings

        20.1.1. Market Value Proportion Analysis, By Key Countries

        20.1.2. Global Vs. Country Growth Comparison

    20.2. US Market Analysis

        20.2.1. Value Proportion Analysis by Market Taxonomy

        20.2.2. Demand (Units) and Value (US$ million) Analysis and Forecast by Market Taxonomy, 2018 to 2033

            20.2.2.1. By Operation Mode

            20.2.2.2. By Installation Type

            20.2.2.3. By Plate Material

            20.2.2.4. By Plate Type

            20.2.2.5. By End User

            20.2.2.6. By Sales Channel

    20.3. Canada Market Analysis

        20.3.1. Value Proportion Analysis by Market Taxonomy

        20.3.2. Demand (Units) and Value (US$ million) Analysis and Forecast by Market Taxonomy, 2018 to 2033

            20.3.2.1. By Operation Mode

            20.3.2.2. By Installation Type

            20.3.2.3. By Plate Material

            20.3.2.4. By Plate Type

            20.3.2.5. By End User

            20.3.2.6. By Sales Channel

    20.4. Brazil Market Analysis

        20.4.1. Value Proportion Analysis by Market Taxonomy

        20.4.2. Demand (Units) and Value (US$ million) Analysis and Forecast by Market Taxonomy, 2018 to 2033

            20.4.2.1. By Operation Mode

            20.4.2.2. By Installation Type

            20.4.2.3. By Plate Material

            20.4.2.4. By Plate Type

            20.4.2.5. By End User

            20.4.2.6. By Sales Channel

    20.5. Mexico Market Analysis

        20.5.1. Value Proportion Analysis by Market Taxonomy

        20.5.2. Demand (Units) and Value (US$ million) Analysis and Forecast by Market Taxonomy, 2018 to 2033

            20.5.2.1. By Operation Mode

            20.5.2.2. By Installation Type

            20.5.2.3. By Plate Material

            20.5.2.4. By Plate Type

            20.5.2.5. By End User

            20.5.2.6. By Sales Channel

    20.6. Argentina Market Analysis

        20.6.1. Value Proportion Analysis by Market Taxonomy

        20.6.2. Demand (Units) and Value (US$ million) Analysis and Forecast by Market Taxonomy, 2018 to 2033

            20.6.2.1. By Operation Mode

            20.6.2.2. By Installation Type

            20.6.2.3. By Plate Material

            20.6.2.4. By Plate Type

            20.6.2.5. By End User

            20.6.2.6. By Sales Channel

    20.7. Germany Market Analysis

        20.7.1. Value Proportion Analysis by Market Taxonomy

        20.7.2. Demand (Units) and Value (US$ million) Analysis and Forecast by Market Taxonomy, 2018 to 2033

            20.7.2.1. By Operation Mode

            20.7.2.2. By Installation Type

            20.7.2.3. By Plate Material

            20.7.2.4. By Plate Type

            20.7.2.5. By End User

            20.7.2.6. By Sales Channel

    20.8. France Market Analysis

        20.8.1. Value Proportion Analysis by Market Taxonomy

        20.8.2. Demand (Units) and Value (US$ million) Analysis and Forecast by Market Taxonomy, 2018 to 2033

            20.8.2.1. By Operation Mode

            20.8.2.2. By Installation Type

            20.8.2.3. By Plate Material

            20.8.2.4. By Plate Type

            20.8.2.5. By End User

            20.8.2.6. By Sales Channel

    20.9. Italy Market Analysis

        20.9.1. Value Proportion Analysis by Market Taxonomy

        20.9.2. Demand (Units) and Value (US$ million) Analysis and Forecast by Market Taxonomy, 2018 to 2033

            20.9.2.1. By Operation Mode

            20.9.2.2. By Installation Type

            20.9.2.3. By Plate Material

            20.9.2.4. By Plate Type

            20.9.2.5. By End User

            20.9.2.6. By Sales Channel

    20.10. Spain Market Analysis

        20.10.1. Value Proportion Analysis by Market Taxonomy

        20.10.2. Demand (Units) and Value (US$ million) Analysis and Forecast by Market Taxonomy, 2018 to 2033

            20.10.2.1. By Operation Mode

            20.10.2.2. By Installation Type

            20.10.2.3. By Plate Material

            20.10.2.4. By Plate Type

            20.10.2.5. By End User

            20.10.2.6. By Sales Channel

    20.11. BENELUX Market Analysis

        20.11.1. Value Proportion Analysis by Market Taxonomy

        20.11.2. Demand (Units) and Value (US$ million) Analysis and Forecast by Market Taxonomy, 2018 to 2033

            20.11.2.1. By Operation Mode

            20.11.2.2. By Installation Type

            20.11.2.3. By Plate Material

            20.11.2.4. By Plate Type

            20.11.2.5. By End User

            20.11.2.6. By Sales Channel

    20.12. Russia Market Analysis

        20.12.1. Value Proportion Analysis by Market Taxonomy

        20.12.2. Demand (Units) and Value (US$ million) Analysis and Forecast by Market Taxonomy, 2018 to 2033

            20.12.2.1. By Operation Mode

            20.12.2.2. By Installation Type

            20.12.2.3. By Plate Material

            20.12.2.4. By Plate Type

            20.12.2.5. By End User

            20.12.2.6. By Sales Channel

    20.13. United Kingdom Market Analysis

        20.13.1. Value Proportion Analysis by Market Taxonomy

        20.13.2. Demand (Units) and Value (US$ million) Analysis and Forecast by Market Taxonomy, 2018 to 2033

            20.13.2.1. By Operation Mode

            20.13.2.2. By Installation Type

            20.13.2.3. By Plate Material

            20.13.2.4. By Plate Type

            20.13.2.5. By End User

            20.13.2.6. By Sales Channel

    20.14. China Market Analysis

        20.14.1. Value Proportion Analysis by Market Taxonomy

        20.14.2. Demand (Units) and Value (US$ million) Analysis and Forecast by Market Taxonomy, 2018 to 2033

            20.14.2.1. By Operation Mode

            20.14.2.2. By Installation Type

            20.14.2.3. By Plate Material

            20.14.2.4. By Plate Type

            20.14.2.5. By End User

            20.14.2.6. By Sales Channel

    20.15. Japan Market Analysis

        20.15.1. Value Proportion Analysis by Market Taxonomy

        20.15.2. Demand (Units) and Value (US$ million) Analysis and Forecast by Market Taxonomy, 2018 to 2033

            20.15.2.1. By Operation Mode

            20.15.2.2. By Installation Type

            20.15.2.3. By Plate Material

            20.15.2.4. By Plate Type

            20.15.2.5. By End User

            20.15.2.6. By Sales Channel

    20.16. South Korea Market Analysis

        20.16.1. Value Proportion Analysis by Market Taxonomy

        20.16.2. Demand (Units) and Value (US$ million) Analysis and Forecast by Market Taxonomy, 2018 to 2033

            20.16.2.1. By Operation Mode

            20.16.2.2. By Installation Type

            20.16.2.3. By Plate Material

            20.16.2.4. By Plate Type

            20.16.2.5. By End User

            20.16.2.6. By Sales Channel

    20.17. India Market Analysis

        20.17.1. Value Proportion Analysis by Market Taxonomy

        20.17.2. Demand (Units) and Value (US$ million) Analysis and Forecast by Market Taxonomy, 2018 to 2033

            20.17.2.1. By Operation Mode

            20.17.2.2. By Installation Type

            20.17.2.3. By Plate Material

            20.17.2.4. By Plate Type

            20.17.2.5. By End User

            20.17.2.6. By Sales Channel

    20.18. ASEAN Countries Market Analysis

        20.18.1. Value Proportion Analysis by Market Taxonomy

        20.18.2. Demand (Units) and Value (US$ million) Analysis and Forecast by Market Taxonomy, 2018 to 2033

            20.18.2.1. By Operation Mode

            20.18.2.2. By Installation Type

            20.18.2.3. By Plate Material

            20.18.2.4. By Plate Type

            20.18.2.5. By End User

            20.18.2.6. By Sales Channel

    20.19. Australia Market Analysis

        20.19.1. Value Proportion Analysis by Market Taxonomy

        20.19.2. Demand (Units) and Value (US$ million) Analysis and Forecast by Market Taxonomy, 2018 to 2033

            20.19.2.1. By Operation Mode

            20.19.2.2. By Installation Type

            20.19.2.3. By Plate Material

            20.19.2.4. By Plate Type

            20.19.2.5. By End User

            20.19.2.6. By Sales Channel

    20.20. GCC Countries Market Analysis

        20.20.1. Value Proportion Analysis by Market Taxonomy

        20.20.2. Demand (Units) and Value (US$ million) Analysis and Forecast by Market Taxonomy, 2018 to 2033

            20.20.2.1. By Operation Mode

            20.20.2.2. By Installation Type

            20.20.2.3. By Plate Material

            20.20.2.4. By Plate Type

            20.20.2.5. By End User

            20.20.2.6. By Sales Channel

    20.21. Turkey Market Analysis

        20.21.1. Value Proportion Analysis by Market Taxonomy

        20.21.2. Demand (Units) and Value (US$ million) Analysis and Forecast by Market Taxonomy, 2018 to 2033

            20.21.2.1. By Operation Mode

            20.21.2.2. By Installation Type

            20.21.2.3. By Plate Material

            20.21.2.4. By Plate Type

            20.21.2.5. By End User

            20.21.2.6. By Sales Channel

    20.22. South Africa Market Analysis

        20.22.1. Value Proportion Analysis by Market Taxonomy

        20.22.2. Demand (Units) and Value (US$ million) Analysis and Forecast by Market Taxonomy, 2018 to 2033

            20.22.2.1. By Operation Mode

            20.22.2.2. By Installation Type

            20.22.2.3. By Plate Material

            20.22.2.4. By Plate Type

            20.22.2.5. By End User

            20.22.2.6. By Sales Channel

21. Market Structure Analysis

    21.1. Market Analysis by Tier of Companies

    21.2. Market Concentration of Players

    21.3. Market Share Analysis of Top Players

    21.4. Market Presence Analysis

22. Competition Analysis

    22.1. Competition Dashboard

    22.2. Competition Benchmarking of Products

    22.3. Competition Deep Dive: Commercial Griddle

        22.3.1. AB Electrolux

            22.3.1.1. Overview

            22.3.1.2. Product Portfolio

            22.3.1.3. Key Financials

            22.3.1.4. Sales Footprint

            22.3.1.5. SWOT Analysis

            22.3.1.6. Key Developments

            22.3.1.7. Strategy Overview

        22.3.2. Ali Group Srl

            22.3.2.1. Overview

            22.3.2.2. Product Portfolio

            22.3.2.3. Key Financials

            22.3.2.4. Sales Footprint

            22.3.2.5. SWOT Analysis

            22.3.2.6. Key Developments

            22.3.2.7. Strategy Overview

        22.3.3. Avantco Equipment

            22.3.3.1. Overview

            22.3.3.2. Product Portfolio

            22.3.3.3. Key Financials

            22.3.3.4. Sales Footprint

            22.3.3.5. SWOT Analysis

            22.3.3.6. Key Developments

            22.3.3.7. Strategy Overview

        22.3.4. Cooking Performance Group

            22.3.4.1. Overview

            22.3.4.2. Product Portfolio

            22.3.4.3. Key Financials

            22.3.4.4. Sales Footprint

            22.3.4.5. SWOT Analysis

            22.3.4.6. Key Developments

            22.3.4.7. Strategy Overview

        22.3.5. FUJIMAK Corp.

            22.3.5.1. Overview

            22.3.5.2. Product Portfolio

            22.3.5.3. Key Financials

            22.3.5.4. Sales Footprint

            22.3.5.5. SWOT Analysis

            22.3.5.6. Key Developments

            22.3.5.7. Strategy Overview

        22.3.6. Illinois Tool Works Inc.

            22.3.6.1. Overview

            22.3.6.2. Product Portfolio

            22.3.6.3. Key Financials

            22.3.6.4. Sales Footprint

            22.3.6.5. SWOT Analysis

            22.3.6.6. Key Developments

            22.3.6.7. Strategy Overview

        22.3.7. Kuppersbusch Großkuchentechnik GmbH & Co. KG

            22.3.7.1. Overview

            22.3.7.2. Product Portfolio

            22.3.7.3. Key Financials

            22.3.7.4. Sales Footprint

            22.3.7.5. SWOT Analysis

            22.3.7.6. Key Developments

            22.3.7.7. Strategy Overview

        22.3.8. SIMCO Group

            22.3.8.1. Overview

            22.3.8.2. Product Portfolio

            22.3.8.3. Key Financials

            22.3.8.4. Sales Footprint

            22.3.8.5. SWOT Analysis

            22.3.8.6. Key Developments

            22.3.8.7. Strategy Overview

        22.3.9. The Middleby Corp.

            22.3.9.1. Overview

            22.3.9.2. Product Portfolio

            22.3.9.3. Key Financials

            22.3.9.4. Sales Footprint

            22.3.9.5. SWOT Analysis

            22.3.9.6. Key Developments

            22.3.9.7. Strategy Overview

        22.3.10. The Vollrath Co. LLC

            22.3.10.1. Overview

            22.3.10.2. Product Portfolio

            22.3.10.3. Key Financials

            22.3.10.4. Sales Footprint

            22.3.10.5. SWOT Analysis

            22.3.10.6. Key Developments

            22.3.10.7. Strategy Overview

        22.3.11. Welbilt Inc.

            22.3.11.1. Overview

            22.3.11.2. Product Portfolio

            22.3.11.3. Key Financials

            22.3.11.4. Sales Footprint

            22.3.11.5. SWOT Analysis

            22.3.11.6. Key Developments

            22.3.11.7. Strategy Overview

23. Assumptions & Acronyms Used

24. Research Methodology

List of Tables

Table 1. Global Market Value (US$ million) and Forecast by Region, 2018 to 2022

Table 2. Global Market Value (US$ million) and Forecast by Region, 2023 to 2033

Table 3. Global Market Volume (Units) and Forecast by Region, 2018 to 2022

Table 4. Global Market Volume (Units) and Forecast by Region, 2023 to 2033

Table 5. Global Market Value (US$ million) and Forecast By Operation Mode, 2018 to 2022

Table 6. Global Market Value (US$ million) and Forecast By Operation Mode, 2023 to 2033

Table 7. Global Market Volume (Units) and Forecast By Operation Mode, 2018 to 2022

Table 8. Global Market Volume (Units) and Forecast By Operation Mode, 2023 to 2033

Table 9. Global Market Value (US$ million) and Forecast By Installation Type, 2018 to 2022

Table 10. Global Market Value (US$ million) and Forecast By Installation Type, 2023 to 2033

Table 11. Global Market Volume (Units) and Forecast By Installation Type, 2018 to 2022

Table 12. Global Market Volume (Units) and Forecast By Installation Type, 2023 to 2033

Table 13. Global Market Value (US$ million) and Forecast By Plate Material, 2018 to 2022

Table 14. Global Market Value (US$ million) and Forecast By Plate Material, 2023 to 2033

Table 15. Global Market Volume (Units) and Forecast By Plate Material, 2018 to 2022

Table 16. Global Market Volume (Units) and Forecast By Plate Material, 2023 to 2033

Table 17. Global Market Value (US$ million) and Forecast By Plate Type, 2018 to 2022

Table 18. Global Market Value (US$ million) and Forecast By Plate Type, 2023 to 2033

Table 19. Global Market Volume (Units) and Forecast By Plate Type, 2018 to 2022

Table 20. Global Market Volume (Units) and Forecast By Plate Type, 2023 to 2033

Table 21. Global Market Value (US$ million) and Forecast By End User, 2018 to 2022

Table 22. Global Market Value (US$ million) and Forecast By End User, 2023 to 2033

Table 23. Global Market Volume (Units) and Forecast By End User, 2018 to 2022

Table 24. Global Market Volume (Units) and Forecast By End User, 2023 to 2033

Table 25. Global Market Value (US$ million) and Forecast By Sales Channel, 2018 to 2022

Table 26. Global Market Value (US$ million) and Forecast By Sales Channel, 2023 to 2033

Table 27. Global Market Volume (Units) and Forecast By Sales Channel, 2018 to 2022

Table 28. Global Market Volume (Units) and Forecast By Sales Channel, 2023 to 2033

Table 29. North America Market Value (US$ million) and Forecast by Country, 2018 to 2022

Table 30. North America Market Value (US$ million) and Forecast by Country, 2023 to 2033

Table 31. North America Market Volume (Units) and Forecast by Country, 2018 to 2022

Table 32. North America Market Volume (Units) and Forecast by Country, 2023 to 2033

Table 33. North America Market Value (US$ million) and Forecast By Operation Mode, 2018 to 2022

Table 34. North America Market Value (US$ million) and Forecast By Operation Mode, 2023 to 2033

Table 35. North America Market Volume (Units) and Forecast By Operation Mode, 2018 to 2022

Table 36. North America Market Volume (Units) and Forecast By Operation Mode, 2023 to 2033

Table 37. North America Market Value (US$ million) and Forecast By Installation Type, 2018 to 2022

Table 38. North America Market Value (US$ million) and Forecast By Installation Type, 2023 to 2033

Table 39. North America Market Volume (Units) and Forecast By Installation Type, 2018 to 2022

Table 40. North America Market Volume (Units) and Forecast By Installation Type, 2023 to 2033

Table 41. North America Market Value (US$ million) and Forecast By Plate Material, 2018 to 2022

Table 42. North America Market Value (US$ million) and Forecast By Plate Material, 2023 to 2033

Table 43. North America Market Volume (Units) and Forecast By Plate Material, 2018 to 2022

Table 44. North America Market Volume (Units) and Forecast By Plate Material, 2023 to 2033

Table 45. North America Market Value (US$ million) and Forecast By Plate Type, 2018 to 2022

Table 46. North America Market Value (US$ million) and Forecast By Plate Type, 2023 to 2033

Table 47. North America Market Volume (Units) and Forecast By Plate Type, 2018 to 2022

Table 48. North America Market Volume (Units) and Forecast By Plate Type, 2023 to 2033

Table 49. North America Market Value (US$ million) and Forecast By End User, 2018 to 2022

Table 50. North America Market Value (US$ million) and Forecast By End User, 2023 to 2033

Table 51. North America Market Volume (Units) and Forecast By End User, 2018 to 2022

Table 52. North America Market Volume (Units) and Forecast By End User, 2023 to 2033

Table 53. North America Market Value (US$ million) and Forecast By Sales Channel, 2018 to 2022

Table 54. North America Market Value (US$ million) and Forecast By Sales Channel, 2023 to 2033

Table 55. North America Market Volume (Units) and Forecast By Sales Channel, 2018 to 2022

Table 56. North America Market Volume (Units) and Forecast By Sales Channel, 2023 to 2033

Table 57. Latin America Market Value (US$ million) and Forecast by Country, 2018 to 2022

Table 58. Latin America Market Value (US$ million) and Forecast by Country, 2023 to 2033

Table 59. Latin America Market Volume (Units) and Forecast by Country, 2018 to 2022

Table 60. Latin America Market Volume (Units) and Forecast by Country, 2023 to 2033

Table 61. Latin America Market Value (US$ million) and Forecast By Operation Mode, 2018 to 2022

Table 62. Latin America Market Value (US$ million) and Forecast By Operation Mode, 2023 to 2033

Table 63. Latin America Market Volume (Units) and Forecast By Operation Mode, 2018 to 2022

Table 64. Latin America Market Volume (Units) and Forecast By Operation Mode, 2023 to 2033

Table 65. Latin America Market Value (US$ million) and Forecast By Installation Type, 2018 to 2022

Table 66. Latin America Market Value (US$ million) and Forecast By Installation Type, 2023 to 2033

Table 67. Latin America Market Volume (Units) and Forecast By Installation Type, 2018 to 2022

Table 68. Latin America Market Volume (Units) and Forecast By Installation Type, 2023 to 2033

Table 69. Latin America Market Value (US$ million) and Forecast By Plate Material, 2018 to 2022

Table 70. Latin America Market Value (US$ million) and Forecast By Plate Material, 2023 to 2033

Table 71. Latin America Market Volume (Units) and Forecast By Plate Material, 2018 to 2022

Table 72. Latin America Market Volume (Units) and Forecast By Plate Material, 2023 to 2033

Table 73. Latin America Market Value (US$ million) and Forecast By Plate Type, 2018 to 2022

Table 74. Latin America Market Value (US$ million) and Forecast By Plate Type, 2023 to 2033

Table 75. Latin America Market Volume (Units) and Forecast By Plate Type, 2018 to 2022

Table 76. Latin America Market Volume (Units) and Forecast By Plate Type, 2023 to 2033

Table 77. Latin America Market Value (US$ million) and Forecast By End User, 2018 to 2022

Table 78. Latin America Market Value (US$ million) and Forecast By End User, 2023 to 2033

Table 79. Latin America Market Volume (Units) and Forecast By End User, 2018 to 2022

Table 80. Latin America Market Volume (Units) and Forecast By End User, 2023 to 2033

Table 81. Latin America Market Value (US$ million) and Forecast By Sales Channel, 2018 to 2022

Table 82. Latin America Market Value (US$ million) and Forecast By Sales Channel, 2023 to 2033

Table 83. Latin America Market Volume (Units) and Forecast By Sales Channel, 2018 to 2022

Table 84. Latin America Market Volume (Units) and Forecast By Sales Channel, 2023 to 2033

Table 85. Europe Market Value (US$ million) and Forecast by Country, 2018 to 2022

Table 86. Europe Market Value (US$ million) and Forecast by Country, 2023 to 2033

Table 87. Europe Market Volume (Units) and Forecast by Country, 2018 to 2022

Table 88. Europe Market Volume (Units) and Forecast by Country, 2023 to 2033

Table 89. Europe Market Value (US$ million) and Forecast By Operation Mode, 2018 to 2022

Table 90. Europe Market Value (US$ million) and Forecast By Operation Mode, 2023 to 2033

Table 91. Europe Market Volume (Units) and Forecast By Operation Mode, 2018 to 2022

Table 92. Europe Market Volume (Units) and Forecast By Operation Mode, 2023 to 2033

Table 93. Europe Market Value (US$ million) and Forecast By Installation Type, 2018 to 2022

Table 94. Europe Market Value (US$ million) and Forecast By Installation Type, 2023 to 2033

Table 95. Europe Market Volume (Units) and Forecast By Installation Type, 2018 to 2022

Table 96. Europe Market Volume (Units) and Forecast By Installation Type, 2023 to 2033

Table 97. Europe Market Value (US$ million) and Forecast By Plate Material, 2018 to 2022

Table 98. Europe Market Value (US$ million) and Forecast By Plate Material, 2023 to 2033

Table 99. Europe Market Volume (Units) and Forecast By Plate Material, 2018 to 2022

Table 100. Europe Market Volume (Units) and Forecast By Plate Material, 2023 to 2033

Table 101. Europe Market Value (US$ million) and Forecast By Plate Type, 2018 to 2022

Table 102. Europe Market Value (US$ million) and Forecast By Plate Type, 2023 to 2033

Table 103. Europe Market Volume (Units) and Forecast By Plate Type, 2018 to 2022

Table 104. Europe Market Volume (Units) and Forecast By Plate Type, 2023 to 2033

Table 105. Europe Market Value (US$ million) and Forecast By End User, 2018 to 2022

Table 106. Europe Market Value (US$ million) and Forecast By End User, 2023 to 2033

Table 107. Europe Market Volume (Units) and Forecast By End User, 2018 to 2022

Table 108. Europe Market Volume (Units) and Forecast By End User, 2023 to 2033

Table 109. Europe Market Value (US$ million) and Forecast By Sales Channel, 2018 to 2022

Table 110. Europe Market Value (US$ million) and Forecast By Sales Channel, 2023 to 2033

Table 111. Europe Market Volume (Units) and Forecast By Sales Channel, 2018 to 2022

Table 112. Europe Market Volume (Units) and Forecast By Sales Channel, 2023 to 2033

Table 113. East Asia Market Value (US$ million) and Forecast by Country, 2018 to 2022

Table 114. East Asia Market Value (US$ million) and Forecast by Country, 2023 to 2033

Table 115. East Asia Market Volume (Units) and Forecast by Country, 2018 to 2022

Table 116. East Asia Market Volume (Units) and Forecast by Country, 2023 to 2033

Table 117. East Asia Market Value (US$ million) and Forecast By Operation Mode, 2018 to 2022

Table 118. East Asia Market Value (US$ million) and Forecast By Operation Mode, 2023 to 2033

Table 119. East Asia Market Volume (Units) and Forecast By Operation Mode, 2018 to 2022

Table 120. East Asia Market Volume (Units) and Forecast By Operation Mode, 2023 to 2033

Table 121. East Asia Market Value (US$ million) and Forecast By Installation Type, 2018 to 2022

Table 122. East Asia Market Value (US$ million) and Forecast By Installation Type, 2023 to 2033

Table 123. East Asia Market Volume (Units) and Forecast By Installation Type, 2018 to 2022

Table 124. East Asia Market Volume (Units) and Forecast By Installation Type, 2023 to 2033

Table 125. East Asia Market Value (US$ million) and Forecast By Plate Material, 2018 to 2022

Table 126. East Asia Market Value (US$ million) and Forecast By Plate Material, 2023 to 2033

Table 127. East Asia Market Volume (Units) and Forecast By Plate Material, 2018 to 2022

Table 128. East Asia Market Volume (Units) and Forecast By Plate Material, 2023 to 2033

Table 129. East Asia Market Value (US$ million) and Forecast By Plate Type, 2018 to 2022

Table 130. East Asia Market Value (US$ million) and Forecast By Plate Type, 2023 to 2033

Table 131. East Asia Market Volume (Units) and Forecast By Plate Type, 2018 to 2022

Table 132. East Asia Market Volume (Units) and Forecast By Plate Type, 2023 to 2033

Table 133. East Asia Market Value (US$ million) and Forecast By End User, 2018 to 2022

Table 134. East Asia Market Value (US$ million) and Forecast By End User, 2023 to 2033

Table 135. East Asia Market Volume (Units) and Forecast By End User, 2018 to 2022

Table 136. East Asia Market Volume (Units) and Forecast By End User, 2023 to 2033

Table 137. East Asia Market Value (US$ million) and Forecast By Sales Channel, 2018 to 2022

Table 138. East Asia Market Value (US$ million) and Forecast By Sales Channel, 2023 to 2033

Table 139. East Asia Market Volume (Units) and Forecast By Sales Channel, 2018 to 2022

Table 140. East Asia Market Volume (Units) and Forecast By Sales Channel, 2023 to 2033

Table 141. South Asia & Oceania Market Value (US$ million) and Forecast by Country, 2018 to 2022

Table 142. South Asia & Oceania Market Value (US$ million) and Forecast by Country, 2023 to 2033

Table 143. South Asia & Oceania Market Volume (Units) and Forecast by Country, 2018 to 2022

Table 144. South Asia & Oceania Market Volume (Units) and Forecast by Country, 2023 to 2033

Table 145. South Asia & Oceania Market Value (US$ million) and Forecast By Operation Mode, 2018 to 2022

Table 146. South Asia & Oceania Market Value (US$ million) and Forecast By Operation Mode, 2023 to 2033

Table 147. South Asia & Oceania Market Volume (Units) and Forecast By Operation Mode, 2018 to 2022

Table 148. South Asia & Oceania Market Volume (Units) and Forecast By Operation Mode, 2023 to 2033

Table 149. South Asia & Oceania Market Value (US$ million) and Forecast By Installation Type, 2018 to 2022

Table 150. South Asia & Oceania Market Value (US$ million) and Forecast By Installation Type, 2023 to 2033

Table 151. South Asia & Oceania Market Volume (Units) and Forecast By Installation Type, 2018 to 2022

Table 152. South Asia & Oceania Market Volume (Units) and Forecast By Installation Type, 2023 to 2033

Table 153. South Asia & Oceania Market Value (US$ million) and Forecast By Plate Material, 2018 to 2022

Table 154. South Asia & Oceania Market Value (US$ million) and Forecast By Plate Material, 2023 to 2033

Table 155. South Asia & Oceania Market Volume (Units) and Forecast By Plate Material, 2018 to 2022

Table 156. South Asia & Oceania Market Volume (Units) and Forecast By Plate Material, 2023 to 2033

Table 157. South Asia & Oceania Market Value (US$ million) and Forecast By Plate Type, 2018 to 2022

Table 158. South Asia & Oceania Market Value (US$ million) and Forecast By Plate Type, 2023 to 2033

Table 159. South Asia & Oceania Market Volume (Units) and Forecast By Plate Type, 2018 to 2022

Table 160. South Asia & Oceania Market Volume (Units) and Forecast By Plate Type, 2023 to 2033

Table 161. South Asia & Oceania Market Value (US$ million) and Forecast By End User, 2018 to 2022

Table 162. South Asia & Oceania Market Value (US$ million) and Forecast By End User, 2023 to 2033

Table 163. South Asia & Oceania Market Volume (Units) and Forecast By End User, 2018 to 2022

Table 164. South Asia & Oceania Market Volume (Units) and Forecast By End User, 2023 to 2033

Table 165. South Asia & Oceania Market Value (US$ million) and Forecast By Sales Channel, 2018 to 2022

Table 166. South Asia & Oceania Market Value (US$ million) and Forecast By Sales Channel, 2023 to 2033

Table 167. South Asia & Oceania Market Volume (Units) and Forecast By Sales Channel, 2018 to 2022

Table 168. South Asia & Oceania Market Volume (Units) and Forecast By Sales Channel, 2023 to 2033

Table 169. Middle East and Africa (MEA) Market Value (US$ million) and Forecast by Country, 2018 to 2022

Table 170. MEA Market Value (US$ million) and Forecast by Country, 2023 to 2033

Table 171. MEA Market Volume (Units) and Forecast by Country, 2018 to 2022

Table 172. MEA Market Volume (Units) and Forecast by Country, 2023 to 2033

Table 173. MEA Market Value (US$ million) and Forecast By Operation Mode, 2018 to 2022

Table 174. MEA Market Value (US$ million) and Forecast By Operation Mode, 2023 to 2033

Table 175. MEA Market Volume (Units) and Forecast By Operation Mode, 2018 to 2022

Table 176. MEA Market Volume (Units) and Forecast By Operation Mode, 2023 to 2033

Table 177. MEA Market Value (US$ million) and Forecast By Installation Type, 2018 to 2022

Table 178. MEA Market Value (US$ million) and Forecast By Installation Type, 2023 to 2033

Table 179. MEA Market Volume (Units) and Forecast By Installation Type, 2018 to 2022

Table 180. MEA Market Volume (Units) and Forecast By Installation Type, 2023 to 2033

Table 181. MEA Market Value (US$ million) and Forecast By Plate Material, 2018 to 2022

Table 182. MEA Market Value (US$ million) and Forecast By Plate Material, 2023 to 2033

Table 183. MEA Market Volume (Units) and Forecast By Plate Material, 2018 to 2022

Table 184. MEA Market Volume (Units) and Forecast By Plate Material, 2023 to 2033

Table 185. MEA Market Value (sUS$ million) and Forecast By Plate Type, 2018 to 2022

Table 186. MEA Market Value (US$ million) and Forecast By Plate Type, 2023 to 2033

Table 187. MEA Market Volume (Units) and Forecast By Plate Type, 2018 to 2022

Table 188. MEA Market Volume (Units) and Forecast By Plate Type, 2023 to 2033

Table 189. MEA Market Value (US$ million) and Forecast By End User, 2018 to 2022

Table 190. MEA Market Value (US$ million) and Forecast By End User, 2023 to 2033

Table 191. MEA Market Volume (Units) and Forecast By End User, 2018 to 2022

Table 192. MEA Market Volume (Units) and Forecast By End User, 2023 to 2033

Table 193. MEA Market Value (US$ million) and Forecast By Sales Channel, 2018 to 2022

Table 194. MEA Market Value (US$ million) and Forecast By Sales Channel, 2023 to 2033

Table 195. MEA Market Volume (Units) and Forecast By Sales Channel, 2018 to 2022

Table 196. MEA Market Volume (Units) and Forecast By Sales Channel, 2023 to 2033

List of Charts

Figure 1. Global Market Value (US$ million) and Volume (Units) Forecast, 2023 to 2033

Figure 2. Global Market Absolute $ Opportunity (US$ million), 2023 to 2033

Figure 3. Global Market Value (US$ million) and Volume (Units) by Region, 2023 & 2033

Figure 4. Global Market Y-o-Y Growth Rate by Region, 2023 to 2033

Figure 5. Global Market Value (US$ million) and Volume (Units) By Operation Mode, 2023 & 2033

Figure 6. Global Market Y-o-Y Growth Rate By Operation Mode, 2023 to 2033

Figure 7. Global Market Value (US$ million) and Volume (Units) By Installation Type, 2023 & 2033

Figure 8. Global Market Y-o-Y Growth Rate By Installation Type, 2023 to 2033

Figure 9. Global Market Value (US$ million) and Volume (Units) By Plate Material, 2023 & 2033

Figure 10. Global Market Y-o-Y Growth Rate By Plate Material, 2023 to 2033

Figure 11. Global Market Value (US$ million) and Volume (Units) By Plate Type, 2023 & 2033

Figure 12. Global Market Y-o-Y Growth Rate By Plate Type, 2023 to 2033

Figure 13. Global Market Value (US$ million) and Volume (Units) By End User, 2023 & 2033

Figure 14. Global Market Y-o-Y Growth Rate By End User, 2023 to 2033

Figure 15. Global Market Value (US$ million) and Volume (Units) By Sales Channel, 2023 & 2033

Figure 16. Global Market Y-o-Y Growth Rate By Sales Channel, 2023 to 2033

Figure 17. North America Market Value (US$ million) and Volume (Units) Forecast, 2023 to 2033

Figure 18. North America Market Absolute $ Opportunity (US$ million), 2023 to 2033

Figure 19. North America Market Value (US$ million) and Volume (Units) by Country, 2023 & 2033

Figure 20. North America Market Y-o-Y Growth Rate by Country, 2023 to 2033

Figure 21. North America Market Value (US$ million) and Volume (Units) By Operation Mode, 2023 & 2033

Figure 22. North America Market Y-o-Y Growth Rate By Operation Mode, 2023 to 2033

Figure 23. North America Market Value (US$ million) and Volume (Units) By Installation Type, 2023 & 2033

Figure 24. North America Market Y-o-Y Growth Rate By Installation Type, 2023 to 2033

Figure 25. North America Market Value (US$ million) and Volume (Units) By Plate Material, 2023 & 2033

Figure 26. North America Market Y-o-Y Growth Rate By Plate Material, 2023 to 2033

Figure 27. North America Market Value (US$ million) and Volume (Units) By Plate Type, 2023 & 2033

Figure 28. North America Market Y-o-Y Growth Rate By Plate Type, 2023 to 2033

Figure 29. North America Market Value (US$ million) and Volume (Units) By End User, 2023 & 2033

Figure 30. North America Market Y-o-Y Growth Rate By End User, 2023 to 2033

Figure 31. North America Market Value (US$ million) and Volume (Units) By Sales Channel, 2023 & 2033

Figure 32. North America Market Y-o-Y Growth Rate By Sales Channel, 2023 to 2033

Figure 33. North America Market Attractiveness Analysis by Country, 2023 to 2033

Figure 34. North America Market Attractiveness Analysis By Operation Mode, 2023 to 2033

Figure 35. North America Market Attractiveness Analysis By Installation Type, 2023 to 2033

Figure 36. North America Market Attractiveness Analysis By Plate Material, 2023 to 2033

Figure 37. North America Market Attractiveness Analysis By Plate Type, 2023 to 2033

Figure 38. North America Market Attractiveness Analysis By End User, 2023 to 2033

Figure 39. North America Market Attractiveness Analysis By Sales Channel, 2023 to 2033

Figure 40. Latin America Market Value (US$ million) and Volume (Units) Forecast, 2023 to 2033

Figure 41. Latin America Market Absolute $ Opportunity (US$ million), 2023 to 2033

Figure 42. Latin America Market Value (US$ million) and Volume (Units) by Country, 2023 & 2033

Figure 43. Latin America Market Y-o-Y Growth Rate by Country, 2023 to 2033

Figure 44. Latin America Market Value (US$ million) and Volume (Units) By Operation Mode, 2023 & 2033

Figure 45. Latin America Market Y-o-Y Growth Rate By Operation Mode, 2023 to 2033

Figure 46. Latin America Market Value (US$ million) and Volume (Units) By Installation Type, 2023 & 2033

Figure 47. Latin America Market Y-o-Y Growth Rate By Installation Type, 2023 to 2033

Figure 48. Latin America Market Value (US$ million) and Volume (Units) By Plate Material, 2023 & 2033

Figure 49. Latin America Market Y-o-Y Growth Rate By Plate Material, 2023 to 2033

Figure 50. Latin America Market Value (US$ million) and Volume (Units) By Plate Type, 2023 & 2033

Figure 51. Latin America Market Y-o-Y Growth Rate By Plate Type, 2023 to 2033

Figure 52. Latin America Market Value (US$ million) and Volume (Units) By End User, 2023 & 2033

Figure 53. Latin America Market Y-o-Y Growth Rate By End User, 2023 to 2033

Figure 54. Latin America Market Value (US$ million) and Volume (Units) By Sales Channel, 2023 & 2033

Figure 55. Latin America Market Y-o-Y Growth Rate By Sales Channel, 2023 to 2033

Figure 56. Latin America Market Attractiveness Analysis by Country, 2023 to 2033

Figure 57. Latin America Market Attractiveness Analysis By Operation Mode, 2023 to 2033

Figure 58. Latin America Market Attractiveness Analysis By Installation Type, 2023 to 2033

Figure 59. Latin America Market Attractiveness Analysis By Plate Material, 2023 to 2033

Figure 60. Latin America Market Attractiveness Analysis By Plate Type, 2023 to 2033

Figure 61. Latin America Market Attractiveness Analysis By End User, 2023 to 2033

Figure 62. Latin America Market Attractiveness Analysis By Sales Channel, 2023 to 2033

Figure 63. Europe Market Value (US$ million) and Volume (Units) Forecast, 2023 to 2033

Figure 64. Europe Market Absolute $ Opportunity (US$ million), 2023 to 2033

Figure 65. Europe Market Value (US$ million) and Volume (Units) by Country, 2023 & 2033

Figure 66. Europe Market Y-o-Y Growth Rate by Country, 2023 to 2033

Figure 67. Europe Market Value (US$ million) and Volume (Units) By Operation Mode, 2023 & 2033

Figure 68. Europe Market Y-o-Y Growth Rate By Operation Mode, 2023 to 2033

Figure 69. Europe Market Value (US$ million) and Volume (Units) By Installation Type, 2023 & 2033

Figure 70. Europe Market Y-o-Y Growth Rate By Installation Type, 2023 to 2033

Figure 71. Europe Market Value (US$ million) and Volume (Units) By Plate Material, 2023 & 2033

Figure 72. Europe Market Y-o-Y Growth Rate By Plate Material, 2023 to 2033

Figure 73. Europe Market Value (US$ million) and Volume (Units) By Plate Type, 2023 & 2033

Figure 74. Europe Market Y-o-Y Growth Rate By Plate Type, 2023 to 2033

Figure 75. Europe Market Value (US$ million) and Volume (Units) By End User, 2023 & 2033

Figure 76. Europe Market Y-o-Y Growth Rate By End User, 2023 to 2033

Figure 77. Europe Market Value (US$ million) and Volume (Units) By Sales Channel, 2023 & 2033

Figure 78. Europe Market Y-o-Y Growth Rate By Sales Channel, 2023 to 2033

Figure 79. Europe Market Attractiveness Analysis by Country, 2023 to 2033

Figure 80. Europe Market Attractiveness Analysis By Operation Mode, 2023 to 2033

Figure 81. Europe Market Attractiveness Analysis By Installation Type, 2023 to 2033

Figure 82. Europe Market Attractiveness Analysis By Plate Material, 2023 to 2033

Figure 83. Europe Market Attractiveness Analysis By Plate Type, 2023 to 2033

Figure 84. Europe Market Attractiveness Analysis By End User, 2023 to 2033

Figure 85. Europe Market Attractiveness Analysis By Sales Channel, 2023 to 2033

Figure 86. East Asia Market Value (US$ million) and Volume (Units) Forecast, 2023 to 2033

Figure 87. East Asia Market Absolute $ Opportunity (US$ million), 2023 to 2033

Figure 88. East Asia Market Value (US$ million) and Volume (Units) by Country, 2023 & 2033

Figure 89. East Asia Market Y-o-Y Growth Rate by Country, 2023 to 2033

Figure 90. East Asia Market Value (US$ million) and Volume (Units) By Operation Mode, 2023 & 2033

Figure 91. East Asia Market Y-o-Y Growth Rate By Operation Mode, 2023 to 2033

Figure 92. East Asia Market Value (US$ million) and Volume (Units) By Installation Type, 2023 & 2033

Figure 93. East Asia Market Y-o-Y Growth Rate By Installation Type, 2023 to 2033

Figure 94. East Asia Market Value (US$ million) and Volume (Units) By Plate Material, 2023 & 2033

Figure 95. East Asia Market Y-o-Y Growth Rate By Plate Material, 2023 to 2033

Figure 96. East Asia Market Value (US$ million) and Volume (Units) By Plate Type, 2023 & 2033

Figure 97. East Asia Market Y-o-Y Growth Rate By Plate Type, 2023 to 2033

Figure 98. East Asia Market Value (US$ million) and Volume (Units) By End User, 2023 & 2033

Figure 99. East Asia Market Y-o-Y Growth Rate By End User, 2023 to 2033

Figure 100. East Asia Market Value (US$ million) and Volume (Units) By Sales Channel, 2023 & 2033

Figure 101. East Asia Market Y-o-Y Growth Rate By Sales Channel, 2023 to 2033

Figure 102. East Asia Market Attractiveness Analysis by Country, 2023 to 2033

Figure 103. East Asia Market Attractiveness Analysis By Operation Mode, 2023 to 2033

Figure 104. East Asia Market Attractiveness Analysis By Installation Type, 2023 to 2033

Figure 105. East Asia Market Attractiveness Analysis By Plate Material, 2023 to 2033

Figure 106. East Asia Market Attractiveness Analysis By Plate Type, 2023 to 2033

Figure 107. East Asia Market Attractiveness Analysis By End User, 2023 to 2033

Figure 108. East Asia Market Attractiveness Analysis By Sales Channel, 2023 to 2033

Figure 109. South Asia & Oceania Market Value (US$ million) and Volume (Units) Forecast, 2023 to 2033

Figure 110. South Asia & Oceania Market Absolute $ Opportunity (US$ million), 2023 to 2033

Figure 111. South Asia & Oceania Market Value (US$ million) and Volume (Units) by Country, 2023 & 2033

Figure 112. South Asia & Oceania Market Y-o-Y Growth Rate by Country, 2023 to 2033

Figure 113. South Asia & Oceania Market Value (US$ million) and Volume (Units) By Operation Mode, 2023 & 2033

Figure 114. South Asia & Oceania Market Y-o-Y Growth Rate By Operation Mode, 2023 to 2033

Figure 115. South Asia & Oceania Market Value (US$ million) and Volume (Units) By Installation Type, 2023 & 2033

Figure 116. South Asia & Oceania Market Y-o-Y Growth Rate By Installation Type, 2023 to 2033

Figure 117. South Asia & Oceania Market Value (US$ million) and Volume (Units) By Plate Material, 2023 & 2033

Figure 118. South Asia & Oceania Market Y-o-Y Growth Rate By Plate Material, 2023 to 2033

Figure 119. South Asia & Oceania Market Value (US$ million) and Volume (Units) By Plate Type, 2023 & 2033

Figure 120. South Asia & Oceania Market Y-o-Y Growth Rate By Plate Type, 2023 to 2033

Figure 121. South Asia & Oceania Market Value (US$ million) and Volume (Units) By End User, 2023 & 2033

Figure 122. South Asia & Oceania Market Y-o-Y Growth Rate By End User, 2023 to 2033

Figure 123. South Asia & Oceania Market Value (US$ million) and Volume (Units) By Sales Channel, 2023 & 2033

Figure 124. South Asia & Oceania Market Y-o-Y Growth Rate By Sales Channel, 2023 to 2033

Figure 125. South Asia & Oceania Market Attractiveness Analysis by Country, 2023 to 2033

Figure 126. South Asia & Oceania Market Attractiveness Analysis By Operation Mode, 2023 to 2033

Figure 127. South Asia & Oceania Market Attractiveness Analysis By Installation Type, 2023 to 2033

Figure 128. South Asia & Oceania Market Attractiveness Analysis By Plate Material, 2023 to 2033

Figure 129. South Asia & Oceania Market Attractiveness Analysis By Plate Type, 2023 to 2033

Figure 130. South Asia & Oceania Market Attractiveness Analysis By End User, 2023 to 2033

Figure 131. South Asia & Oceania Market Attractiveness Analysis By Sales Channel, 2023 to 2033

Figure 132. MEA Market Value (US$ million) and Volume (Units) Forecast, 2023 to 2033

Figure 133. MEA Market Absolute $ Opportunity (US$ million), 2023 to 2033

Figure 134. MEA Market Value (US$ million) and Volume (Units) by Country, 2023 & 2033

Figure 135. MEA Market Y-o-Y Growth Rate by Country, 2023 to 2033

Figure 136. MEA Market Value (US$ million) and Volume (Units) By Operation Mode, 2023 & 2033

Figure 137. MEA Market Y-o-Y Growth Rate By Operation Mode, 2023 to 2033

Figure 138. MEA Market Value (US$ million) and Volume (Units) By Installation Type, 2023 & 2033

Figure 139. MEA Market Y-o-Y Growth Rate By Installation Type, 2023 to 2033

Figure 140. MEA Market Value (US$ million) and Volume (Units) By Plate Material, 2023 & 2033

Figure 141. MEA Market Y-o-Y Growth Rate By Plate Material, 2023 to 2033

Figure 142. MEA Market Value (US$ million) and Volume (Units) By Plate Type, 2023 & 2033

Figure 143. MEA Market Y-o-Y Growth Rate By Plate Type, 2023 to 2033

Figure 144. MEA Market Value (US$ million) and Volume (Units) By End User, 2023 & 2033

Figure 145. MEA Market Y-o-Y Growth Rate By End User, 2023 to 2033

Figure 146. MEA Market Value (US$ million) and Volume (Units) By Sales Channel, 2023 & 2033

Figure 147. MEA Market Y-o-Y Growth Rate By Sales Channel, 2023 to 2033

Figure 148. MEA Market Attractiveness Analysis by Country, 2023 to 2033

Figure 149. MEA Market Attractiveness Analysis By Operation Mode, 2023 to 2033

Figure 150. MEA Market Attractiveness Analysis By Installation Type, 2023 to 2033

Figure 151. MEA Market Attractiveness Analysis By Plate Material, 2023 to 2033

Figure 152. MEA Market Attractiveness Analysis By Plate Type, 2023 to 2033

Figure 153. MEA Market Attractiveness Analysis By End User, 2023 to 2033

Figure 154. MEA Market Attractiveness Analysis By Sales Channel, 2023 to 2033

Explore Process Automation Insights

View Reports

Commercial Griddle Market