Reports

- Global Locations -

Headquarters

Future Market Insights, Inc.

Christiana Corporate, 200
Continental Drive, Suite 401,
Newark, Delaware - 19713,
United States

T: +1-845-579-5705

Americas

Future Market Insights, Inc.

616 Corporate Way, Suite 2-9018,
Valley Cottage, NY 10989, United States

T: +1-347-918-3531

MEA

Future Market Insights

1602-6 Jumeirah Bay X2 Tower, Plot No: JLT-PH2-X2A,
Jumeirah Lakes Towers, Dubai,
United Arab Emirates

Europe

Future Market Insights

3rd Floor, 207 Regent Street,
W1B 3HH London
United Kingdom

T: + 44 (0) 20 8123 9659
D: +44 (0) 20 3287 4268

Asia Pacific

Future Market Insights

IndiaLand Global Tech Park, Unit UG-1, Behind Grand HighStreet, Phase 1, Hinjawadi, MH, Pune – 411057, India

Commercial Bar Supplies Market Outlook (2023 to 2033)

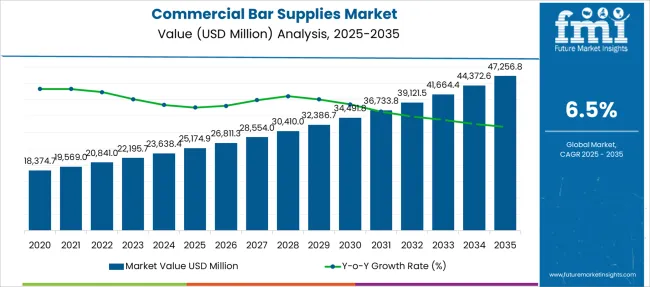
According to Future Market Insights research, the commercial bar supplies market is expected to grow at a CAGR of 6.5% during the forecast period (2023 to 2033). The market value is projected to increase from US$ 22,195.7 million in 2023 to US$ 41,664.4 million by 2033. The market previously exhibited a CAGR of 5.3% from 2017 to 2022. The following variables contribute to market growth:

  • Global growth in the number of bars and clubs has led to increased consumption and, therefore, higher sales of wine and bar equipment.
  • The availability of different types of commercial bar supplies and equipment, including but not limited to bar fridges, blenders, utensils, food serving, racks, beer taps, etc., is spoiling end users with choice.
  • A wide range of beer taps, which can be used to dispense both draft and bottled beer, is also a unique attraction in the bars.
  • The increasing appeal for the equipment necessary to prepare cocktails and other beverages is owing to the importance of mixology in pubs and clubs to satisfy the specific demands of consumers at these places.
  • Continuous increase in the number of eminent winemakers and commercial winemakers switching to new technologies
  • The requirements of bartenders to deliver the optimum drinks and a selection of concoctions have increased.
  • Commercial bar supplies may initially cost more, but owing to their effectiveness and longevity, they often end up saving money over time.
  • Market participants are observing incredible development potential in all related product categories, particularly given that wine cellars are now essentially standard accessories in many residences.
  • The supplies are being marketed in an array of ways by different market participants, using an assortment of materials and establishing various styles.
  • Businesses are embracing modern trends fast and effectively while also recognizing the requirements of their clients to fulfill those requirements on a regular basis to keep up with the constant change of the market.
  • Companies are focusing on finding new ways to reach their target audience through marketing and advertising.
  • The desire for the wine lifestyle is thriving as wine consumption and acceptance develop, influencing market trends.

The commercial bar supplies market is predicted to develop strongly, but professional analysts of FMI have revealed that there are several challenges that might limit the market growth between 2023 and 2033. The following is a list of the current market-affecting factors:

  • Lack of consumer demand has resulted in a decline in sales and profits for businesses that manufacture these goods.
  • Many businesses are struggling to generate revenue in this sector owing to the high cost of labor and raw materials.
  • Rigid regulatory frameworks by certain governments on alcohol and bars.

In certain domains, such as new accessory trends emerging based on various shakers, glassware, and bar accessories, the market is expected to witness massive growth prospects. These are some trends and opportunities in the global commercial bar supplies market:

  • During the pandemic, off-premise alcohol sales rebounded. The number of in-house bars has climbed along with the consumption of alcohol.
  • Businesses are attempting to reduce their use of BPA.
  • For environmental and aesthetic concerns, bars and bartenders are replacing their typical plastic straws with ones made of metal, hay, or biodegradable material, encouraging the industry.
  • Owing to the increasing adoption of E-Commerce, some suppliers of commercial bars are providing convenient online ordering and delivery solutions so that consumers can receive the supplies they require without leaving their homes.
  • In addition to millennials, the generation z population is also being drawn into the green bar and wine accessory sector, which is fueling global demand for commercial cocktail bar supplies.
  • When requests for personalized barware come in, it is predicted that printing businesses would move toward personalizing a shaker, a mug, or a whiskey glass for a booze fanatic or just for the bar case.
Attribute Details
Market Size Value in 2023 US$ 22,195.7 million
Market Forecast Value in 2033 US$ 41,664.4 million
Global Growth Rate (2023 to 2033) 6.5%CAGR
Forecast Period 2023 to 2033
Market Share of the United Kingdom in Europe 22%

Don't pay for what you don't need

Customize your report by selecting specific countries or regions and save 30%!

Comparing historical outlook and projections for the world's Commercial Bar Supplies

A new report published by Future market insights projects the global commercial bar supplies market to reach US$ 41,664.4 million during the forecast period, up from US$ 15,211.47 million during the historical period.

Global drinking patterns have drastically changed in recent years. New trends emerge every year, driving the bar business in new ways and bringing about more transformations. In 2022, customers are typically more concerned with what they put into their bodies, which has led to a rise in interest in foods and drinks that are healthy. The adoption of professional bar supply is the result of this.

The market for commercial bar supplies is growing rapidly, propelled by demand from a supermarket and industrial distributors. The increased demand is driven by the need for more efficient and cost-effective operations in the food and beverage industry. Commercial bar accessories are essential for businesses that serve alcohol, as they provide the necessary equipment and products for bartenders to create cocktails and other drinks.

The market is also expected to continue growing in the coming years as the food and beverage industry continues to evolve and grow. This growth will be driven by the increasing demand from consumers for new and innovative products, as well as the need for more efficient operations in the industry.
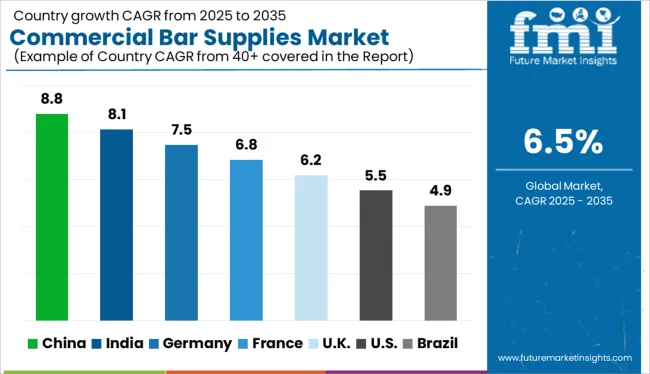
Commercial Bar Supplies Market

Country-wise Insights

What is the global outlook for the commercial bar supplies market?

In recent years, the commercial barware supplies market in North America has been growing at a rapid pace. This is due to the increasing popularity of bars and restaurants in the region. The market is expected to continue growing in the coming years as more people are likely to visit bars and restaurants.

On the other hand, in recent years, the market for commercial bar supplies in Europe has been growing steadily. This is due to the fact that many countries in Europe have adopted more liberal policies toward alcohol consumption, which has led to an increase in the number of bars and restaurants in operation. Additionally, the European Union has been working to promote trade between member states, which has made it easier for businesses to source commercial bar accessories from other countries in Europe.

The Asia Pacific region is expected to see the highest growth in the market due to the increasing number of bars and restaurants in countries of this region. The high growth rate can be attributed to the growing hospitality industry and rising disposable incomes in developing countries of Asia Pacific. The market for commercial bar supplies is fragmented, with a large number of small and medium-sized players operating in this space.
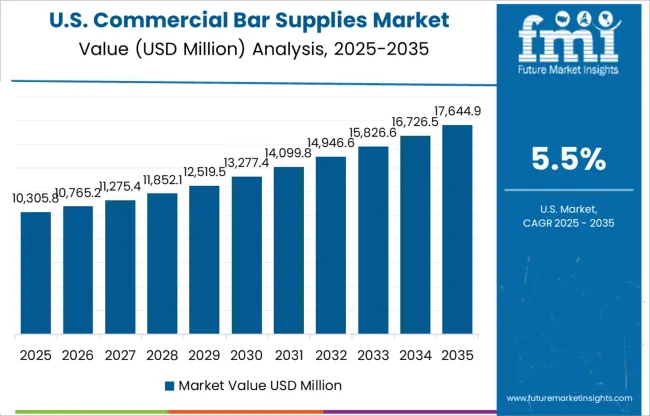
What Proportion of the Global Commercial Bar Supplies Market does the USA Represent?

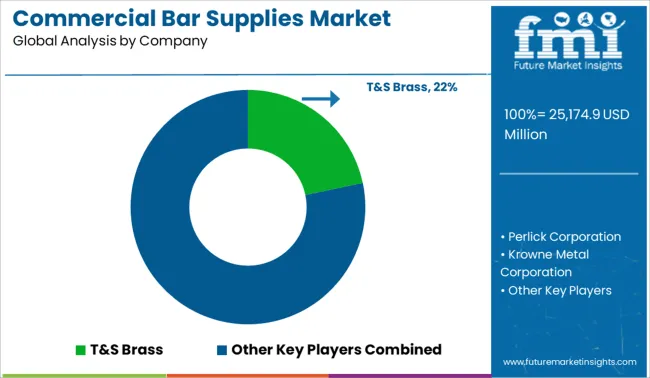
The United States commercial bar supplies market is the largest in North America. This is due to the large number of bars and restaurants in the country along with the large number of players operating in it. The leading players in this market are T&S Brass, Perlick Corporation, Krowne Metal Corporation, Advance Tabco, American Beverage Equipment Company LLC., and John Boos & Company. These companies hold a significant share of the USA market.

Currently, the USA accounts for around 60% of the North American commercial bar supplies market. This is mostly due to the wide range of product offerings by market players and their vast nationwide network of distribution channels. Construction of in-house bars is increasing in the USA, which has an impact on market trends for commercial bar supplies and equipment. The younger generation in the United States now prefers to host home parties over going out to bars, which raises the need for bar equipment in residential areas due to the shift in consumer lifestyle.

The market in the USA is also being driven by the high alcohol consumption rate throughout the country, as well as a consumer lifestyle that involves drinking cocktails and mocktails to celebrate every occasion. Due to the growing interest from customers who are health-conscious, the consumption of low-alcohol beverages such as cocktails has increased in the area. Since bar supplies are mostly used to produce cocktails, the growing consumption of cocktails is anticipated to spur market expansion. Apart from companies, a considerable portion of the population of the United States consumes alcohol, which considerably increases the need for bar accessories, especially in the residential regions of the country.

Canada and Mexico are also significant markets for commercial bar supplies due to the growing popularity of these businesses in these countries. Greenland is a small market for commercial bar supplies, but it is expected to grow in the future as more people become interested in this type of business.
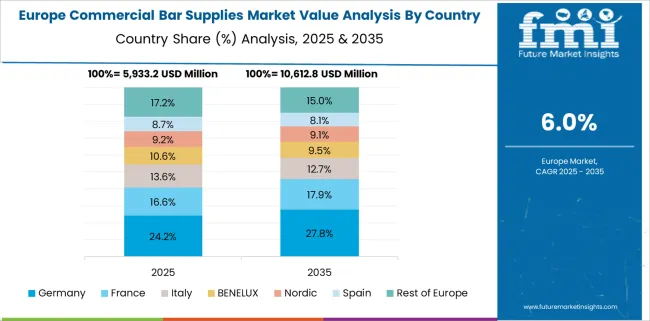
What is the Situation of the European Commercial Bar Supplies Market in the world?

A significant market share for commercial bar supplies is expected to belong to Europe at the end of 2022, with France accounting for the majority of that proportion. One of the largest wine producers in the world, France is also one of the countries where the market is expanding most quickly due to increased travel there. The European commercial bar supplies market is also expanding as a result of rising premium wine consumption, a large tourist population that enjoys wine tasting, and other important aspects, which are causing a rise in commercial bar supplies sales.

Over the next five years, industry revenue is expected to rebound in tandem with lessening regulatory constraints, rising discretionary income, and increased consumer confidence. As people strive to take advantage of loosening coronavirus regulations, the sector is expected to profit from pent-up demand from both local customers and a return of foreign visitors.

What is the Outlook of Japan in the Commercial Bar Supplies Market in the World?

The Japanese commercial bar supplies market is largely driven by the rising frequency of eating out despite time-constrained schedules and the growing effect of cross-cultural dietary patterns due to the significant presence of food service providers. One peculiar issue that has cost the Japanese government money is that its youth don't drink enough. Even a contest is being held by the Japanese government to come up with innovative ideas for getting young people to drink more.

For instance, according to the official competition website, the Sake Viva! campaign, which is run by the National Tax Agency, solicits submissions on how to stimulate demand among young people for alcohol through new services, promotional strategies, products, designs, and even sales techniques utilizing artificial intelligence or the metaverse. Promoting any sort of Japanese alcoholic beverage was allowed in the contest. Commercial bar suppliers now have several chances to craft bar equipment to satisfy this rising demand.

What Prospects does Korea have for the Global Commercial Bar Supplies Market?

As customers become more concerned with their health, the South Korean liquor industry is progressively moving in favor of beverages with a lower alcohol level. This has increased the demand and popularity of cocktail culture throughout Korea. Owing to this scenario, the increased adoption of commercial bar supplies by bars and homes is driving the market in Korea.

Hoesik, or getting together with coworkers for drinks after work once a month, was a common corporate tradition in South Korea. The increased interest among customers in specialty or niche food and beverage offers benefits to independent businesses. Convenience and online ordering will be essential for customers in 2020, as home delivery or takeaway of alcohol and a rise in home use of alcohol. All these factors are contributing to the Korean commercial bar supplies market.

Nandini Roy Choudhury

Principal Consultant

Talk to Analyst

Find your sweet spots for generating winning opportunities in this market.

Category-wise Insights

Supermarkets are Propelling the Growth Commercial Bar Supplies in the Market

The commercial bar supplies market is expected to grow at a CAGR of 6.5% during the forecast period (2023 to 2033). The growth of the market is being propelled by distribution channels like supermarkets which are playing a vital role in the growth and expansion of the market.

Supermarkets are providing a one-stop solution for all the bar needs, which is increasing the convenience for customers and driving market growth. They are also offering a wide range of products, which is giving customers more choices and driving up sales. In addition, supermarkets are also providing promotional activities and discounts, which is attracting more customers to purchase bar supplies from them. The rising popularity of home bars and pubs is another factor that is driving the growth of this segment.

Startup Ecosystem

New Players to Promote Innovation in the Global Market

Start-ups with a focus on the wine sector have slowly emerged over the past several years, working on anything from linked corks to tech-enabled wine preservation. Additionally, a large number of digital companies have emerged that are using cutting-edge technology to disrupt the long-established wine industry. The existence of several small and major competitors has led to the fragmentation of the global market.

Leading Startups to Keep an Eye on

Start-up Company Plum
Country United States
Description Plum offers a wine refrigerator that is internet-connected and can identify, store, and keep wine cold for up to 90 days. The gadget, which can hold up to two different bottles of wine, uses argon gas and a motorized needle to avoid wine oxidation. Once the bottles are in the device, users may pour wine. There are also more affordable reusable argon gas canisters for the gadget. Additionally, Plum provides hotels with a special service.
Start-up Company D-Vine
Country France
Description By-the-glass wine pouring equipment called the 10-Vins was developed by D-Vine. This device aims to provide the ideal serving conditions for the beverage by swiftly aerating the wine and bringing it to the appropriate serving temperature. Each glass-sized portion of the wine is packaged in a tube with a chip that contains information about the suggested serving size.

Get the data you need at a Fraction of the cost

Personalize your report by choosing insights you need
and save 40%!

Competitive Landscape

The market is highly competitive due to the presence of a large number of manufacturers. The manufacturers are focused on offering products that are cost-effective and meet customer requirements. In order to survive in the market, it is important for manufacturers to offer products that are differentiated from those offered by their competitors.

Recent Developments

  • In January 2022, Thirstystone debuted its barware line, which comes in stainless steel, marble finishes, and leather exchange options.
  • In February 2022, a prominent producer of styrene-butadiene-styrene modified bitumen roofing and underlayment solutions for residential and commercial applications, MBTechnology, Inc. (MBT), was acquired by Carlisle Corporation.
  • In May 2022, the manufacturer of refrigeration, bar, and beverage systems, Perlick Corporation, rebuilt and rejuvenated its office and production space in Milwaukee. The $11.5 million project is anticipated to generate 35 employees over the following three years.
  • In June 2022, one of the biggest producers of glass dinnerware in the world, Libbey Glass L.L.C., finished transferring its European operations as well as the Royal Leerdam® and Crisal Glass® trademarks to Anders Invest Co-Invest Fund 3 CoöperatiefU.A., a fund of Anders Invest Evergreen Fund Coöperatief U.A. (Anders Invest).

Commercial Bar Supplies Market Report Scope

Attribute Details
Forecast Period 2023 to 2033
Historical Data Available for 2018 to 2022
Market Analysis US$ million for Value and Units for Volume
Key Regions Covered
  • North America
  • Latin America
  • Europe
  • Asia Pacific
  • Oceania
  • Middle East and Africa (MEA)
Key Countries Covered
  • USA
  • Canada
  • Mexico
  • Germany
  • United Kingdom
  • France
  • Italy
  • Spain
  • China
  • Japan
  • India
  • South Korea
  • Australia
  • Brazil
  • Argentina
  • South Africa
  • UAE
Key Segments Covered
  • By Type
  • By livestock
  • By End-user
  • By Region
  • By Distribution Channel
Key Companies Profiled
  • T&S Brass
  • Perlick Corporation
  • Krowne Metal Corporation
  • Advance Tabco
  • American Beverage Equipment Company LLC.
  • John Boos & Company.
  • Carlisle Products
  • Cocktail Kingdom LLC
  • Cresimo
  • Viski
  • Norpro Inc.
  • OXO
  • SAHM
  • Vacu Vin
  • Rabbit and Juliska
Report Coverage Market Forecast, Company Share Analysis, Competitive Landscape, DROT Analysis, Market Dynamics and Challenges, and Strategic Growth Initiatives
Customization & Pricing Available upon Request

Commercial Bar Supplies Market segmentation by category

By Type, the Commercial Bar Supplies Market is segmented as:

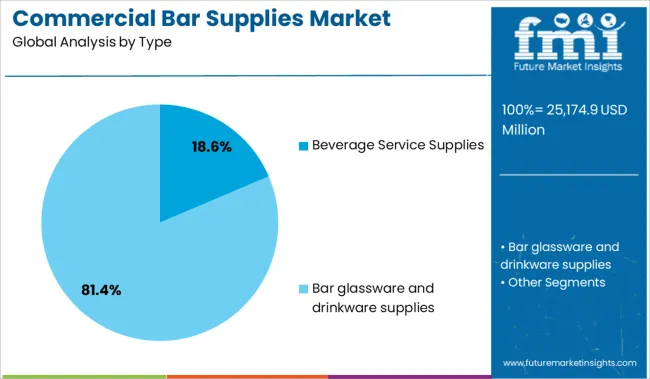
  • Beverage Service Supplies
    • Bottle Service Supplies
    • Beer Liquor And Wine Bags
    • Pitchers
    • Underbar Glass Rack Storage Units
    • Portable Beer Dispensers And Accessories
    • Key Racks, Ice Molds
    • Paper Napkins
    • Beer Growler And Accessories
    • Ice Molds
    • Paper Napkins
    • Beer Growlers
  • Bar glassware and drinkware supplies
    • Beer glass
    • Cocktail glasses
    • Rock glasses
    • Shot glasses
    • Tasting flights
    • beverageware
    • Reusable plastic beverageware
    • Novelty plastic barware
  • Metal Bar equipment supplies
    • Beer dispensers
    • Bottle coolers
    • Glass chillers and fosters
    • Underbar sinks
    • Undercounter ice machines
    • Wine refrigeration
    • Underbar sinks
    • Undercounter ice machines
    • Wine refrigeration
    • Backbar coolers
    • Commercial blenders/ food blenders
    • Commercial juicers
  • Ice supplies
    • Ice transport buckets and accessories
    • Underbar equipment’s
    • Commercial equipment and supplies
    • Ice scoops, shovels, racks, paddles
    • Underbar equipment parts and accessories
    • Reusable hotel ice buckets
    • Glass filler faucets and station
  • Cocktail supplies
    • Cocktail Shakers
    • Garnishing Tool Sand Kits
    • Bar Utensils
    • Bitter bottles
    • Jiggers
    • Glass Rimmers
    • Liquor Pourers
    • Glass Rimmers
  • Food service supplies
    • Non-Skid Trays
    • Plastic Cutlery/Utensils
    • Straws
    • Menu-Table Tents And Tabletop Displayettes
    • Paper Food Trays
    • Restaurant Pagers And Accessories
    • BBQ Accessories
  • Bartender supplies
    • Bar Candles
    • Bar Mats And Shelf Liners
    • Bar towels/Kitchen Towels
    • Plastic Storage Containers & Pourers
    • Corkscrews And Bottle Openers
    • Speed rails And Speed Racks
    • Bartender Kits
    • Kitchen Cutlery
    • Beer Towers
    • Cocktail Smoke Guns& Accessories
  • Ware-washing supplies
    • Bar glass And Glass Washing &Sanitizing Chemicals
    • Glasswasher Machine
    • Glass washing / Polishing Machines
    • Underbar sinks

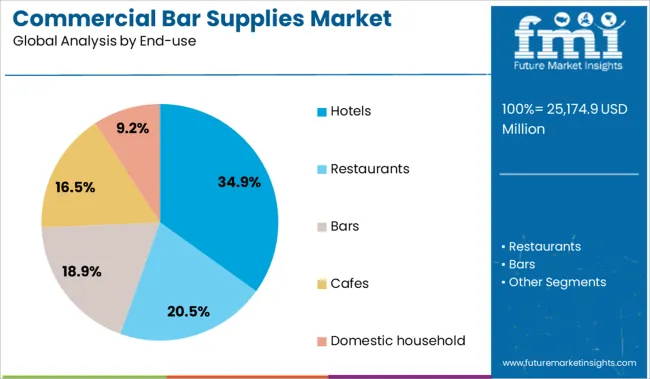
By End-use, the Commercial Bar Supplies Market is segmented as:

  • Hotels
  • Restaurants
  • Bars
  • Cafes
  • Domestic household

By Region, the Commercial Bar Supplies Market is segmented as:

  • North America
  • Latin America
  • Europe
  • Asia Pacific
  • Oceania
  • Middle East and Africa (MEA)

By Distribution channel, the Commercial Bar Supplies Market is segmented as:

  • Hypermarket/Supermarket
  • Direct Selling
  • Online
  • Stores

Frequently Asked Questions

What is the market Share value of Commercial Bar Supplies in 2022?

The global Commercial Bar Supplies market will reach a valuation of US$ 22,195.7 million by the end of 2023.

What is the demand outlook forecast for the Commercial Bar Supplies market?

The global Commercial Bar Supplies market is forecasted to surpass US$ 41,664.4 million by the end of 2023.

Which are the major countries driving demand for Commercial Bar Supplies Market?

The USA, Germany, Japan, China, India, Australia, and the United Kingdom are the major countries driving demand for Commercial Bar Supplies Market.

What is the USA Commercial Bar Supplies Market Outlook?

The USA Commercial Bar Supplies Market is contributing 68% of the total value share in the global market with a market value of US$ 5735.4 million.

What is the United Kingdom Commercial Bar Supplies Market Outlook?

The Germany Commercial Bar Supplies Market is contributing 22% of the total value share in the global market with a market value of US$ 1953.2 million.

What is the China Commercial Bar Supplies Market Outlook?

In China Commercial Bar Supplies Market is contributing 32% of the total market share with a market value of US$ 1278.5 million in the year 2023.

What is the, North America Commercial Bar Supplies Market Outlook?

In North America Commercial Bar Supplies Market is contributing US$ 8,434.4 million value share in the global market.

What is the, Europe Commercial Bar Supplies Market Outlook?

In Europe Commercial Bar Supplies Market is contributing US$ 8,878.3 million of total value share in the global market.

Table of Content

1. Executive Summary | Commercial Bar Supplies Market

    1.1. Global Market Outlook

    1.2. Demand-side Trends

    1.3. Supply-side Trends

    1.4. Technology Roadmap Analysis

    1.5. Analysis and Recommendations

2. Market Overview

    2.1. Market Coverage / Taxonomy

    2.2. Market Definition / Scope / Limitations

3. Market Background

    3.1. Market Dynamics

        3.1.1. Drivers

        3.1.2. Restraints

        3.1.3. Opportunity

        3.1.4. Trends

    3.2. Scenario Forecast

        3.2.1. Demand in Optimistic Scenario

        3.2.2. Demand in Likely Scenario

        3.2.3. Demand in Conservative Scenario

    3.3. Product launches & Recent Developments

    3.4. Product Life Cycle Analysis

    3.5. Value Chain Analysis

        3.5.1. Supply Side Participants and their Roles

            3.5.1.1. Producers

            3.5.1.2. Mid-Level Participants (Traders/ Agents/ Brokers)

            3.5.1.3. Wholesalers and Distributors

        3.5.2. % of Operating Margin Analysis

        3.5.3. List of Raw Material Suppliers

        3.5.4. List of Existing and Potential Buyer’s

    3.6. Global Market - Pricing Analysis

        3.6.1. Price Point Assessment by Region

        3.6.2. Price Point Assessment by Product Type

        3.6.3. Price Forecast till 2033

        3.6.4. Factors affecting pricing

    3.7. Forecast Factors - Relevance & Impact

    3.8. PESTLE and Porter’s Analysis

    3.9. Regulatory Landscape

        3.9.1. Packaging & Labelling Regulations

        3.9.2. Certifications and Certifying Agency Overview

        3.9.3. Import/Export Policies

    3.10. Regional Parent Market Outlook

    3.11. Production and Consumption Statistics

    3.12. Import and Export Statistics

    3.13. Consumers Survey Analysis

    3.14. Macro-Economic Factors

    3.15. Product Claims & Nutritional Information scanned by Buyers

4. Global Analysis 2018 to 2022 and Forecast, 2023 to 2033

    4.1. Historical Market Size Value (US$ million) & Volume (MT) Analysis, 2018 to 2022

    4.2. Current and Future Market Size Value (US$ million) & Volume (MT) Projections, 2023 to 2033

        4.2.1. Y-o-Y Growth Trend Analysis

        4.2.2. Absolute $ Opportunity Analysis

5. Global Analysis 2018 to 2022 and Forecast 2023 to 2033, By Product Type

    5.1. Introduction / Key Findings

    5.2. Historical Market Size Value (US$ million) & Volume (MT) Analysis By Product Type, 2018 to 2022

    5.3. Current and Future Market Size Value (US$ million) & Volume (MT) Analysis and Forecast By Product Type, 2023 to 2033

        5.3.1. Beverage Service Supplies

            5.3.1.1. Bottle Service Supplies

            5.3.1.2. Beer Liquor And Wine Bags

            5.3.1.3. Pitchers

            5.3.1.4. Underbar Glass Rack Storage Value (US$ million) & Volume (MT)s

            5.3.1.5. Portable Beer Dispensers And Accessories

            5.3.1.6. Key Racks, Ice Molds

            5.3.1.7. Paper Napkins

            5.3.1.8. Beer Growler And Accessories

            5.3.1.9. Ice Molds

            5.3.1.10. Paper Napkins

        5.3.2. Bar glassware and drinkware supplies

            5.3.2.1. Beer glass

            5.3.2.2. Cocktail glasses

            5.3.2.3. Rock glasses

            5.3.2.4. Shot glasses

            5.3.2.5. Tasting flights

            5.3.2.6. beverageware

            5.3.2.7. Reusable plastic beverageware

            5.3.2.8. Novelty plastic barware

        5.3.3. Metal Bar equipment supplies

            5.3.3.1. Beer dispensers

            5.3.3.2. Bottle coolers

            5.3.3.3. Glass chillers and fosters

            5.3.3.4. Underbar sinks

            5.3.3.5. Undercounter ice machines

        5.3.4. Ice supplies

            5.3.4.1. Ice transport buckets and accessories

            5.3.4.2. Underbar equipment’s

            5.3.4.3. Commercial equipment and supplies

            5.3.4.4. Ice scoops, shovels, racks, paddles

            5.3.4.5. Underbar equipment parts and accessories

        5.3.5. Cocktail supplies

            5.3.5.1. Cocktail Shakers

            5.3.5.2. Garnishing Tool Sand Kits

            5.3.5.3. Bar Utensils

            5.3.5.4. Bitter bottles

        5.3.6. Food service supplies

            5.3.6.1. BBQ Accessories

            5.3.6.2. Non-Skid Trays

            5.3.6.3. Plastic Cutlery/Utensils

            5.3.6.4. Straws

            5.3.6.5. Menu-Table Tents And Tabletop Displayettes

        5.3.7. Bartender supplies

            5.3.7.1. Bar Candles

            5.3.7.2. Bar Mats And Shelf Liners

            5.3.7.3. Bar towels/Kitchen Towels

            5.3.7.4. Plastic Storage Containers & Pourers

            5.3.7.5. Corkscrews And Bottle Openers

        5.3.8. Ware-washing supplies

            5.3.8.1. Bar glass And Glass Washing &Sanitizing Chemicals

            5.3.8.2. Glasswasher Machine

            5.3.8.3. Glass washing / Polishing Machines

            5.3.8.4. Underbar sinks

    5.4. Y-o-Y Growth Trend Analysis By Product Type, 2018 to 2022

    5.5. Absolute $ Opportunity Analysis By Product Type, 2023 to 2033

6. Global Analysis 2018 to 2022 and Forecast 2023 to 2033, By End User

    6.1. Introduction / Key Findings

    6.2. Historical Market Size Value (US$ million) & Volume (MT) Analysis By End User, 2018 to 2022

    6.3. Current and Future Market Size Value (US$ million) & Volume (MT) Analysis and Forecast By End User, 2023 to 2033

        6.3.1. Hotels

        6.3.2. Restaurants

        6.3.3. Bars

        6.3.4. Cafes

        6.3.5. Household

    6.4. Y-o-Y Growth Trend Analysis By End User, 2018 to 2022

    6.5. Absolute $ Opportunity Analysis By End User, 2023 to 2033

7. Global Analysis 2018 to 2022 and Forecast 2023 to 2033, By Distribution Channel

    7.1. Introduction / Key Findings

    7.2. Historical Market Size Value (US$ million) & Volume (MT) Analysis By Distribution Channel, 2018 to 2022

    7.3. Current and Future Market Size Value (US$ million) & Volume (MT) Analysis and Forecast By Distribution Channel, 2023 to 2033

        7.3.1. Hypermarket/Supermarket

        7.3.2. Direct selling

        7.3.3. Online

        7.3.4. Stores

    7.4. Y-o-Y Growth Trend Analysis By Distribution Channel, 2018 to 2022

    7.5. Absolute $ Opportunity Analysis By Distribution Channel, 2023 to 2033

8. Global Analysis 2018 to 2022 and Forecast 2023 to 2033, By Region

    8.1. Introduction

    8.2. Historical Market Size Value (US$ million) & Volume (MT) Analysis By Region, 2018 to 2022

    8.3. Current Market Size Value (US$ million) & Volume (MT) Analysis and Forecast By Region, 2023 to 2033

        8.3.1. North America

        8.3.2. Latin America

        8.3.3. Europe

        8.3.4. East Asia

        8.3.5. South Asia

        8.3.6. Oceania

        8.3.7. MEA

    8.4. Market Attractiveness Analysis By Region

9. North America Analysis 2018 to 2022 and Forecast 2023 to 2033, By Country

    9.1. Historical Market Size Value (US$ million) & Volume (MT) Trend Analysis By Market Taxonomy, 2018 to 2022

    9.2. Market Size Value (US$ million) & Volume (MT) Forecast By Market Taxonomy, 2023 to 2033

        9.2.1. By Country

            9.2.1.1. The USA

            9.2.1.2. Canada

        9.2.2. By Product Type

        9.2.3. By End User

        9.2.4. By Distribution Channel

    9.3. Market Attractiveness Analysis

        9.3.1. By Country

        9.3.2. By Product Type

        9.3.3. By End User

        9.3.4. By Distribution Channel

    9.4. Key Takeaways

10. Latin America Analysis 2018 to 2022 and Forecast 2023 to 2033, By Country

    10.1. Historical Market Size Value (US$ million) & Volume (MT) Trend Analysis By Market Taxonomy, 2018 to 2022

    10.2. Market Size Value (US$ million) & Volume (MT) Forecast By Market Taxonomy, 2023 to 2033

        10.2.1. By Country

            10.2.1.1. Brazil

            10.2.1.2. Mexico

            10.2.1.3. Argentina

            10.2.1.4. Chile

            10.2.1.5. Peru

            10.2.1.6. Rest of Latin America

        10.2.2. By Product Type

        10.2.3. By End User

        10.2.4. By Distribution Channel

    10.3. Market Attractiveness Analysis

        10.3.1. By Country

        10.3.2. By Product Type

        10.3.3. By End User

        10.3.4. By Distribution Channel

    10.4. Key Takeaways

11. Europe Analysis 2018 to 2022 and Forecast 2023 to 2033, By Country

    11.1. Historical Market Size Value (US$ million) & Volume (MT) Trend Analysis By Market Taxonomy, 2018 to 2022

    11.2. Market Size Value (US$ million) & Volume (MT) Forecast By Market Taxonomy, 2023 to 2033

        11.2.1. By Country

            11.2.1.1. Germany

            11.2.1.2. Italy

            11.2.1.3. France

            11.2.1.4. The United Kingdom

            11.2.1.5. Spain

            11.2.1.6. Russia

            11.2.1.7. BENELUX

            11.2.1.8. Poland

            11.2.1.9. Nordic Countries

            11.2.1.10. Rest of Europe

        11.2.2. By Product Type

        11.2.3. By End User

        11.2.4. By Distribution Channel

    11.3. Market Attractiveness Analysis

        11.3.1. By Country

        11.3.2. By Product Type

        11.3.3. By End User

        11.3.4. By Distribution Channel

    11.4. Key Takeaways

12. East Asia Analysis 2018 to 2022 and Forecast 2023 to 2033, By Country

    12.1. Historical Market Size Value (US$ million) & Volume (MT) Trend Analysis By Market Taxonomy, 2018 to 2022

    12.2. Market Size Value (US$ million) & Volume (MT) Forecast By Market Taxonomy, 2023 to 2033

        12.2.1. By Country

            12.2.1.1. China

            12.2.1.2. Japan

            12.2.1.3. South Korea

        12.2.2. By Product Type

        12.2.3. By End User

        12.2.4. By Distribution Channel

    12.3. Market Attractiveness Analysis

        12.3.1. By Country

        12.3.2. By Product Type

        12.3.3. By End User

        12.3.4. By Distribution Channel

    12.4. Key Takeaways

13. South Asia Analysis 2018 to 2022 and Forecast 2023 to 2033, By Country

    13.1. Historical Market Size Value (US$ million) & Volume (MT) Trend Analysis By Market Taxonomy, 2018 to 2022

    13.2. Market Size Value (US$ million) & Volume (MT) Forecast By Market Taxonomy, 2023 to 2033

        13.2.1. By Country

            13.2.1.1. India

            13.2.1.2. Thailand

            13.2.1.3. Malaysia

            13.2.1.4. Indonesia

            13.2.1.5. Singapore

            13.2.1.6. Rest of South Asia

        13.2.2. By Product Type

        13.2.3. By End User

        13.2.4. By Distribution Channel

    13.3. Market Attractiveness Analysis

        13.3.1. By Country

        13.3.2. By Product Type

        13.3.3. By End User

        13.3.4. By Distribution Channel

    13.4. Key Takeaways

14. Oceania Analysis 2018 to 2022 and Forecast 2023 to 2033, By Country

    14.1. Historical Market Size Value (US$ million) & Volume (MT) Trend Analysis By Market Taxonomy, 2018 to 2022

    14.2. Market Size Value (US$ million) & Volume (MT) Forecast By Market Taxonomy, 2023 to 2033

        14.2.1. By Country

            14.2.1.1. Australia

            14.2.1.2. New Zealand

        14.2.2. By Product Type

        14.2.3. By End User

        14.2.4. By Distribution Channel

    14.3. Market Attractiveness Analysis

        14.3.1. By Country

        14.3.2. By Product Type

        14.3.3. By End User

        14.3.4. By Distribution Channel

    14.4. Key Takeaways

15. MEA Analysis 2018 to 2022 and Forecast 2023 to 2033, By Country

    15.1. Historical Market Size Value (US$ million) & Volume (MT) Trend Analysis By Market Taxonomy, 2018 to 2022

    15.2. Market Size Value (US$ million) & Volume (MT) Forecast By Market Taxonomy, 2023 to 2033

        15.2.1. By Country

            15.2.1.1. GCC Countries

            15.2.1.2. South Africa

            15.2.1.3. Central Africa

            15.2.1.4. North Africa

        15.2.2. By Product Type

        15.2.3. By End User

        15.2.4. By Distribution Channel

    15.3. Market Attractiveness Analysis

        15.3.1. By Country

        15.3.2. By Product Type

        15.3.3. By End User

        15.3.4. By Distribution Channel

    15.4. Key Takeaways

16. Key Countries Analysis

    16.1. U.S.

        16.1.1. Pricing Analysis

        16.1.2. Market Share Analysis, 2022

            16.1.2.1. By Product Type

            16.1.2.2. By End User

            16.1.2.3. By Distribution Channel

    16.2. Canada

        16.2.1. Pricing Analysis

        16.2.2. Market Share Analysis, 2022

            16.2.2.1. By Product Type

            16.2.2.2. By End User

            16.2.2.3. By Distribution Channel

    16.3. Brazil

        16.3.1. Pricing Analysis

        16.3.2. Market Share Analysis, 2022

            16.3.2.1. By Product Type

            16.3.2.2. By End User

            16.3.2.3. By Distribution Channel

    16.4. Mexico

        16.4.1. Pricing Analysis

        16.4.2. Market Share Analysis, 2022

            16.4.2.1. By Product Type

            16.4.2.2. By End User

            16.4.2.3. By Distribution Channel

    16.5. Argentina

        16.5.1. Pricing Analysis

        16.5.2. Market Share Analysis, 2022

            16.5.2.1. By Product Type

            16.5.2.2. By End User

            16.5.2.3. By Distribution Channel

    16.6. Chile

        16.6.1. Pricing Analysis

        16.6.2. Market Share Analysis, 2022

            16.6.2.1. By Product Type

            16.6.2.2. By End User

            16.6.2.3. By Distribution Channel

    16.7. Peru

        16.7.1. Pricing Analysis

        16.7.2. Market Share Analysis, 2022

            16.7.2.1. By Product Type

            16.7.2.2. By End User

            16.7.2.3. By Distribution Channel

    16.8. Germany

        16.8.1. Pricing Analysis

        16.8.2. Market Share Analysis, 2022

            16.8.2.1. By Product Type

            16.8.2.2. By End User

            16.8.2.3. By Distribution Channel

    16.9. Italy

        16.9.1. Pricing Analysis

        16.9.2. Market Share Analysis, 2022

            16.9.2.1. By Product Type

            16.9.2.2. By End User

            16.9.2.3. By Distribution Channel

    16.10. France

        16.10.1. Pricing Analysis

        16.10.2. Market Share Analysis, 2022

            16.10.2.1. By Product Type

            16.10.2.2. By End User

            16.10.2.3. By Distribution Channel

    16.11. Spain

        16.11.1. Pricing Analysis

        16.11.2. Market Share Analysis, 2022

            16.11.2.1. By Product Type

            16.11.2.2. By End User

            16.11.2.3. By Distribution Channel

    16.12. United State

        16.12.1. Pricing Analysis

        16.12.2. Market Share Analysis, 2022

            16.12.2.1. By Product Type

            16.12.2.2. By End User

            16.12.2.3. By Distribution Channel

    16.13. Russia

        16.13.1. Pricing Analysis

        16.13.2. Market Share Analysis, 2022

            16.13.2.1. By Product Type

            16.13.2.2. By End User

            16.13.2.3. By Distribution Channel

    16.14. Poland

        16.14.1. Pricing Analysis

        16.14.2. Market Share Analysis, 2022

            16.14.2.1. By Product Type

            16.14.2.2. By End User

            16.14.2.3. By Distribution Channel

    16.15. BENELUX

        16.15.1. Pricing Analysis

        16.15.2. Market Share Analysis, 2022

            16.15.2.1. By Product Type

            16.15.2.2. By End User

            16.15.2.3. By Distribution Channel

    16.16. Nordic Countries

        16.16.1. Pricing Analysis

        16.16.2. Market Share Analysis, 2022

            16.16.2.1. By Product Type

            16.16.2.2. By End User

            16.16.2.3. By Distribution Channel

    16.17. China

        16.17.1. Pricing Analysis

        16.17.2. Market Share Analysis, 2022

            16.17.2.1. By Product Type

            16.17.2.2. By End User

            16.17.2.3. By Distribution Channel

    16.18. Japan

        16.18.1. Pricing Analysis

        16.18.2. Market Share Analysis, 2022

            16.18.2.1. By Product Type

            16.18.2.2. By End User

            16.18.2.3. By Distribution Channel

    16.19. South Korea

        16.19.1. Pricing Analysis

        16.19.2. Market Share Analysis, 2022

            16.19.2.1. By Product Type

            16.19.2.2. By End User

            16.19.2.3. By Distribution Channel

    16.20. India

        16.20.1. Pricing Analysis

        16.20.2. Market Share Analysis, 2022

            16.20.2.1. By Product Type

            16.20.2.2. By End User

            16.20.2.3. By Distribution Channel

    16.21. Thailand

        16.21.1. Pricing Analysis

        16.21.2. Market Share Analysis, 2022

            16.21.2.1. By Product Type

            16.21.2.2. By End User

            16.21.2.3. By Distribution Channel

    16.22. Indonesia

        16.22.1. Pricing Analysis

        16.22.2. Market Share Analysis, 2022

            16.22.2.1. By Product Type

            16.22.2.2. By End User

            16.22.2.3. By Distribution Channel

    16.23. Malaysia

        16.23.1. Pricing Analysis

        16.23.2. Market Share Analysis, 2022

            16.23.2.1. By Product Type

            16.23.2.2. By End User

            16.23.2.3. By Distribution Channel

    16.24. Singapore

        16.24.1. Pricing Analysis

        16.24.2. Market Share Analysis, 2022

            16.24.2.1. By Product Type

            16.24.2.2. By End User

            16.24.2.3. By Distribution Channel

    16.25. Australia

        16.25.1. Pricing Analysis

        16.25.2. Market Share Analysis, 2022

            16.25.2.1. By Product Type

            16.25.2.2. By End User

            16.25.2.3. By Distribution Channel

    16.26. New Zealand

        16.26.1. Pricing Analysis

        16.26.2. Market Share Analysis, 2022

            16.26.2.1. By Product Type

            16.26.2.2. By End User

            16.26.2.3. By Distribution Channel

    16.27. GCC Countries

        16.27.1. Pricing Analysis

        16.27.2. Market Share Analysis, 2022

            16.27.2.1. By Product Type

            16.27.2.2. By End User

            16.27.2.3. By Distribution Channel

    16.28. South Africa

        16.28.1. Pricing Analysis

        16.28.2. Market Share Analysis, 2022

            16.28.2.1. By Product Type

            16.28.2.2. By End User

            16.28.2.3. By Distribution Channel

    16.29. North Africa

        16.29.1. Pricing Analysis

        16.29.2. Market Share Analysis, 2022

            16.29.2.1. By Product Type

            16.29.2.2. By End User

            16.29.2.3. By Distribution Channel

    16.30. Central Africa

        16.30.1. Pricing Analysis

        16.30.2. Market Share Analysis, 2022

            16.30.2.1. By Product Type

            16.30.2.2. By End User

            16.30.2.3. By Distribution Channel

17. Market Structure Analysis

    17.1. Competition Dashboard

    17.2. Competition Benchmarking

    17.3. Market Share Analysis of Top Players

        17.3.1. By Regional

        17.3.2. By Product Type

        17.3.3. By End User

        17.3.4. By Distribution Channel

18. Competition Analysis

    18.1. Competition Deep Dive

        18.1.1. T&S Brass

            18.1.1.1. Overview

            18.1.1.2. Product Portfolio

            18.1.1.3. Profitability by Market Segments (Product/Age /Sales Channel/Region)

            18.1.1.4. Sales Footprint

            18.1.1.5. Strategy Overview

                18.1.1.5.1. Marketing Strategy

                18.1.1.5.2. Product Strategy

                18.1.1.5.3. Channel Strategy

        18.1.2. Perlick Corporation

            18.1.2.1. Overview

            18.1.2.2. Product Portfolio

            18.1.2.3. Profitability by Market Segments (Product/Age /Sales Channel/Region)

            18.1.2.4. Sales Footprint

            18.1.2.5. Strategy Overview

                18.1.2.5.1. Marketing Strategy

                18.1.2.5.2. Product Strategy

                18.1.2.5.3. Channel Strategy

        18.1.3. Krowne Metal Corporation

            18.1.3.1. Overview

            18.1.3.2. Product Portfolio

            18.1.3.3. Profitability by Market Segments (Product/Age /Sales Channel/Region)

            18.1.3.4. Sales Footprint

            18.1.3.5. Strategy Overview

                18.1.3.5.1. Marketing Strategy

                18.1.3.5.2. Product Strategy

                18.1.3.5.3. Channel Strategy

        18.1.4. Advance Tabco

            18.1.4.1. Overview

            18.1.4.2. Product Portfolio

            18.1.4.3. Profitability by Market Segments (Product/Age /Sales Channel/Region)

            18.1.4.4. Sales Footprint

            18.1.4.5. Strategy Overview

                18.1.4.5.1. Marketing Strategy

                18.1.4.5.2. Product Strategy

                18.1.4.5.3. Channel Strategy

        18.1.5. American Beverage Equipment Company LLC.

            18.1.5.1. Overview

            18.1.5.2. Product Portfolio

            18.1.5.3. Profitability by Market Segments (Product/Age /Sales Channel/Region)

            18.1.5.4. Sales Footprint

            18.1.5.5. Strategy Overview

                18.1.5.5.1. Marketing Strategy

                18.1.5.5.2. Product Strategy

                18.1.5.5.3. Channel Strategy

        18.1.6. John Boos & Company

            18.1.6.1. Overview

            18.1.6.2. Product Portfolio

            18.1.6.3. Profitability by Market Segments (Product/Age /Sales Channel/Region)

            18.1.6.4. Sales Footprint

            18.1.6.5. Strategy Overview

                18.1.6.5.1. Marketing Strategy

                18.1.6.5.2. Product Strategy

                18.1.6.5.3. Channel Strategy

        18.1.7. Carlisle Products

            18.1.7.1. Overview

            18.1.7.2. Product Portfolio

            18.1.7.3. Profitability by Market Segments (Product/Age /Sales Channel/Region)

            18.1.7.4. Sales Footprint

            18.1.7.5. Strategy Overview

                18.1.7.5.1. Marketing Strategy

                18.1.7.5.2. Product Strategy

                18.1.7.5.3. Channel Strategy

        18.1.8. Cocktail Kingdom LLC

            18.1.8.1. Overview

            18.1.8.2. Product Portfolio

            18.1.8.3. Profitability by Market Segments (Product/Age /Sales Channel/Region)

            18.1.8.4. Sales Footprint

            18.1.8.5. Strategy Overview

                18.1.8.5.1. Marketing Strategy

                18.1.8.5.2. Product Strategy

                18.1.8.5.3. Channel Strategy

        18.1.9. Cresimo

            18.1.9.1. Overview

            18.1.9.2. Product Portfolio

            18.1.9.3. Profitability by Market Segments (Product/Age /Sales Channel/Region)

            18.1.9.4. Sales Footprint

            18.1.9.5. Strategy Overview

                18.1.9.5.1. Marketing Strategy

                18.1.9.5.2. Product Strategy

                18.1.9.5.3. Channel Strategy

        18.1.10. Viski

            18.1.10.1. Overview

            18.1.10.2. Product Portfolio

            18.1.10.3. Profitability by Market Segments (Product/Age /Sales Channel/Region)

            18.1.10.4. Sales Footprint

            18.1.10.5. Strategy Overview

                18.1.10.5.1. Marketing Strategy

                18.1.10.5.2. Product Strategy

                18.1.10.5.3. Channel Strategy

        18.1.11. Norpro Inc.

            18.1.11.1. Overview

            18.1.11.2. Product Portfolio

            18.1.11.3. Profitability by Market Segments (Product/Age /Sales Channel/Region)

            18.1.11.4. Sales Footprint

            18.1.11.5. Strategy Overview

                18.1.11.5.1. Marketing Strategy

                18.1.11.5.2. Product Strategy

                18.1.11.5.3. Channel Strategy

        18.1.12. OXO

            18.1.12.1. Overview

            18.1.12.2. Product Portfolio

            18.1.12.3. Profitability by Market Segments (Product/Age /Sales Channel/Region)

            18.1.12.4. Sales Footprint

            18.1.12.5. Strategy Overview

                18.1.12.5.1. Marketing Strategy

                18.1.12.5.2. Product Strategy

                18.1.12.5.3. Channel Strategy

        18.1.13. SAHM

            18.1.13.1. Overview

            18.1.13.2. Product Portfolio

            18.1.13.3. Profitability by Market Segments (Product/Age /Sales Channel/Region)

            18.1.13.4. Sales Footprint

            18.1.13.5. Strategy Overview

                18.1.13.5.1. Marketing Strategy

                18.1.13.5.2. Product Strategy

                18.1.13.5.3. Channel Strategy

        18.1.14. Vacu Vin

            18.1.14.1. Overview

            18.1.14.2. Product Portfolio

            18.1.14.3. Profitability by Market Segments (Product/Age /Sales Channel/Region)

            18.1.14.4. Sales Footprint

            18.1.14.5. Strategy Overview

                18.1.14.5.1. Marketing Strategy

                18.1.14.5.2. Product Strategy

                18.1.14.5.3. Channel Strategy

        18.1.15. Rabbit and Juliska

            18.1.15.1. Overview

            18.1.15.2. Product Portfolio

            18.1.15.3. Profitability by Market Segments (Product/Age /Sales Channel/Region)

            18.1.15.4. Sales Footprint

            18.1.15.5. Strategy Overview

                18.1.15.5.1. Marketing Strategy

                18.1.15.5.2. Product Strategy

                18.1.15.5.3. Channel Strategy

19. Assumptions & Acronyms Used

20. Research Methodology

List of Tables

Table 1: Global Value (US$ million) Forecast by Region, 2018 to 2033

Table 2: Global Volume (MT) Forecast by Region, 2018 to 2033

Table 3: Global Value (US$ million) Forecast by Product Type, 2018 to 2033

Table 4: Global Volume (MT) Forecast by Product Type, 2018 to 2033

Table 5: Global Value (US$ million) Forecast by End User, 2018 to 2033

Table 6: Global Volume (MT) Forecast by End User, 2018 to 2033

Table 7: Global Value (US$ million) Forecast by Distribution Channel, 2018 to 2033

Table 8: Global Volume (MT) Forecast by Distribution Channel, 2018 to 2033

Table 9: North America Value (US$ million) Forecast by Country, 2018 to 2033

Table 10: North America Volume (MT) Forecast by Country, 2018 to 2033

Table 11: North America Value (US$ million) Forecast by Product Type, 2018 to 2033

Table 12: North America Volume (MT) Forecast by Product Type, 2018 to 2033

Table 13: North America Value (US$ million) Forecast by End User, 2018 to 2033

Table 14: North America Volume (MT) Forecast by End User, 2018 to 2033

Table 15: North America Value (US$ million) Forecast by Distribution Channel, 2018 to 2033

Table 16: North America Volume (MT) Forecast by Distribution Channel, 2018 to 2033

Table 17: Latin America Value (US$ million) Forecast by Country, 2018 to 2033

Table 18: Latin America Volume (MT) Forecast by Country, 2018 to 2033

Table 19: Latin America Value (US$ million) Forecast by Product Type, 2018 to 2033

Table 20: Latin America Volume (MT) Forecast by Product Type, 2018 to 2033

Table 21: Latin America Value (US$ million) Forecast by End User, 2018 to 2033

Table 22: Latin America Volume (MT) Forecast by End User, 2018 to 2033

Table 23: Latin America Value (US$ million) Forecast by Distribution Channel, 2018 to 2033

Table 24: Latin America Volume (MT) Forecast by Distribution Channel, 2018 to 2033

Table 25: Europe Value (US$ million) Forecast by Country, 2018 to 2033

Table 26: Europe Volume (MT) Forecast by Country, 2018 to 2033

Table 27: Europe Value (US$ million) Forecast by Product Type, 2018 to 2033

Table 28: Europe Volume (MT) Forecast by Product Type, 2018 to 2033

Table 29: Europe Value (US$ million) Forecast by End User, 2018 to 2033

Table 30: Europe Volume (MT) Forecast by End User, 2018 to 2033

Table 31: Europe Value (US$ million) Forecast by Distribution Channel, 2018 to 2033

Table 32: Europe Volume (MT) Forecast by Distribution Channel, 2018 to 2033

Table 33: East Asia Value (US$ million) Forecast by Country, 2018 to 2033

Table 34: East Asia Volume (MT) Forecast by Country, 2018 to 2033

Table 35: East Asia Value (US$ million) Forecast by Product Type, 2018 to 2033

Table 36: East Asia Volume (MT) Forecast by Product Type, 2018 to 2033

Table 37: East Asia Value (US$ million) Forecast by End User, 2018 to 2033

Table 38: East Asia Volume (MT) Forecast by End User, 2018 to 2033

Table 39: East Asia Value (US$ million) Forecast by Distribution Channel, 2018 to 2033

Table 40: East Asia Volume (MT) Forecast by Distribution Channel, 2018 to 2033

Table 41: South Asia Value (US$ million) Forecast by Country, 2018 to 2033

Table 42: South Asia Volume (MT) Forecast by Country, 2018 to 2033

Table 43: South Asia Value (US$ million) Forecast by Product Type, 2018 to 2033

Table 44: South Asia Volume (MT) Forecast by Product Type, 2018 to 2033

Table 45: South Asia Value (US$ million) Forecast by End User, 2018 to 2033

Table 46: South Asia Volume (MT) Forecast by End User, 2018 to 2033

Table 47: South Asia Value (US$ million) Forecast by Distribution Channel, 2018 to 2033

Table 48: South Asia Volume (MT) Forecast by Distribution Channel, 2018 to 2033

Table 49: Oceania Value (US$ million) Forecast by Country, 2018 to 2033

Table 50: Oceania Volume (MT) Forecast by Country, 2018 to 2033

Table 51: Oceania Value (US$ million) Forecast by Product Type, 2018 to 2033

Table 52: Oceania Volume (MT) Forecast by Product Type, 2018 to 2033

Table 53: Oceania Value (US$ million) Forecast by End User, 2018 to 2033

Table 54: Oceania Volume (MT) Forecast by End User, 2018 to 2033

Table 55: Oceania Value (US$ million) Forecast by Distribution Channel, 2018 to 2033

Table 56: Oceania Volume (MT) Forecast by Distribution Channel, 2018 to 2033

Table 57: MEA Value (US$ million) Forecast by Country, 2018 to 2033

Table 58: MEA Volume (MT) Forecast by Country, 2018 to 2033

Table 59: MEA Value (US$ million) Forecast by Product Type, 2018 to 2033

Table 60: MEA Volume (MT) Forecast by Product Type, 2018 to 2033

Table 61: MEA Value (US$ million) Forecast by End User, 2018 to 2033

Table 62: MEA Volume (MT) Forecast by End User, 2018 to 2033

Table 63: MEA Value (US$ million) Forecast by Distribution Channel, 2018 to 2033

Table 64: MEA Volume (MT) Forecast by Distribution Channel, 2018 to 2033

List of Charts

Figure 1: Global Value (US$ million) by Product Type, 2023 to 2033

Figure 2: Global Value (US$ million) by End User, 2023 to 2033

Figure 3: Global Value (US$ million) by Distribution Channel, 2023 to 2033

Figure 4: Global Value (US$ million) by Region, 2023 to 2033

Figure 5: Global Value (US$ million) Analysis by Region, 2018 to 2033

Figure 6: Global Volume (MT) Analysis by Region, 2018 to 2033

Figure 7: Global Value Share (%) and BPS Analysis by Region, 2023 to 2033

Figure 8: Global Y-o-Y Growth (%) Projections by Region, 2023 to 2033

Figure 9: Global Value (US$ million) Analysis by Product Type, 2018 to 2033

Figure 10: Global Volume (MT) Analysis by Product Type, 2018 to 2033

Figure 11: Global Value Share (%) and BPS Analysis by Product Type, 2023 to 2033

Figure 12: Global Y-o-Y Growth (%) Projections by Product Type, 2023 to 2033

Figure 13: Global Value (US$ million) Analysis by End User, 2018 to 2033

Figure 14: Global Volume (MT) Analysis by End User, 2018 to 2033

Figure 15: Global Value Share (%) and BPS Analysis by End User, 2023 to 2033

Figure 16: Global Y-o-Y Growth (%) Projections by End User, 2023 to 2033

Figure 17: Global Value (US$ million) Analysis by Distribution Channel, 2018 to 2033

Figure 18: Global Volume (MT) Analysis by Distribution Channel, 2018 to 2033

Figure 19: Global Value Share (%) and BPS Analysis by Distribution Channel, 2023 to 2033

Figure 20: Global Y-o-Y Growth (%) Projections by Distribution Channel, 2023 to 2033

Figure 21: Global Attractiveness by Product Type, 2023 to 2033

Figure 22: Global Attractiveness by End User, 2023 to 2033

Figure 23: Global Attractiveness by Distribution Channel, 2023 to 2033

Figure 24: Global Attractiveness by Region, 2023 to 2033

Figure 25: North America Value (US$ million) by Product Type, 2023 to 2033

Figure 26: North America Value (US$ million) by End User, 2023 to 2033

Figure 27: North America Value (US$ million) by Distribution Channel, 2023 to 2033

Figure 28: North America Value (US$ million) by Country, 2023 to 2033

Figure 29: North America Value (US$ million) Analysis by Country, 2018 to 2033

Figure 30: North America Volume (MT) Analysis by Country, 2018 to 2033

Figure 31: North America Value Share (%) and BPS Analysis by Country, 2023 to 2033

Figure 32: North America Y-o-Y Growth (%) Projections by Country, 2023 to 2033

Figure 33: North America Value (US$ million) Analysis by Product Type, 2018 to 2033

Figure 34: North America Volume (MT) Analysis by Product Type, 2018 to 2033

Figure 35: North America Value Share (%) and BPS Analysis by Product Type, 2023 to 2033

Figure 36: North America Y-o-Y Growth (%) Projections by Product Type, 2023 to 2033

Figure 37: North America Value (US$ million) Analysis by End User, 2018 to 2033

Figure 38: North America Volume (MT) Analysis by End User, 2018 to 2033

Figure 39: North America Value Share (%) and BPS Analysis by End User, 2023 to 2033

Figure 40: North America Y-o-Y Growth (%) Projections by End User, 2023 to 2033

Figure 41: North America Value (US$ million) Analysis by Distribution Channel, 2018 to 2033

Figure 42: North America Volume (MT) Analysis by Distribution Channel, 2018 to 2033

Figure 43: North America Value Share (%) and BPS Analysis by Distribution Channel, 2023 to 2033

Figure 44: North America Y-o-Y Growth (%) Projections by Distribution Channel, 2023 to 2033

Figure 45: North America Attractiveness by Product Type, 2023 to 2033

Figure 46: North America Attractiveness by End User, 2023 to 2033

Figure 47: North America Attractiveness by Distribution Channel, 2023 to 2033

Figure 48: North America Attractiveness by Country, 2023 to 2033

Figure 49: Latin America Value (US$ million) by Product Type, 2023 to 2033

Figure 50: Latin America Value (US$ million) by End User, 2023 to 2033

Figure 51: Latin America Value (US$ million) by Distribution Channel, 2023 to 2033

Figure 52: Latin America Value (US$ million) by Country, 2023 to 2033

Figure 53: Latin America Value (US$ million) Analysis by Country, 2018 to 2033

Figure 54: Latin America Volume (MT) Analysis by Country, 2018 to 2033

Figure 55: Latin America Value Share (%) and BPS Analysis by Country, 2023 to 2033

Figure 56: Latin America Y-o-Y Growth (%) Projections by Country, 2023 to 2033

Figure 57: Latin America Value (US$ million) Analysis by Product Type, 2018 to 2033

Figure 58: Latin America Volume (MT) Analysis by Product Type, 2018 to 2033

Figure 59: Latin America Value Share (%) and BPS Analysis by Product Type, 2023 to 2033

Figure 60: Latin America Y-o-Y Growth (%) Projections by Product Type, 2023 to 2033

Figure 61: Latin America Value (US$ million) Analysis by End User, 2018 to 2033

Figure 62: Latin America Volume (MT) Analysis by End User, 2018 to 2033

Figure 63: Latin America Value Share (%) and BPS Analysis by End User, 2023 to 2033

Figure 64: Latin America Y-o-Y Growth (%) Projections by End User, 2023 to 2033

Figure 65: Latin America Value (US$ million) Analysis by Distribution Channel, 2018 to 2033

Figure 66: Latin America Volume (MT) Analysis by Distribution Channel, 2018 to 2033

Figure 67: Latin America Value Share (%) and BPS Analysis by Distribution Channel, 2023 to 2033

Figure 68: Latin America Y-o-Y Growth (%) Projections by Distribution Channel, 2023 to 2033

Figure 69: Latin America Attractiveness by Product Type, 2023 to 2033

Figure 70: Latin America Attractiveness by End User, 2023 to 2033

Figure 71: Latin America Attractiveness by Distribution Channel, 2023 to 2033

Figure 72: Latin America Attractiveness by Country, 2023 to 2033

Figure 73: Europe Value (US$ million) by Product Type, 2023 to 2033

Figure 74: Europe Value (US$ million) by End User, 2023 to 2033

Figure 75: Europe Value (US$ million) by Distribution Channel, 2023 to 2033

Figure 76: Europe Value (US$ million) by Country, 2023 to 2033

Figure 77: Europe Value (US$ million) Analysis by Country, 2018 to 2033

Figure 78: Europe Volume (MT) Analysis by Country, 2018 to 2033

Figure 79: Europe Value Share (%) and BPS Analysis by Country, 2023 to 2033

Figure 80: Europe Y-o-Y Growth (%) Projections by Country, 2023 to 2033

Figure 81: Europe Value (US$ million) Analysis by Product Type, 2018 to 2033

Figure 82: Europe Volume (MT) Analysis by Product Type, 2018 to 2033

Figure 83: Europe Value Share (%) and BPS Analysis by Product Type, 2023 to 2033

Figure 84: Europe Y-o-Y Growth (%) Projections by Product Type, 2023 to 2033

Figure 85: Europe Value (US$ million) Analysis by End User, 2018 to 2033

Figure 86: Europe Volume (MT) Analysis by End User, 2018 to 2033

Figure 87: Europe Value Share (%) and BPS Analysis by End User, 2023 to 2033

Figure 88: Europe Y-o-Y Growth (%) Projections by End User, 2023 to 2033

Figure 89: Europe Value (US$ million) Analysis by Distribution Channel, 2018 to 2033

Figure 90: Europe Volume (MT) Analysis by Distribution Channel, 2018 to 2033

Figure 91: Europe Value Share (%) and BPS Analysis by Distribution Channel, 2023 to 2033

Figure 92: Europe Y-o-Y Growth (%) Projections by Distribution Channel, 2023 to 2033

Figure 93: Europe Attractiveness by Product Type, 2023 to 2033

Figure 94: Europe Attractiveness by End User, 2023 to 2033

Figure 95: Europe Attractiveness by Distribution Channel, 2023 to 2033

Figure 96: Europe Attractiveness by Country, 2023 to 2033

Figure 97: East Asia Value (US$ million) by Product Type, 2023 to 2033

Figure 98: East Asia Value (US$ million) by End User, 2023 to 2033

Figure 99: East Asia Value (US$ million) by Distribution Channel, 2023 to 2033

Figure 100: East Asia Value (US$ million) by Country, 2023 to 2033

Figure 101: East Asia Value (US$ million) Analysis by Country, 2018 to 2033

Figure 102: East Asia Volume (MT) Analysis by Country, 2018 to 2033

Figure 103: East Asia Value Share (%) and BPS Analysis by Country, 2023 to 2033

Figure 104: East Asia Y-o-Y Growth (%) Projections by Country, 2023 to 2033

Figure 105: East Asia Value (US$ million) Analysis by Product Type, 2018 to 2033

Figure 106: East Asia Volume (MT) Analysis by Product Type, 2018 to 2033

Figure 107: East Asia Value Share (%) and BPS Analysis by Product Type, 2023 to 2033

Figure 108: East Asia Y-o-Y Growth (%) Projections by Product Type, 2023 to 2033

Figure 109: East Asia Value (US$ million) Analysis by End User, 2018 to 2033

Figure 110: East Asia Volume (MT) Analysis by End User, 2018 to 2033

Figure 111: East Asia Value Share (%) and BPS Analysis by End User, 2023 to 2033

Figure 112: East Asia Y-o-Y Growth (%) Projections by End User, 2023 to 2033

Figure 113: East Asia Value (US$ million) Analysis by Distribution Channel, 2018 to 2033

Figure 114: East Asia Volume (MT) Analysis by Distribution Channel, 2018 to 2033

Figure 115: East Asia Value Share (%) and BPS Analysis by Distribution Channel, 2023 to 2033

Figure 116: East Asia Y-o-Y Growth (%) Projections by Distribution Channel, 2023 to 2033

Figure 117: East Asia Attractiveness by Product Type, 2023 to 2033

Figure 118: East Asia Attractiveness by End User, 2023 to 2033

Figure 119: East Asia Attractiveness by Distribution Channel, 2023 to 2033

Figure 120: East Asia Attractiveness by Country, 2023 to 2033

Figure 121: South Asia Value (US$ million) by Product Type, 2023 to 2033

Figure 122: South Asia Value (US$ million) by End User, 2023 to 2033

Figure 123: South Asia Value (US$ million) by Distribution Channel, 2023 to 2033

Figure 124: South Asia Value (US$ million) by Country, 2023 to 2033

Figure 125: South Asia Value (US$ million) Analysis by Country, 2018 to 2033

Figure 126: South Asia Volume (MT) Analysis by Country, 2018 to 2033

Figure 127: South Asia Value Share (%) and BPS Analysis by Country, 2023 to 2033

Figure 128: South Asia Y-o-Y Growth (%) Projections by Country, 2023 to 2033

Figure 129: South Asia Value (US$ million) Analysis by Product Type, 2018 to 2033

Figure 130: South Asia Volume (MT) Analysis by Product Type, 2018 to 2033

Figure 131: South Asia Value Share (%) and BPS Analysis by Product Type, 2023 to 2033

Figure 132: South Asia Y-o-Y Growth (%) Projections by Product Type, 2023 to 2033

Figure 133: South Asia Value (US$ million) Analysis by End User, 2018 to 2033

Figure 134: South Asia Volume (MT) Analysis by End User, 2018 to 2033

Figure 135: South Asia Value Share (%) and BPS Analysis by End User, 2023 to 2033

Figure 136: South Asia Y-o-Y Growth (%) Projections by End User, 2023 to 2033

Figure 137: South Asia Value (US$ million) Analysis by Distribution Channel, 2018 to 2033

Figure 138: South Asia Volume (MT) Analysis by Distribution Channel, 2018 to 2033

Figure 139: South Asia Value Share (%) and BPS Analysis by Distribution Channel, 2023 to 2033

Figure 140: South Asia Y-o-Y Growth (%) Projections by Distribution Channel, 2023 to 2033

Figure 141: South Asia Attractiveness by Product Type, 2023 to 2033

Figure 142: South Asia Attractiveness by End User, 2023 to 2033

Figure 143: South Asia Attractiveness by Distribution Channel, 2023 to 2033

Figure 144: South Asia Attractiveness by Country, 2023 to 2033

Figure 145: Oceania Value (US$ million) by Product Type, 2023 to 2033

Figure 146: Oceania Value (US$ million) by End User, 2023 to 2033

Figure 147: Oceania Value (US$ million) by Distribution Channel, 2023 to 2033

Figure 148: Oceania Value (US$ million) by Country, 2023 to 2033

Figure 149: Oceania Value (US$ million) Analysis by Country, 2018 to 2033

Figure 150: Oceania Volume (MT) Analysis by Country, 2018 to 2033

Figure 151: Oceania Value Share (%) and BPS Analysis by Country, 2023 to 2033

Figure 152: Oceania Y-o-Y Growth (%) Projections by Country, 2023 to 2033

Figure 153: Oceania Value (US$ million) Analysis by Product Type, 2018 to 2033

Figure 154: Oceania Volume (MT) Analysis by Product Type, 2018 to 2033

Figure 155: Oceania Value Share (%) and BPS Analysis by Product Type, 2023 to 2033

Figure 156: Oceania Y-o-Y Growth (%) Projections by Product Type, 2023 to 2033

Figure 157: Oceania Value (US$ million) Analysis by End User, 2018 to 2033

Figure 158: Oceania Volume (MT) Analysis by End User, 2018 to 2033

Figure 159: Oceania Value Share (%) and BPS Analysis by End User, 2023 to 2033

Figure 160: Oceania Y-o-Y Growth (%) Projections by End User, 2023 to 2033

Figure 161: Oceania Value (US$ million) Analysis by Distribution Channel, 2018 to 2033

Figure 162: Oceania Volume (MT) Analysis by Distribution Channel, 2018 to 2033

Figure 163: Oceania Value Share (%) and BPS Analysis by Distribution Channel, 2023 to 2033

Figure 164: Oceania Y-o-Y Growth (%) Projections by Distribution Channel, 2023 to 2033

Figure 165: Oceania Attractiveness by Product Type, 2023 to 2033

Figure 166: Oceania Attractiveness by End User, 2023 to 2033

Figure 167: Oceania Attractiveness by Distribution Channel, 2023 to 2033

Figure 168: Oceania Attractiveness by Country, 2023 to 2033

Figure 169: MEA Value (US$ million) by Product Type, 2023 to 2033

Figure 170: MEA Value (US$ million) by End User, 2023 to 2033

Figure 171: MEA Value (US$ million) by Distribution Channel, 2023 to 2033

Figure 172: MEA Value (US$ million) by Country, 2023 to 2033

Figure 173: MEA Value (US$ million) Analysis by Country, 2018 to 2033

Figure 174: MEA Volume (MT) Analysis by Country, 2018 to 2033

Figure 175: MEA Value Share (%) and BPS Analysis by Country, 2023 to 2033

Figure 176: MEA Y-o-Y Growth (%) Projections by Country, 2023 to 2033

Figure 177: MEA Value (US$ million) Analysis by Product Type, 2018 to 2033

Figure 178: MEA Volume (MT) Analysis by Product Type, 2018 to 2033

Figure 179: MEA Value Share (%) and BPS Analysis by Product Type, 2023 to 2033

Figure 180: MEA Y-o-Y Growth (%) Projections by Product Type, 2023 to 2033

Figure 181: MEA Value (US$ million) Analysis by End User, 2018 to 2033

Figure 182: MEA Volume (MT) Analysis by End User, 2018 to 2033

Figure 183: MEA Value Share (%) and BPS Analysis by End User, 2023 to 2033

Figure 184: MEA Y-o-Y Growth (%) Projections by End User, 2023 to 2033

Figure 185: MEA Value (US$ million) Analysis by Distribution Channel, 2018 to 2033

Figure 186: MEA Volume (MT) Analysis by Distribution Channel, 2018 to 2033

Figure 187: MEA Value Share (%) and BPS Analysis by Distribution Channel, 2023 to 2033

Figure 188: MEA Y-o-Y Growth (%) Projections by Distribution Channel, 2023 to 2033

Figure 189: MEA Attractiveness by Product Type, 2023 to 2033

Figure 190: MEA Attractiveness by End User, 2023 to 2033

Figure 191: MEA Attractiveness by Distribution Channel, 2023 to 2033

Figure 192: MEA Attractiveness by Country, 2023 to 2033

Explore Process Automation Insights

View Reports

Commercial Bar Supplies Market