Reports

- Global Locations -

Headquarters

Future Market Insights, Inc.

Christiana Corporate, 200
Continental Drive, Suite 401,
Newark, Delaware - 19713,
United States

T: +1-845-579-5705

Americas

Future Market Insights, Inc.

616 Corporate Way, Suite 2-9018,
Valley Cottage, NY 10989, United States

T: +1-347-918-3531

MEA

Future Market Insights

1602-6 Jumeirah Bay X2 Tower, Plot No: JLT-PH2-X2A,
Jumeirah Lakes Towers, Dubai,
United Arab Emirates

Europe

Future Market Insights

3rd Floor, 207 Regent Street,
W1B 3HH London
United Kingdom

T: + 44 (0) 20 8123 9659
D: +44 (0) 20 3287 4268

Asia Pacific

Future Market Insights

IndiaLand Global Tech Park, Unit UG-1, Behind Grand HighStreet, Phase 1, Hinjawadi, MH, Pune – 411057, India

Commercial Cooking Equipment Market Outlook (2023 to 2033)

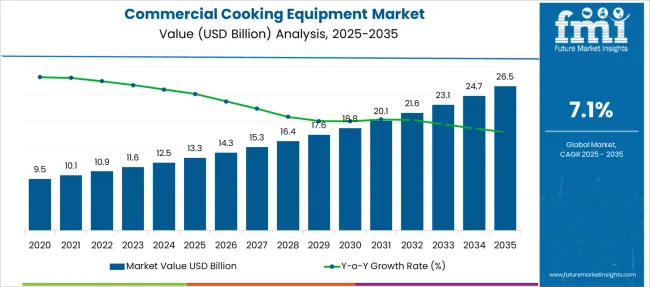
The global commercial cooking equipment market is expected to grow from US$ 11,631.0 Million in 2023 to US$ 23,094.7 Million by 2033, with overall sales accelerating at 7.1% CAGR throughout the forecast period (2023-2033). The rapid expansion of the HoReCa sector across the world is a key factor boosting sales of commercial cooking equipment in the market.

Commercial cooking equipments are machines or tools used for cooking food in commercial kitchens. This equipment includes broilers, cook-chill systems, fryers, ovens, cookers, ranges, kettles, steamers, etc.

They are being extensively used in the food service industry sectors such as restaurants, hotels, and catering. They allow end users like quick service restaurants to get food to customers as quickly as possible and save precious space in order to offset skyrocketing operating, food, labor, and real estate costs. Thus, the growth of these sectors will eventually boost the global commercial cooking equipment market during the forecast period.

Similarly, the growing popularity of fast foods like burgers, chicken, pizza, sandwiches, and short-order meals that do not require table service are expected to push the demand for commercial cooking equipment during the next ten years.

Furthermore, the substantial development in the commercial use of cooking equipment, particularly from emerging nations is anticipated to drive the expansion of the global commercial cooking equipment market.

In addition to this, the development of advanced commercial cooking equipment is expected to generate lucrative growth avenues for the commercial cooking equipment market over the next ten years.

Leading manufacturers are integrating novel technologies like the internet of things (IoT) and artificial intelligence (AI) in commercial cooking equipment to make them more appealing to end users. This will help the overall market to grow swiftly.

Regionally, North America holds the largest market share of the global commercial cooking equipment market and the trend is likely to continue during the forecast period. This can be attributed to the increasing number of food joints such as hotels and restaurants across countries like the U.S. and Canada.

Attribute Key Statistics
Commercial Cooking Equipment Market Estimated Value (2023) US$ 11,631.0 Million
Projected Market Value (2033) US$ 23,094.7 Million
Value-based CAGR (2023 to 2033) 7.1%

Don't pay for what you don't need

Customize your report by selecting specific countries or regions and save 30%!

2018 to 2022 Commercial Cooking Equipment Market Outlook Compared to 2023 to 2033 Forecast

The global commercial cooking equipment market is anticipated to expand at 7.1% CAGR between 2023 and 2033 in comparison to the 5.4% CAGR registered during the historical period from 2018 to 2022.

The rapid expansion of the food service industry across the world and increasing consumption of fast food are some of the key factors providing impetus to the growth of the commercial cooking equipment market.

Commercial cooking equipment is being increasingly used in restaurants, hotels, and other commercial kitchens for the preparation of food. These machines allow end users to prepare a wide range of food products in quick intervals of time while minimizing human intervention.

Thus, the increasing number of restaurants and hotels along with the growing demand for fast food across the globe will continue to boost the worldwide commercial equipment market. Similarly, advancements in cooking technology and growing demand for multi-functional, efficient, and space and time-saving commercial cooking equipment are expected to further aid in the expansion of the global market.

Market-o-nomics - Highlighting the Key Trends

A number of influential factors have been identified that are expected to drive the global commercial equipment market forward during the projection period (2023 to 2033). Besides the proliferating aspects prevailing in the market, the analysts at FMI have also analyzed the restraining elements, lucrative opportunities, and upcoming threats that can somehow impact market dynamics.

The drivers, restraints, opportunities, and threats (DROTs) identified are as follows:

DRIVERS

  • Rapid growth of hospitality sector across the globe is expected to drive the global commercial cooking equipment market swiftly during the forecast period.
  • A growing number of quick-service restaurants across developed and developing regions will generate high demand for commercial cooking equipment in the market

RESTRAINTS

  • Exorbitant prices of advanced commercial cooking equipment are expected to stymie the growth of the commercial cooking equipment market in low-income regions throughout the forecast period.

OPPORTUNITIES

  • Integration of novel technologies such as internet of things (IoT) in commercial cooking equipment is expected to generate lucrative growth opportunities for the market.
  • The development of compact and cost-effective products will further boost the market.

THREATS

  • High maintenance costs of commercial cooking equipment may limit market expansion during the forecast period.
  • The rising energy crisis is also likely to negatively impact the growth of the commercial cooking equipment market.
Nandini Roy Choudhury

Principal Consultant

Talk to Analyst

Find your sweet spots for generating winning opportunities in this market.

Country-wise Insights

How is the US Commercial Cooking Equipment Market Shaping?

“Rising Consumer Spending Boosting the US Market”

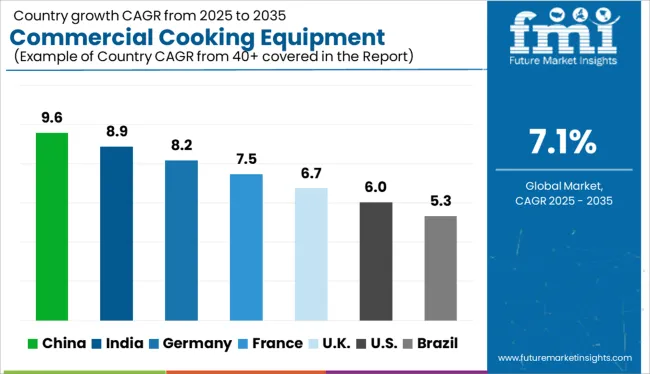
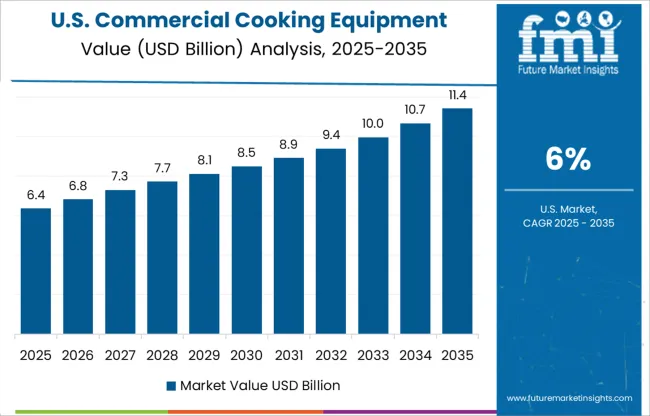
The US commercial cooking equipment market is currently valued at around US$ 1,344.5 Mn and it accounts for 34% of the overall North American commercial cooking equipment market. This is due to a boom in fast food and quick service restaurants and rising consumer spending on fast food across the United States.

In recent years, changing lifestyles and increasing consumer spending has boosted sales across restaurants in the US According to the National Restaurant Association, despite the COVID-19 impact, restaurant industry sales totaled US$ 799 billion in 2021. This will continue to boost the commercial cooking equipment market in the country during the forecast period.

Similarly, the growing need for preparing food in a short time and maintaining the freshness of the food along with the rising popularity of cloud kitchens n is increasing the demand for commercial cooking equipment across the country.

What Will Growth Unfold in the UK Commercial Cooking Equipment Market?

“Rapid Expansion of Food Service Industry Pushing Demand in the UK Market”

The UK commercial cooking equipment market is expected to surpass a valuation of US$ 1,191.0 Million in 2023 and further expand at a robust pace during the next ten years. Currently, the UK holds around 32% share of the Europe commercial cooking equipment market.

Growth in the UK commercial cooking equipment market is driven by rapid urbanization and the booming food service industry. In recent years, there has been a substantial rise in the number of quick-service restaurants across the UK This has generated huge demand for advanced cooking equipment and the trend is likely to continue during the forecast period.

Why is China Emerging as a Lucrative Commercial Cooking Equipment Market?

“Rapidly Growing Population and Availability of Low-Cost Products is Boosting Sales in China”

According to FMI, China's commercial cooking equipment market is valued at over US$ 977.0 Mn and it accounts for 35% of the Asia pacific commercial cooking equipment market. This can be attributed to the rising fast-food consumption across the country due to the rapidly growing population and economic boom.

Similarly, the easy availability of advanced commercial cooking equipment at much lower prices is positively influencing the commercial cooking equipment market in the country.

Category-wise Insights

Which is the Top Selling Product Type in the global Commercial Cooking Equipment Market?

“Ranges Remain the Top Selling Product Type Category”

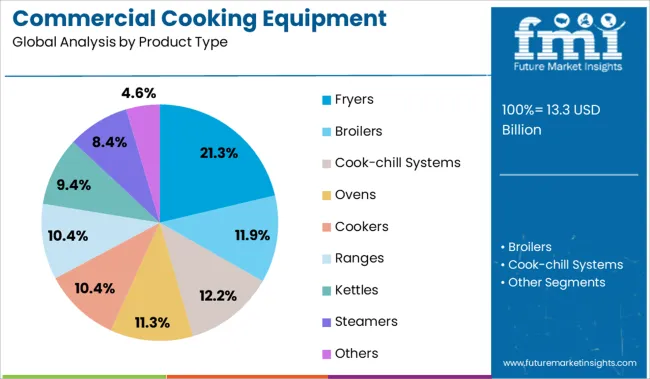
As per FMI, the ranges segment currently holds the largest market share of the global commercial cooking equipment market and it is expected to grow at a healthy pace during the next ten years. This can be attributed to the rising adoption of ranges across various end-use sectors.

End users like restaurants and hotels are continuously investing in cooking ranges that are time and space-saving and can easily perform multiple functions of cooking, boiling, grilling, frying, and baking.

However, the fryer segment is likely to grow at the highest CAGR during the forecast period, owing to the increasing usage of commercial fryers for deep-fat frying a variety of foods including meats and vegetables like fries, onion rings, or tempura.

Which is the Most Lucrative Application for Commercial Cooking Equipment?

“Quick Service Restaurants to Generate Maximum Revenues”

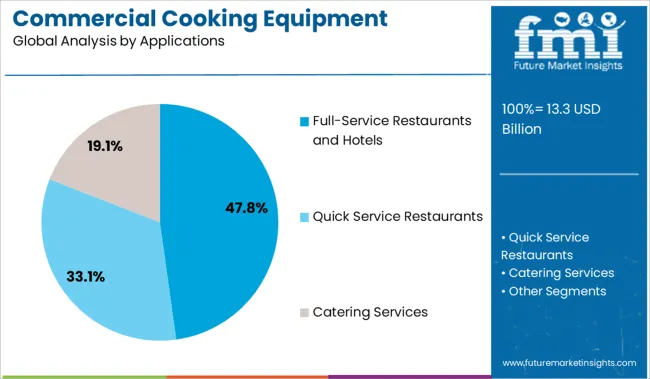
Based on applications, the global commercial cooking equipment market is segmented into full-service restaurants and hotels, quick-service restaurants, and catering services. Among these quick service restaurants segment holds the largest revenue share and it is expected to grow at the highest CAGR during the projection period.

The growth of the target segment is attributed to the rising adoption of commercial cooking equipment across quick-service restaurants.

In recent years, factors such as growing consumer preference for fast food, changing lifestyles, an increase in the working women population, and rapid urbanization have resulted in the expansion of quick service restaurants globally and the trend is likely to continue during the forecast period. This in turn will generate high demand for commercial cooking equipment like broilers, fryers, ovens, cookers, ranges, and kettles.
Get the data you need at a Fraction of the cost

Personalize your report by choosing insights you need
and save 40%!

Competitive Landscape

The global commercial cooking equipment market has become highly competitive due to the large presence of regional and domestic players. In order to capitalize and gain an upper hand in the market, companies are adopting strategies such as new product launches, mergers, acquisitions, collaborations, partnerships, and the strengthening of distribution channels. For instance,

  • In 2021, Marra Forni, the American manufacturer of award-winning Italian-inspired brick ovens, launched ELECTRO Series Models ELST5532-1 through ELST5532-4.
  • To grow its commercial operations and seize the pacific market, Alto Shaam Inc. expanded in Australia and New Zealand in January 2022.
  • A new addition of Char-Griller was announced by Middleby Corporation in February 2022, along with the acquisition of Kamado Joe and Masterbuilt.
  • Blodgett Corporation introduced its freestanding vent hood convection oven with touch controls in February 2021 for fast-casual restaurants, institutional kitchens, hospitals, and other food service establishments.

The ever-increasing demand for commercial cooking equipment has tempted various companies to enter this market space. As a result, there has been a rapid rise in the number of start-ups offering cooking equipment for commercial kitchens. One such company is Srihari Kitchen Equipment.

Headquartered in Coimbatore, Tamil Naidu India, Srihari Kitchen Equipment is a privately held company founded in 2010. The company manufactures and supplies a wide range of cooking equipment to end users like restaurants and hotels.

Since its establishment, Srihari Kitchen Equipment has become a leading manufacturer and exporter of equipment for commercial kitchens, canteens, bakeries, hotels & messes, etc. The company offers high-quality and cost-efficient kitchen equipment like gas ranges.

Commercial Cooking Equipment Market Report Scope

Attribute Details
Estimated Market Size (2023) US$ 11,631.0 Million
Projected Market Size (2033) US$ 23,094.7 Million
Anticipated Growth Rate (2023 to 2033) 7.1%
Forecast Period 2023 to 2033
Historical Data Available for 2018 to 2022
Market Analysis US$ Million for Value and Units for Volume
Key Regions Covered
  • North America
  • Latin America
  • Europe
  • Asia Pacific
  • Oceania
  • Middle East & Africa (MEA)
Key Countries Covered
  • The USA
  • Canada
  • Mexico
  • Germany
  • The UK
  • France
  • Italy
  • Spain
  • China
  • Japan
  • India
  • South Korea
  • Australia
  • Brazil
  • Argentina
  • South Africa
  • UAE
Key Segments Covered
  • Product Type
  • Applications
  • Region
Key Companies Profiled
  • Ali S.p.A
  • Illinois Tool Works Inc.
  • Duke Manufacturing Co. Inc.
  • The Middleby Corporation
  • Alto-Shaam, Inc.
  • Edward Don & Company
  • Fujimak Corporation
  • Manitowac Company Inc.
  • Rational AG and AB Electrolux.
  • ACP, Inc.
  • AMTek Microwaves
  • Bizerba USA Inc.
  • Caddy Corporation
  • Duke Manufacturing Co.
  • Electrolux AB
  • R.M Kitchen Equipments Pvt. Ltd.
  • RM GASTRO s.r.o.
Report Coverage Market Forecast, Company Share Analysis, Competitive Landscape, DROT Analysis, Market Dynamics and Challenges, and Strategic Growth Initiatives

Commercial Cooking Equipment Market by Category

By Product Type:

  • Broilers
  • Cook-chill Systems
  • Fryers
  • Ovens
  • Cookers
  • Ranges
  • Kettles
  • Steamers
  • Others

By Applications:

  • Full-Service Restaurants and Hotels
  • Quick Service Restaurants
  • Catering Services

By Region:

  • North America
  • Latin America
  • Europe
  • East Asia
  • South Asia
  • Oceania
  • Middle East & Africa (MEA)

Frequently Asked Questions

How big is the commercial cooking equipment market?

The worldwide commercial cooking equipment market size is expected to reach US$ 11,631.0 Million in 2023.

At what rate will the commercial cooking equipment market grow during the forecast period?

As per FMI, the global commercial cooking equipment market is expected to grow at a CAGR of 7.1% during the forecast period.

What is the projected valuation for the commercial cooking equipment market in 2033?

The global commercial cooking equipment market is projected to surpass a valuation of US$ 23,094.7 Million by 2033.

Which are the major countries driving demand for the commercial cooking equipment?

The US, China, the UK, Germany, and Mexico are the major countries driving demand for commercial cooking equipment.

Who are the top 5 players operating in the commercial cooking equipment market?

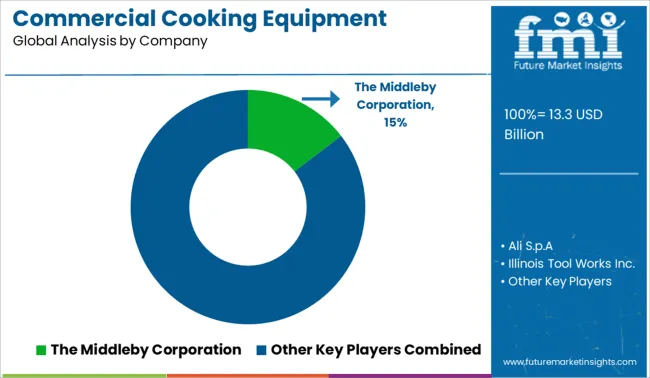
Ali S.p.A, Illinois Tool Works Inc., Duke Manufacturing Co. Inc., The Middleby Corporation, and Alto-Shaam, Inc. are expected to be the top players in the commercial cooking equipment market.

Table of Content

1. Executive Summary | Commercial Cooking Equipment Market

    1.1. Global Market Outlook

    1.2. Demand-side Trends

    1.3. Supply-side Trends

    1.4. Technology Roadmap Analysis

    1.5. Analysis and Recommendations

2. Market Overview

    2.1. Market Coverage / Taxonomy

    2.2. Market Definition / Scope / Limitations

3. Market Background

    3.1. Market Dynamics

        3.1.1. Drivers

        3.1.2. Restraints

        3.1.3. Opportunity

        3.1.4. Trends

    3.2. Scenario Forecast

        3.2.1. Demand in Optimistic Scenario

        3.2.2. Demand in Likely Scenario

        3.2.3. Demand in Conservative Scenario

    3.3. Product launches & Recent Developments

    3.4. Product Life Cycle Analysis

    3.5. Value Chain Analysis

        3.5.1. Supply Side Participants and their Roles

            3.5.1.1. Producers

            3.5.1.2. Mid-Level Participants (Traders / Agents / Brokers)

            3.5.1.3. Wholesalers and Distributors

        3.5.2. % of Operating Margin Analysis

        3.5.3. List of Raw Material Suppliers

        3.5.4. List of Existing and Potential Buyers

    3.6. Global Market - Pricing Analysis

        3.6.1. Price Point Assessment by Region

        3.6.2. Price Point Assessment by Product Type

        3.6.3. Price Forecast till 2033

        3.6.4. Factors affecting Pricing

    3.7. Forecast Factors - Relevance & Impact

    3.8. Regulatory Landscape

        3.8.1. Packaging & Labelling Regulations

        3.8.2. Certifications and Certifying Agency Overview

        3.8.3. Import/Export Policies

    3.9. Regional Parent Market Outlook

    3.10. Consumers Survey Analysis

    3.11. Macro-Economic Factors

    3.12. Product Claims & Nutritional Information scanned by Buyers

4. Global Market Analysis 2018 to 2022 and Forecast, 2023 to 2033

    4.1. Historical Market Size Value (US$ Million) & Volume (MT) Analysis, 2018 to 2022

    4.2. Current and Future Market Size Value (US$ Million) & Volume (MT) Projections, 2023 to 2033

        4.2.1. Y-o-Y Growth Trend Analysis

        4.2.2. Absolute $ Opportunity Analysis

5. Global Market Analysis 2018 to 2022 and Forecast 2023 to 2033, By Product Type

    5.1. Introduction / Key Findings

    5.2. Historical Market Size Value (US$ Million) & Volume (MT) Analysis By Product Type, 2018 to 2022

    5.3. Current and Future Market Size Value (US$ Million) & Volume (MT) Analysis and Forecast By Product Type, 2023 to 2033

        5.3.1. Broilers

        5.3.2. Cook-Chill Systems

        5.3.3. Fryers

        5.3.4. Ovens

        5.3.5. Cookers

        5.3.6. Rangers

        5.3.7. Kettles

        5.3.8. Steamers

        5.3.9. Others

    5.4. Y-o-Y Growth Trend Analysis By Product Type, 2018 to 2022

    5.5. Absolute $ Opportunity Analysis By Product Type, 2023 to 2033

6. Global Market Analysis 2018 to 2022 and Forecast 2023 to 2033, By Applications

    6.1. Introduction / Key Findings

    6.2. Historical Market Size Value (US$ Million) & Volume (MT) Analysis By Applications, 2018 to 2022

    6.3. Current and Future Market Size Value (US$ Million) & Volume (MT) Analysis and Forecast By Applications, 2023 to 2033

        6.3.1. Full-Services Restaurants and Hotels

        6.3.2. Quick Service Restaurants

        6.3.3. Catering Services

    6.4. Y-o-Y Growth Trend Analysis By Applications, 2018 to 2022

    6.5. Absolute $ Opportunity Analysis By Applications, 2023 to 2033

7. Global Market Analysis 2018 to 2022 and Forecast 2023 to 2033, By Region

    7.1. Introduction

    7.2. Historical Market Size Value (US$ Million) & Volume (MT) Analysis By Region, 2018 to 2022

    7.3. Current Market Size Value (US$ Million) & Volume (MT) Analysis and Forecast By Region, 2023 to 2033

        7.3.1. North America

        7.3.2. Latin America

        7.3.3. Europe

        7.3.4. East Asia

        7.3.5. South Asia

        7.3.6. Oceania

        7.3.7. Middle East & Africa (MEA)

    7.4. Market Attractiveness Analysis By Region

8. North America Market Analysis 2018 to 2022 and Forecast 2023 to 2033, By Country

    8.1. Historical Market Size Value (US$ Million) & Volume (MT) Trend Analysis By Market Taxonomy, 2018 to 2022

    8.2. Market Size Value (US$ Million) & Volume (MT) Forecast By Market Taxonomy, 2023 to 2033

        8.2.1. By Country

            8.2.1.1. The US

            8.2.1.2. Canada

        8.2.2. By Product Type

        8.2.3. By Applications

    8.3. Market Attractiveness Analysis

        8.3.1. By Country

        8.3.2. By Product Type

        8.3.3. By Applications

    8.4. Key Takeaways

9. Latin America Market Analysis 2018 to 2022 and Forecast 2023 to 2033, By Country

    9.1. Historical Market Size Value (US$ Million) & Volume (MT) Trend Analysis By Market Taxonomy, 2018 to 2022

    9.2. Market Size Value (US$ Million) & Volume (MT) Forecast By Market Taxonomy, 2023 to 2033

        9.2.1. By Country

            9.2.1.1. Brazil

            9.2.1.2. Mexico

            9.2.1.3. Argentina

            9.2.1.4. Chile

            9.2.1.5. Peru

            9.2.1.6. Rest of Latin America

        9.2.2. By Product Type

        9.2.3. By Applications

    9.3. Market Attractiveness Analysis

        9.3.1. By Country

        9.3.2. By Product Type

        9.3.3. By Applications

    9.4. Key Takeaways

10. Europe Market Analysis 2018 to 2022 and Forecast 2023 to 2033, By Country

    10.1. Historical Market Size Value (US$ Million) & Volume (MT) Trend Analysis By Market Taxonomy, 2018 to 2022

    10.2. Market Size Value (US$ Million) & Volume (MT) Forecast By Market Taxonomy, 2023 to 2033

        10.2.1. By Country

            10.2.1.1. Germany

            10.2.1.2. Italy

            10.2.1.3. France

            10.2.1.4. The UK

            10.2.1.5. Spain

            10.2.1.6. Russia

            10.2.1.7. BENELUX

            10.2.1.8. Poland

            10.2.1.9. Nordic Countries

            10.2.1.10. Rest of Europe

        10.2.2. By Product Type

        10.2.3. By Applications

    10.3. Market Attractiveness Analysis

        10.3.1. By Country

        10.3.2. By Product Type

        10.3.3. By Applications

    10.4. Key Takeaways

11. East Asia Market Analysis 2018 to 2022 and Forecast 2023 to 2033, By Country

    11.1. Historical Market Size Value (US$ Million) & Volume (MT) Trend Analysis By Market Taxonomy, 2018 to 2022

    11.2. Market Size Value (US$ Million) & Volume (MT) Forecast By Market Taxonomy, 2023 to 2033

        11.2.1. By Country

            11.2.1.1. China

            11.2.1.2. Japan

            11.2.1.3. South Korea

        11.2.2. By Product Type

        11.2.3. By Applications

    11.3. Market Attractiveness Analysis

        11.3.1. By Country

        11.3.2. By Product Type

        11.3.3. By Applications

    11.4. Key Takeaways

12. South Asia Market Analysis 2018 to 2022 and Forecast 2023 to 2033, By Country

    12.1. Historical Market Size Value (US$ Million) & Volume (MT) Trend Analysis By Market Taxonomy, 2018 to 2022

    12.2. Market Size Value (US$ Million) & Volume (MT) Forecast By Market Taxonomy, 2023 to 2033

        12.2.1. By Country

            12.2.1.1. India

            12.2.1.2. Thailand

            12.2.1.3. Malaysia

            12.2.1.4. Indonesia

            12.2.1.5. Rest of South Asia

        12.2.2. By Product Type

        12.2.3. By Applications

    12.3. Market Attractiveness Analysis

        12.3.1. By Country

        12.3.2. By Product Type

        12.3.3. By Applications

    12.4. Key Takeaways

13. Oceania Market Analysis 2018 to 2022 and Forecast 2023 to 2033, By Country

    13.1. Historical Market Size Value (US$ Million) & Volume (MT) Trend Analysis By Market Taxonomy, 2018 to 2022

    13.2. Market Size Value (US$ Million) & Volume (MT) Forecast By Market Taxonomy, 2023 to 2033

        13.2.1. By Country

            13.2.1.1. Australia

            13.2.1.2. New Zealand

        13.2.2. By Product Type

        13.2.3. By Applications

    13.3. Market Attractiveness Analysis

        13.3.1. By Country

        13.3.2. By Product Type

        13.3.3. By Applications

    13.4. Key Takeaways

14. MEA Market Analysis 2018 to 2022 and Forecast 2023 to 2033, By Country

    14.1. Historical Market Size Value (US$ Million) & Volume (MT) Trend Analysis By Market Taxonomy, 2018 to 2022

    14.2. Market Size Value (US$ Million) & Volume (MT) Forecast By Market Taxonomy, 2023 to 2033

        14.2.1. By Country

            14.2.1.1. GCC Countries

            14.2.1.2. South Africa

            14.2.1.3. Central Africa

            14.2.1.4. North Africa

        14.2.2. By Product Type

        14.2.3. By Applications

    14.3. Market Attractiveness Analysis

        14.3.1. By Country

        14.3.2. By Product Type

        14.3.3. By Applications

    14.4. Key Takeaways

15. Key Countries Market Analysis

    15.1. The US

        15.1.1. Pricing Analysis

        15.1.2. Market Share Analysis, 2023

            15.1.2.1. By Product Type

            15.1.2.2. By Applications

    15.2. Canada

        15.2.1. Pricing Analysis

        15.2.2. Market Share Analysis, 2023

            15.2.2.1. By Product Type

            15.2.2.2. By Applications

    15.3. Brazil

        15.3.1. Pricing Analysis

        15.3.2. Market Share Analysis, 2023

            15.3.2.1. By Product Type

            15.3.2.2. By Applications

    15.4. Mexico

        15.4.1. Pricing Analysis

        15.4.2. Market Share Analysis, 2023

            15.4.2.1. By Product Type

            15.4.2.2. By Applications

    15.5. Argentina

        15.5.1. Pricing Analysis

        15.5.2. Market Share Analysis, 2023

            15.5.2.1. By Product Type

            15.5.2.2. By Applications

    15.6. Chile

        15.6.1. Pricing Analysis

        15.6.2. Market Share Analysis, 2023

            15.6.2.1. By Product Type

            15.6.2.2. By Applications

    15.7. Peru

        15.7.1. Pricing Analysis

        15.7.2. Market Share Analysis, 2023

            15.7.2.1. By Product Type

            15.7.2.2. By Applications

    15.8. Germany

        15.8.1. Pricing Analysis

        15.8.2. Market Share Analysis, 2023

            15.8.2.1. By Product Type

            15.8.2.2. By Applications

    15.9. Italy

        15.9.1. Pricing Analysis

        15.9.2. Market Share Analysis, 2023

            15.9.2.1. By Product Type

            15.9.2.2. By Applications

    15.10. France

        15.10.1. Pricing Analysis

        15.10.2. Market Share Analysis, 2023

            15.10.2.1. By Product Type

            15.10.2.2. By Applications

    15.11. Spain

        15.11.1. Pricing Analysis

        15.11.2. Market Share Analysis, 2023

            15.11.2.1. By Product Type

            15.11.2.2. By Applications

    15.12. The UK

        15.12.1. Pricing Analysis

        15.12.2. Market Share Analysis, 2023

            15.12.2.1. By Product Type

            15.12.2.2. By Applications

    15.13. Russia

        15.13.1. Pricing Analysis

        15.13.2. Market Share Analysis, 2023

            15.13.2.1. By Product Type

            15.13.2.2. By Applications

    15.14. Poland

        15.14.1. Pricing Analysis

        15.14.2. Market Share Analysis, 2023

            15.14.2.1. By Product Type

            15.14.2.2. By Applications

    15.15. BENELUX

        15.15.1. Pricing Analysis

        15.15.2. Market Share Analysis, 2023

            15.15.2.1. By Product Type

            15.15.2.2. By Applications

    15.16. Nordic Countries

        15.16.1. Pricing Analysis

        15.16.2. Market Share Analysis, 2023

            15.16.2.1. By Product Type

            15.16.2.2. By Applications

    15.17. China

        15.17.1. Pricing Analysis

        15.17.2. Market Share Analysis, 2023

            15.17.2.1. By Product Type

            15.17.2.2. By Applications

    15.18. Japan

        15.18.1. Pricing Analysis

        15.18.2. Market Share Analysis, 2023

            15.18.2.1. By Product Type

            15.18.2.2. By Applications

    15.19. South Korea

        15.19.1. Pricing Analysis

        15.19.2. Market Share Analysis, 2023

            15.19.2.1. By Product Type

            15.19.2.2. By Applications

    15.20. India

        15.20.1. Pricing Analysis

        15.20.2. Market Share Analysis, 2023

            15.20.2.1. By Product Type

            15.20.2.2. By Applications

    15.21. Thailand

        15.21.1. Pricing Analysis

        15.21.2. Market Share Analysis, 2023

            15.21.2.1. By Product Type

            15.21.2.2. By Applications

    15.22. Indonesia

        15.22.1. Pricing Analysis

        15.22.2. Market Share Analysis, 2023

            15.22.2.1. By Product Type

            15.22.2.2. By Applications

    15.23. Malaysia

        15.23.1. Pricing Analysis

        15.23.2. Market Share Analysis, 2023

            15.23.2.1. By Product Type

            15.23.2.2. By Applications

    15.24. Singapore

        15.24.1. Pricing Analysis

        15.24.2. Market Share Analysis, 2023

            15.24.2.1. By Product Type

            15.24.2.2. By Applications

    15.25. GCC Countries

        15.25.1. Pricing Analysis

        15.25.2. Market Share Analysis, 2023

            15.25.2.1. By Product Type

            15.25.2.2. By Applications

    15.26. South Africa

        15.26.1. Pricing Analysis

        15.26.2. Market Share Analysis, 2023

            15.26.2.1. By Product Type

            15.26.2.2. By Applications

    15.27. Central Africa

        15.27.1. Pricing Analysis

        15.27.2. Market Share Analysis, 2023

            15.27.2.1. By Product Type

            15.27.2.2. By Applications

    15.28. North Africa

        15.28.1. Pricing Analysis

        15.28.2. Market Share Analysis, 2023

            15.28.2.1. By Product Type

            15.28.2.2. By Applications

16. Market Structure Analysis

    16.1. Competition Dashboard

    16.2. Competition Benchmarking

    16.3. Market Share Analysis of Top Players

        16.3.1. By Regional

        16.3.2. By Product Type

        16.3.3. By Applications

17. Competition Analysis

    17.1. Competition Deep Dive

        17.1.1. Ali S.p.A

            17.1.1.1. Overview

            17.1.1.2. Product Portfolio

            17.1.1.3. Profitability by Market Segments

            17.1.1.4. Sales Footprint

            17.1.1.5. Strategy Overview

                17.1.1.5.1. Marketing Strategy

                17.1.1.5.2. Product Strategy

                17.1.1.5.3. Channel Strategy

        17.1.2. Illinois Tool Works Inc.

            17.1.2.1. Overview

            17.1.2.2. Product Portfolio

            17.1.2.3. Profitability by Market Segments

            17.1.2.4. Sales Footprint

            17.1.2.5. Strategy Overview

                17.1.2.5.1. Marketing Strategy

                17.1.2.5.2. Product Strategy

                17.1.2.5.3. Channel Strategy

        17.1.3. Duke Manufacturing Co. Inc.

            17.1.3.1. Overview

            17.1.3.2. Product Portfolio

            17.1.3.3. Profitability by Market Segments

            17.1.3.4. Sales Footprint

            17.1.3.5. Strategy Overview

                17.1.3.5.1. Marketing Strategy

                17.1.3.5.2. Product Strategy

                17.1.3.5.3. Channel Strategy

        17.1.4. The Middleby Corporation

            17.1.4.1. Overview

            17.1.4.2. Product Portfolio

            17.1.4.3. Profitability by Market Segments

            17.1.4.4. Sales Footprint

            17.1.4.5. Strategy Overview

                17.1.4.5.1. Marketing Strategy

                17.1.4.5.2. Product Strategy

                17.1.4.5.3. Channel Strategy

        17.1.5. Alto-Shaam, Inc.

            17.1.5.1. Overview

            17.1.5.2. Product Portfolio

            17.1.5.3. Profitability by Market Segments

            17.1.5.4. Sales Footprint

            17.1.5.5. Strategy Overview

                17.1.5.5.1. Marketing Strategy

                17.1.5.5.2. Product Strategy

                17.1.5.5.3. Channel Strategy

        17.1.6. Edward Don & Company

            17.1.6.1. Overview

            17.1.6.2. Product Portfolio

            17.1.6.3. Profitability by Market Segments

            17.1.6.4. Sales Footprint

            17.1.6.5. Strategy Overview

                17.1.6.5.1. Marketing Strategy

                17.1.6.5.2. Product Strategy

                17.1.6.5.3. Channel Strategy

        17.1.7. Fujimak Corporation

            17.1.7.1. Overview

            17.1.7.2. Product Portfolio

            17.1.7.3. Profitability by Market Segments

            17.1.7.4. Sales Footprint

            17.1.7.5. Strategy Overview

                17.1.7.5.1. Marketing Strategy

                17.1.7.5.2. Product Strategy

                17.1.7.5.3. Channel Strategy

        17.1.8. Manitowac Company Inc.

            17.1.8.1. Overview

            17.1.8.2. Product Portfolio

            17.1.8.3. Profitability by Market Segments

            17.1.8.4. Sales Footprint

            17.1.8.5. Strategy Overview

                17.1.8.5.1. Marketing Strategy

                17.1.8.5.2. Product Strategy

                17.1.8.5.3. Channel Strategy

        17.1.9. Rational AG and AB Electrolux.

            17.1.9.1. Overview

            17.1.9.2. Product Portfolio

            17.1.9.3. Profitability by Market Segments

            17.1.9.4. Sales Footprint

            17.1.9.5. Strategy Overview

                17.1.9.5.1. Marketing Strategy

                17.1.9.5.2. Product Strategy

                17.1.9.5.3. Channel Strategy

        17.1.10. ACP, Inc.

            17.1.10.1. Overview

            17.1.10.2. Product Portfolio

            17.1.10.3. Profitability by Market Segments

            17.1.10.4. Sales Footprint

            17.1.10.5. Strategy Overview

                17.1.10.5.1. Marketing Strategy

                17.1.10.5.2. Product Strategy

                17.1.10.5.3. Channel Strategy

        17.1.11. AMTek Microwaves

            17.1.11.1. Overview

            17.1.11.2. Product Portfolio

            17.1.11.3. Profitability by Market Segments

            17.1.11.4. Sales Footprint

            17.1.11.5. Strategy Overview

                17.1.11.5.1. Marketing Strategy

                17.1.11.5.2. Product Strategy

                17.1.11.5.3. Channel Strategy

        17.1.12. Bizerba USA Inc.

            17.1.12.1. Overview

            17.1.12.2. Product Portfolio

            17.1.12.3. Profitability by Market Segments

            17.1.12.4. Sales Footprint

            17.1.12.5. Strategy Overview

                17.1.12.5.1. Marketing Strategy

                17.1.12.5.2. Product Strategy

                17.1.12.5.3. Channel Strategy

        17.1.13. Caddy Corporation

            17.1.13.1. Overview

            17.1.13.2. Product Portfolio

            17.1.13.3. Profitability by Market Segments

            17.1.13.4. Sales Footprint

            17.1.13.5. Strategy Overview

                17.1.13.5.1. Marketing Strategy

                17.1.13.5.2. Product Strategy

                17.1.13.5.3. Channel Strategy

        17.1.14. Others (on demand)

18. Assumptions & Acronyms Used

19. Research Methodology

Don't pay for what you don't need

Customize your report by selecting specific countries or regions and save 30%!

List of Tables

Table 1: Global Market Value (US$ Million) Forecast by Region, 2018 to 2033

Table 2: Global Market Volume (MT) Forecast by Region, 2018 to 2033

Table 3: Global Market Value (US$ Million) Forecast By Product Type, 2018 to 2033

Table 4: Global Market Volume (MT) Forecast By Product Type, 2018 to 2033

Table 5: Global Market Value (US$ Million) Forecast By Applications, 2018 to 2033

Table 6: Global Market Volume (MT) Forecast By Applications, 2018 to 2033

Table 7: North America Market Value (US$ Million) Forecast by Country, 2018 to 2033

Table 8: North America Market Volume (MT) Forecast by Country, 2018 to 2033

Table 9: North America Market Value (US$ Million) Forecast By Product Type, 2018 to 2033

Table 10: North America Market Volume (MT) Forecast By Product Type, 2018 to 2033

Table 11: North America Market Value (US$ Million) Forecast By Applications, 2018 to 2033

Table 12: North America Market Volume (MT) Forecast By Applications, 2018 to 2033

Table 13: Latin America Market Value (US$ Million) Forecast by Country, 2018 to 2033

Table 14: Latin America Market Volume (MT) Forecast by Country, 2018 to 2033

Table 15: Latin America Market Value (US$ Million) Forecast By Product Type, 2018 to 2033

Table 16: Latin America Market Volume (MT) Forecast By Product Type, 2018 to 2033

Table 17: Latin America Market Value (US$ Million) Forecast By Applications, 2018 to 2033

Table 18: Latin America Market Volume (MT) Forecast By Applications, 2018 to 2033

Table 19: Europe Market Value (US$ Million) Forecast by Country, 2018 to 2033

Table 20: Europe Market Volume (MT) Forecast by Country, 2018 to 2033

Table 21: Europe Market Value (US$ Million) Forecast By Product Type, 2018 to 2033

Table 22: Europe Market Volume (MT) Forecast By Product Type, 2018 to 2033

Table 23: Europe Market Value (US$ Million) Forecast By Applications, 2018 to 2033

Table 24: Europe Market Volume (MT) Forecast By Applications, 2018 to 2033

Table 25: East Asia Market Value (US$ Million) Forecast by Country, 2018 to 2033

Table 26: East Asia Market Volume (MT) Forecast by Country, 2018 to 2033

Table 27: East Asia Market Value (US$ Million) Forecast By Product Type, 2018 to 2033

Table 28: East Asia Market Volume (MT) Forecast By Product Type, 2018 to 2033

Table 29: East Asia Market Value (US$ Million) Forecast By Applications, 2018 to 2033

Table 30: East Asia Market Volume (MT) Forecast By Applications, 2018 to 2033

Table 31: South Asia Market Value (US$ Million) Forecast by Country, 2018 to 2033

Table 32: South Asia Market Volume (MT) Forecast by Country, 2018 to 2033

Table 33: South Asia Market Value (US$ Million) Forecast By Product Type, 2018 to 2033

Table 34: South Asia Market Volume (MT) Forecast By Product Type, 2018 to 2033

Table 35: South Asia Market Value (US$ Million) Forecast By Applications, 2018 to 2033

Table 36: South Asia Market Volume (MT) Forecast By Applications, 2018 to 2033

Table 37: Oceania Market Value (US$ Million) Forecast by Country, 2018 to 2033

Table 38: Oceania Market Volume (MT) Forecast by Country, 2018 to 2033

Table 39: Oceania Market Value (US$ Million) Forecast By Product Type, 2018 to 2033

Table 40: Oceania Market Volume (MT) Forecast By Product Type, 2018 to 2033

Table 41: Oceania Market Value (US$ Million) Forecast By Applications, 2018 to 2033

Table 42: Oceania Market Volume (MT) Forecast By Applications, 2018 to 2033

Table 43: MEA Market Value (US$ Million) Forecast by Country, 2018 to 2033

Table 44: MEA Market Volume (MT) Forecast by Country, 2018 to 2033

Table 45: MEA Market Value (US$ Million) Forecast By Product Type, 2018 to 2033

Table 46: MEA Market Volume (MT) Forecast By Product Type, 2018 to 2033

Table 47: MEA Market Value (US$ Million) Forecast By Applications, 2018 to 2033

Table 48: MEA Market Volume (MT) Forecast By Applications, 2018 to 2033
Nandini Roy Choudhury

Principal Consultant

Talk to Analyst

Find your sweet spots for generating winning opportunities in this market.

List of Charts

Figure 1: Global Market Value (US$ Million) By Product Type, 2023 to 2033

Figure 2: Global Market Value (US$ Million) By Applications, 2023 to 2033

Figure 3: Global Market Value (US$ Million) by Region, 2023 to 2033

Figure 4: Global Market Value (US$ Million) Analysis by Region, 2018 to 2033

Figure 5: Global Market Volume (MT) Analysis by Region, 2018 to 2033

Figure 6: Global Market Value Share (%) and BPS Analysis by Region, 2023 to 2033

Figure 7: Global Market Y-o-Y Growth (%) Projections by Region, 2023 to 2033

Figure 8: Global Market Value (US$ Million) Analysis By Product Type, 2018 to 2033

Figure 9: Global Market Volume (MT) Analysis By Product Type, 2018 to 2033

Figure 10: Global Market Value Share (%) and BPS Analysis By Product Type, 2023 to 2033

Figure 11: Global Market Y-o-Y Growth (%) Projections By Product Type, 2023 to 2033

Figure 12: Global Market Value (US$ Million) Analysis By Applications, 2018 to 2033

Figure 13: Global Market Volume (MT) Analysis By Applications, 2018 to 2033

Figure 14: Global Market Value Share (%) and BPS Analysis By Applications, 2023 to 2033

Figure 15: Global Market Y-o-Y Growth (%) Projections By Applications, 2023 to 2033

Figure 16: Global Market Attractiveness By Product Type, 2023 to 2033

Figure 17: Global Market Attractiveness By Applications, 2023 to 2033

Figure 18: Global Market Attractiveness by Region, 2023 to 2033

Figure 19: North America Market Value (US$ Million) By Product Type, 2023 to 2033

Figure 20: North America Market Value (US$ Million) By Applications, 2023 to 2033

Figure 21: North America Market Value (US$ Million) by Country, 2023 to 2033

Figure 22: North America Market Value (US$ Million) Analysis by Country, 2018 to 2033

Figure 23: North America Market Volume (MT) Analysis by Country, 2018 to 2033

Figure 24: North America Market Value Share (%) and BPS Analysis by Country, 2023 to 2033

Figure 25: North America Market Y-o-Y Growth (%) Projections by Country, 2023 to 2033

Figure 26: North America Market Value (US$ Million) Analysis By Product Type, 2018 to 2033

Figure 27: North America Market Volume (MT) Analysis By Product Type, 2018 to 2033

Figure 28: North America Market Value Share (%) and BPS Analysis By Product Type, 2023 to 2033

Figure 29: North America Market Y-o-Y Growth (%) Projections By Product Type, 2023 to 2033

Figure 30: North America Market Value (US$ Million) Analysis By Applications, 2018 to 2033

Figure 31: North America Market Volume (MT) Analysis By Applications, 2018 to 2033

Figure 32: North America Market Value Share (%) and BPS Analysis By Applications, 2023 to 2033

Figure 33: North America Market Y-o-Y Growth (%) Projections By Applications, 2023 to 2033

Figure 34: North America Market Attractiveness By Product Type, 2023 to 2033

Figure 35: North America Market Attractiveness By Applications, 2023 to 2033

Figure 36: North America Market Attractiveness by Country, 2023 to 2033

Figure 37: Latin America Market Value (US$ Million) By Product Type, 2023 to 2033

Figure 38: Latin America Market Value (US$ Million) By Applications, 2023 to 2033

Figure 39: Latin America Market Value (US$ Million) by Country, 2023 to 2033

Figure 40: Latin America Market Value (US$ Million) Analysis by Country, 2018 to 2033

Figure 41: Latin America Market Volume (MT) Analysis by Country, 2018 to 2033

Figure 42: Latin America Market Value Share (%) and BPS Analysis by Country, 2023 to 2033

Figure 43: Latin America Market Y-o-Y Growth (%) Projections by Country, 2023 to 2033

Figure 44: Latin America Market Value (US$ Million) Analysis By Product Type, 2018 to 2033

Figure 45: Latin America Market Volume (MT) Analysis By Product Type, 2018 to 2033

Figure 46: Latin America Market Value Share (%) and BPS Analysis By Product Type, 2023 to 2033

Figure 47: Latin America Market Y-o-Y Growth (%) Projections By Product Type, 2023 to 2033

Figure 48: Latin America Market Value (US$ Million) Analysis By Applications, 2018 to 2033

Figure 49: Latin America Market Volume (MT) Analysis By Applications, 2018 to 2033

Figure 50: Latin America Market Value Share (%) and BPS Analysis By Applications, 2023 to 2033

Figure 51: Latin America Market Y-o-Y Growth (%) Projections By Applications, 2023 to 2033

Figure 52: Latin America Market Attractiveness By Product Type, 2023 to 2033

Figure 53: Latin America Market Attractiveness By Applications, 2023 to 2033

Figure 54: Latin America Market Attractiveness by Country, 2023 to 2033

Figure 55: Europe Market Value (US$ Million) By Product Type, 2023 to 2033

Figure 56: Europe Market Value (US$ Million) By Applications, 2023 to 2033

Figure 57: Europe Market Value (US$ Million) by Country, 2023 to 2033

Figure 58: Europe Market Value (US$ Million) Analysis by Country, 2018 to 2033

Figure 59: Europe Market Volume (MT) Analysis by Country, 2018 to 2033

Figure 60: Europe Market Value Share (%) and BPS Analysis by Country, 2023 to 2033

Figure 61: Europe Market Y-o-Y Growth (%) Projections by Country, 2023 to 2033

Figure 62: Europe Market Value (US$ Million) Analysis By Product Type, 2018 to 2033

Figure 63: Europe Market Volume (MT) Analysis By Product Type, 2018 to 2033

Figure 64: Europe Market Value Share (%) and BPS Analysis By Product Type, 2023 to 2033

Figure 65: Europe Market Y-o-Y Growth (%) Projections By Product Type, 2023 to 2033

Figure 66: Europe Market Value (US$ Million) Analysis By Applications, 2018 to 2033

Figure 67: Europe Market Volume (MT) Analysis By Applications, 2018 to 2033

Figure 68: Europe Market Value Share (%) and BPS Analysis By Applications, 2023 to 2033

Figure 69: Europe Market Y-o-Y Growth (%) Projections By Applications, 2023 to 2033

Figure 70: Europe Market Attractiveness By Product Type, 2023 to 2033

Figure 71: Europe Market Attractiveness By Applications, 2023 to 2033

Figure 72: Europe Market Attractiveness by Country, 2023 to 2033

Figure 73: East Asia Market Value (US$ Million) By Product Type, 2023 to 2033

Figure 74: East Asia Market Value (US$ Million) By Applications, 2023 to 2033

Figure 75: East Asia Market Value (US$ Million) by Country, 2023 to 2033

Figure 76: East Asia Market Value (US$ Million) Analysis by Country, 2018 to 2033

Figure 77: East Asia Market Volume (MT) Analysis by Country, 2018 to 2033

Figure 78: East Asia Market Value Share (%) and BPS Analysis by Country, 2023 to 2033

Figure 79: East Asia Market Y-o-Y Growth (%) Projections by Country, 2023 to 2033

Figure 80: East Asia Market Value (US$ Million) Analysis By Product Type, 2018 to 2033

Figure 81: East Asia Market Volume (MT) Analysis By Product Type, 2018 to 2033

Figure 82: East Asia Market Value Share (%) and BPS Analysis By Product Type, 2023 to 2033

Figure 83: East Asia Market Y-o-Y Growth (%) Projections By Product Type, 2023 to 2033

Figure 84: East Asia Market Value (US$ Million) Analysis By Applications, 2018 to 2033

Figure 85: East Asia Market Volume (MT) Analysis By Applications, 2018 to 2033

Figure 86: East Asia Market Value Share (%) and BPS Analysis By Applications, 2023 to 2033

Figure 87: East Asia Market Y-o-Y Growth (%) Projections By Applications, 2023 to 2033

Figure 88: East Asia Market Attractiveness By Product Type, 2023 to 2033

Figure 89: East Asia Market Attractiveness By Applications, 2023 to 2033

Figure 90: East Asia Market Attractiveness by Country, 2023 to 2033

Figure 91: South Asia Market Value (US$ Million) By Product Type, 2023 to 2033

Figure 92: South Asia Market Value (US$ Million) By Applications, 2023 to 2033

Figure 93: South Asia Market Value (US$ Million) by Country, 2023 to 2033

Figure 94: South Asia Market Value (US$ Million) Analysis by Country, 2018 to 2033

Figure 95: South Asia Market Volume (MT) Analysis by Country, 2018 to 2033

Figure 96: South Asia Market Value Share (%) and BPS Analysis by Country, 2023 to 2033

Figure 97: South Asia Market Y-o-Y Growth (%) Projections by Country, 2023 to 2033

Figure 98: South Asia Market Value (US$ Million) Analysis By Product Type, 2018 to 2033

Figure 99: South Asia Market Volume (MT) Analysis By Product Type, 2018 to 2033

Figure 100: South Asia Market Value Share (%) and BPS Analysis By Product Type, 2023 to 2033

Figure 101: South Asia Market Y-o-Y Growth (%) Projections By Product Type, 2023 to 2033

Figure 102: South Asia Market Value (US$ Million) Analysis By Applications, 2018 to 2033

Figure 103: South Asia Market Volume (MT) Analysis By Applications, 2018 to 2033

Figure 104: South Asia Market Value Share (%) and BPS Analysis By Applications, 2023 to 2033

Figure 105: South Asia Market Y-o-Y Growth (%) Projections By Applications, 2023 to 2033

Figure 106: South Asia Market Attractiveness By Product Type, 2023 to 2033

Figure 107: South Asia Market Attractiveness By Applications, 2023 to 2033

Figure 108: South Asia Market Attractiveness by Country, 2023 to 2033

Figure 109: Oceania Market Value (US$ Million) By Product Type, 2023 to 2033

Figure 110: Oceania Market Value (US$ Million) By Applications, 2023 to 2033

Figure 111: Oceania Market Value (US$ Million) by Country, 2023 to 2033

Figure 112: Oceania Market Value (US$ Million) Analysis by Country, 2018 to 2033

Figure 113: Oceania Market Volume (MT) Analysis by Country, 2018 to 2033

Figure 114: Oceania Market Value Share (%) and BPS Analysis by Country, 2023 to 2033

Figure 115: Oceania Market Y-o-Y Growth (%) Projections by Country, 2023 to 2033

Figure 116: Oceania Market Value (US$ Million) Analysis By Product Type, 2018 to 2033

Figure 117: Oceania Market Volume (MT) Analysis By Product Type, 2018 to 2033

Figure 118: Oceania Market Value Share (%) and BPS Analysis By Product Type, 2023 to 2033

Figure 119: Oceania Market Y-o-Y Growth (%) Projections By Product Type, 2023 to 2033

Figure 120: Oceania Market Value (US$ Million) Analysis By Applications, 2018 to 2033

Figure 121: Oceania Market Volume (MT) Analysis By Applications, 2018 to 2033

Figure 122: Oceania Market Value Share (%) and BPS Analysis By Applications, 2023 to 2033

Figure 123: Oceania Market Y-o-Y Growth (%) Projections By Applications, 2023 to 2033

Figure 124: Oceania Market Attractiveness By Product Type, 2023 to 2033

Figure 125: Oceania Market Attractiveness By Applications, 2023 to 2033

Figure 126: Oceania Market Attractiveness by Country, 2023 to 2033

Figure 127: MEA Market Value (US$ Million) By Product Type, 2023 to 2033

Figure 128: MEA Market Value (US$ Million) By Applications, 2023 to 2033

Figure 129: MEA Market Value (US$ Million) by Country, 2023 to 2033

Figure 130: MEA Market Value (US$ Million) Analysis by Country, 2018 to 2033

Figure 131: MEA Market Volume (MT) Analysis by Country, 2018 to 2033

Figure 132: MEA Market Value Share (%) and BPS Analysis by Country, 2023 to 2033

Figure 133: MEA Market Y-o-Y Growth (%) Projections by Country, 2023 to 2033

Figure 134: MEA Market Value (US$ Million) Analysis By Product Type, 2018 to 2033

Figure 135: MEA Market Volume (MT) Analysis By Product Type, 2018 to 2033

Figure 136: MEA Market Value Share (%) and BPS Analysis By Product Type, 2023 to 2033

Figure 137: MEA Market Y-o-Y Growth (%) Projections By Product Type, 2023 to 2033

Figure 138: MEA Market Value (US$ Million) Analysis By Applications, 2018 to 2033

Figure 139: MEA Market Volume (MT) Analysis By Applications, 2018 to 2033

Figure 140: MEA Market Value Share (%) and BPS Analysis By Applications, 2023 to 2033

Figure 141: MEA Market Y-o-Y Growth (%) Projections By Applications, 2023 to 2033

Figure 142: MEA Market Attractiveness By Product Type, 2023 to 2033

Figure 143: MEA Market Attractiveness By Applications, 2023 to 2033

Figure 144: MEA Market Attractiveness by Country, 2023 to 2033

Explore Process Automation Insights

View Reports

Commercial Cooking Equipment Market