Reports

- Global Locations -

Headquarters

Future Market Insights, Inc.

Christiana Corporate, 200
Continental Drive, Suite 401,
Newark, Delaware - 19713,
United States

T: +1-845-579-5705

Americas

Future Market Insights, Inc.

616 Corporate Way, Suite 2-9018,
Valley Cottage, NY 10989, United States

T: +1-347-918-3531

MEA

Future Market Insights

1602-6 Jumeirah Bay X2 Tower, Plot No: JLT-PH2-X2A,
Jumeirah Lakes Towers, Dubai,
United Arab Emirates

Europe

Future Market Insights

3rd Floor, 207 Regent Street,
W1B 3HH London
United Kingdom

T: + 44 (0) 20 8123 9659
D: +44 (0) 20 3287 4268

Asia Pacific

Future Market Insights

IndiaLand Global Tech Park, Unit UG-1, Behind Grand HighStreet, Phase 1, Hinjawadi, MH, Pune – 411057, India

Commercial Cookers Market Outlook (2023 to 2033)

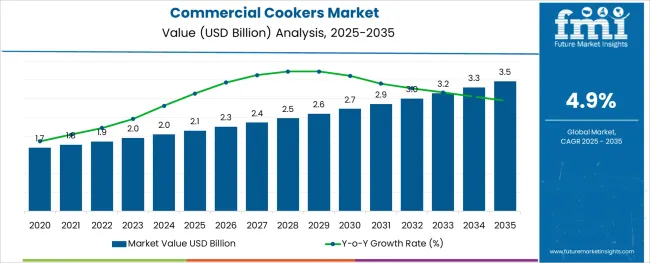
The commercial cookers market is projected to have a CAGR of 4.9% by 2033. According to FMI, the market is expected to expand from US$ 1,953.0 million in 2023 to US$ 3,151.1 million by 2033. In 2022, the market had a value of US$ 1,872.5 million due to a lower demand rate of 1.4% over the years 2018 to 2022.

The development of the hospitality industry majorly drives the demand for commercial cookers. Moreover, the growing demand for multi-functional, efficient, space & time-saving commercial cookers is further contributing to the global market growth.

The commercial cooker market trends to look out for are those that aim to minimize kitchen space, energy use, food waste, and labor. These fads develop in tandem with those in food and drink, and in response to the ever-evolving expectations and needs of consumers. However, more advanced technologies undoubtedly continue to alter commercial kitchens and their cooking apparatus.

Commercial cookers are frequently used in catering, full-service restaurants, and quick-service restaurants to prepare and preserve various types of food. More business travelers and new hotels and restaurants are the main drivers of the commercial cookers market expansion.

Also, more people are eating out, which has made the food service industry grow, which has increased the adoption of commercial cookers. During the forecast period, the market is also expected to grow due to an increase in cross-border investments, more experiments and new ideas in a wide range of cuisines, and the fast growth of the travel and tourism industry.

Additionally, the popularity of modular kitchens with advanced amenities is growing, which raises the sales of commercial cookers. The popularity of commercial cookers is anticipated to expand as a result of rising demand for custom units, cloud kitchens, and energy- and cost-efficient goods.

  • The target demographic is primarily attracted to Cloud Kitchen's fast food due to its flavor, distinctive product options, and ease of accessibility.
  • The cloud kitchen trend has also been spurred by the surge in demand for online food delivery, which is due to customers' fast-paced lifestyles and their desire for convenient food options.
  • The adoption of cloud kitchens in the food service sector has also been greatly aided by the expansion of the internet and the growing power of social media. Due to all of these elements, the commercial cookers market is anticipated to experience profitable growth throughout the forecast period.
Attributes Details
Commercial Cookers Market CAGR (2023 to 2033) 4.9%
Commercial Cookers Market Size (2023) US$ 1,953 million
Commercial Cookers Market Size (2033) US$ 3,151.1 million

Don't pay for what you don't need

Customize your report by selecting specific countries or regions and save 30%!

Fast Track Growth of Commercial Cooker Market: from 2018 to 2022 to 2023 to 2033

The global commercial cookers market was expanding at a 1.4% CAGR from 2018 to 2022. According to FMI, by 2033, demand for commercial cookers would rise by 4.9%. Initially, the market size was US$ 1,771.2 million in 2018.

The commercial cooker sector is changing due to advancements in automation, cutting-edge appliances, and digital sensors, much like any other sector of the economy. The goal of all these technologies is to simplify and streamline cooking.

As a result, the market size is worth US$ 1,872.3 million in 2022. Additionally, there has been a significant change in buying habits. If financing choices are accessible and inexpensive, more and more restaurant owners are more likely to make an investment in a modern kitchen, which in turn raises the demand for commercial cookers.

In the instance of manufacturers of refrigeration, the leasing system has been observed to be profitable. Because of this, other producers of culinary equipment are now taking the same approach to reach more consumers, regardless of their scale or financial situation, and commercial cookers are no exception.

Brief Outlook of Growth Drivers Impacting Commercial Cookers Market

The surge in Demand for Cost-effective Products

About 20% less energy is used by commercial cookers than by conventional ones. As a result, energy- and money-saving industrial cooking equipment is becoming more and more well-liked in the food service sector.

In consequence, this is anticipated to create a significant window of opportunity for the commercial cooker industry to expand over the coming years.

Digital Transformation

End-use sectors are now selecting commercial cookers that have built-in digital transformation technologies, such as the Internet of Things (IoT) and Artificial Intelligence (AI), which are assisting them in continuously providing services to their clients.

Safety Hazards

Consumers are generally discouraged from purchasing pressure cookers as a result of many incidents of crockery product explosion brought on by companies' subpar product offers, which restrains market expansion.

For instance, six American consumers sued Instant Brands Inc., a major producer of multipurpose crockery items in the USA, between March 2018 and April 2021 as a result of several explosion incidents with Instant Pot cookers.

In addition, the demand for multipurpose crockery is being constrained by its greater price among middle-class and lower-income individuals. Additionally, fierce competition from local industry competitors and their aggressive pricing are impeding commercial cookers market expansion.

Nandini Roy Choudhury

Principal Consultant

Talk to Analyst

Find your sweet spots for generating winning opportunities in this market.

Comparative View of Adjacent Commercial Cookers Market

Commercial Cookers Market:

Attributes Commercial Cookers Market
CAGR (2023 to 2033) 4.9%
Market Value (2033) US$ 3,151.1 million
Growth Factor The commercial cooker business is experiencing a growth spurt as a result of evolving consumer demands and advances in technology.
Opportunity The market has grown as a result of the introduction of new technologies, including automated purchase tools and virtual reality onboarding.
Key Trends Growth in the need for affordable, energy-efficient products, as well as a surge in the popularity of cloud kitchens, are opening up new market opportunities.

Commercial Oven Market:

Attributes Commercial Oven Market
CAGR (2023 to 2033) 4.5%
Market Value (2033) US$ 16182.2 million
Growth Factor Due to client demand and the popularity of display baking, businesses are producing a variety of commercial ovens.
Opportunity With the installation of commercial ovens, the simplicity of food manufacturing can aid in boosting productivity, which in turn boosts the end-users economies.
Key Trends Commercial conveyor oven demand is being influenced by the expansion of pizzerias and other eateries that demand high throughput and product uniformity.

Commercial Equipment Market:

Attributes Commercial Equipment Market
CAGR (2023 to 2033) 5.5%
Market Value (2033) US$ 22,460 million
Growth Factor Demand is high for novel culinary concepts, and the expansion of the travel and tourism sector leads to higher demand for commercial equipment.
Opportunity Food service equipment market demand in commercial kitchens has been driven by the growth of the hospitality sector and an increase in the use of temperature-controlled storage equipment for perishable and processed food items.
Key Trends As a new development in the market, more international investments and new trials are on the way.

Category-wise Outlook

Which Commercial Cooker Type Has the Highest Market Share?

Gas cookers can be more advantageous for baking bread or pies since the crusts are less prone to dry out because they have a tendency to be slightly more humid. Reducing the operating costs of gas cookers purely due to the lower cost of electricity compared to gas.

However, short-term savings on an electric stove might not be worthwhile in the long run,

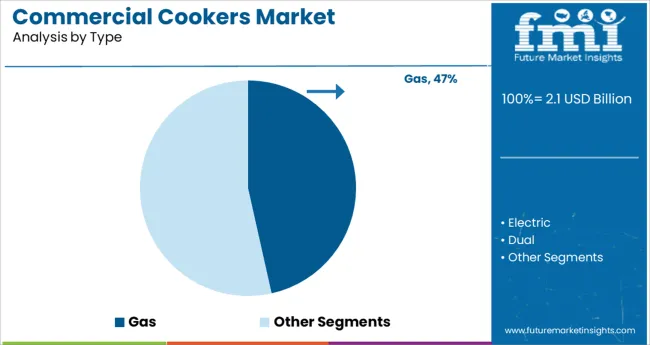
This is why gas commercial cookers are preferred by consumers and are expected to dominate the market with a share of 68.4%.

Which Segments Dominate the Commercial Cookers Market, based on End Use?

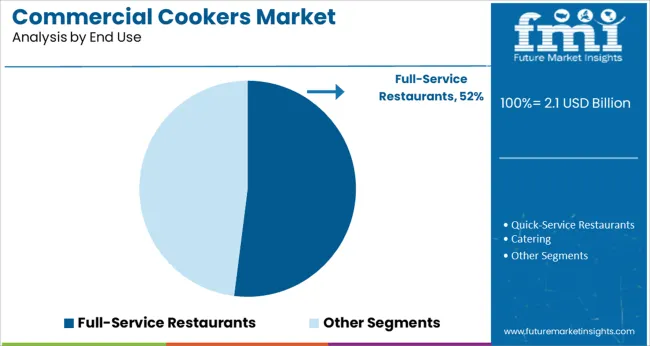
Full-service restaurants are expected to lead the commercial cookers market with a share of 43.8% by 2033.

These full-service restaurants provide a wide selection of foods and beverages, in addition to other services like lodging and upscale facilities. Rich locals and rich tourists like dining at exclusive establishments.

When customers desire to experience new dishes at a fair price, full-service restaurants are more inclined to adopt innovative technologies to manufacture quick-serve foods. The market share expands as a result of people having more discretionary income to spend on luxuries and take their families out to restaurants.
Get the data you need at a Fraction of the cost

Personalize your report by choosing insights you need
and save 40%!

Regional Analysis

Preference for Smart Appliances Create New Prospects for US Commercial Cookers Market

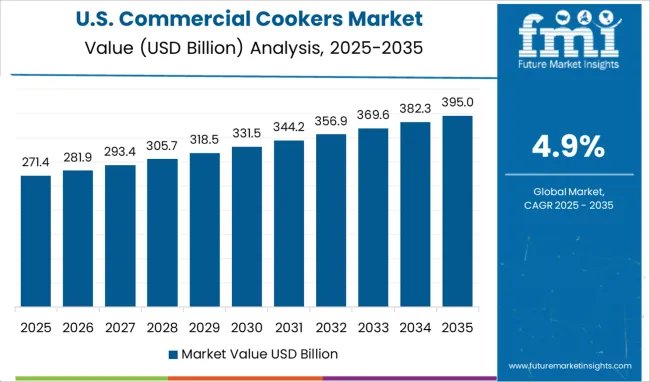
The US commercial cookers market is anticipated to have the largest market share of 28.5% by 2033.

The largest market for commercial cookers is the hotel sector in North America. This is due to the fact that the US consumes faster food than people in other regions of the world, and frequently purchases innovative items like smart deep fryers and cookers. The demand for commercial cookers in the area has expanded significantly due to the increase in restaurants and outside dining options.

The increased demand for electric pressure crockery items from customers in the USA and Canada caused the North American market to expand more quickly. More than 300,000 electric quick crockery pots were purchased through the American Amazon portal in July 2019 by Instant Brands Inc.

The continued popularity of baking and cooking among Americans and Canadians helps to sustain the region's high rate of product consumption.
How Europe is Performing in the Commercial Cookers Market?

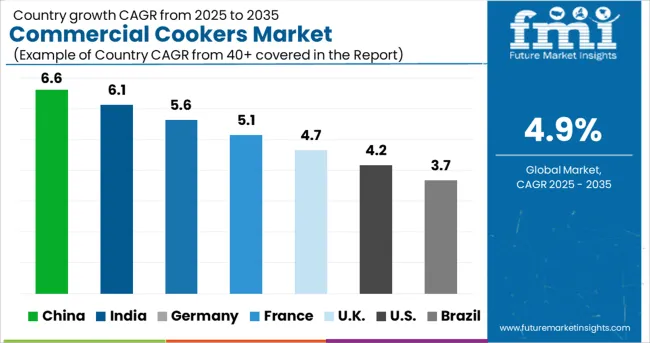
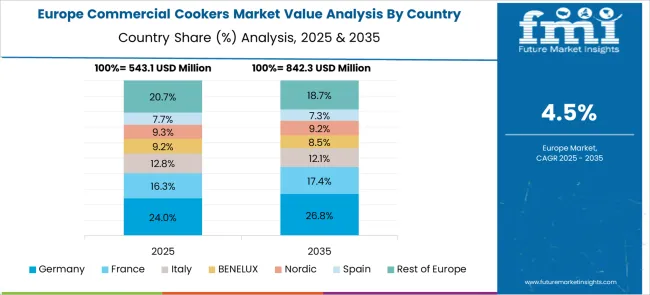
The commercial cookers market in Europe is found in the UK, Germany, France, Italy, and Spain. The expansion of the food service sector has contributed to the expansion of the European commercial cookers market. As it is affordable, widely available, and used in more locations, the UK is expected to have a CAGR of 3.9% by 2033.

A small-scale electric pressure crockery trial was started by Clasp. ngo, a UK-based producer of sustainable energy solutions, in June 2020 to encourage and increase demand for sustainably built appliances among Tanzania's rural population. These initiatives hasten market expansion across the Middle East and Africa.

Asia Pacific Commercial Cookers Market: Rising Quick Service Restaurants Expand the Overall Share

The Asia Pacific region's quick-service restaurant market is predicted to expand significantly over the coming years, as numerous foreign chains and local firms expand their operations there. Foreign QSR chains are increasingly attempting to cater to local tastes. Similar to this, Indian restaurants are adding multi-cuisine food preparations to their menus, including Italian, Mexican, and Continental dishes, and are expected to develop at a 7.7% CAGR.

This is as more and more consumers are trying new foods and acquiring a taste for various cuisines. Due to the enormous consumption of kitchen appliances for daily culinary needs among the Chinese and Indian populations, the region holds an adequate position in the global market.

Retail sales of home appliances in China totaled USD 12,732.6 million from January 2020 to August 2020, according to survey data provided by the China Household Electrical Appliances Association (CHEAA). This makes China expand at a CAGR of 6.4% by 2033.

Competitive Landscape

Manufacturers aim to produce cutting-edge products with lower prices to keep up with their company’s profit and market trends as well

A small number of sensors could significantly reduce the amount of time and energy used by conventional cooking apparatus. IoT-based culinary equipment offers astoundingly numerous options and advantages. Chefs can keep an eye on the meal from a distance, saving time, fuel, and electricity.

Additionally, restaurants may reduce food waste significantly with such commercial cookers. Chefs are therefore more likely to choose cooking tools that provide the greatest degree of versatility. Additionally, the increased focus on sustainability and electricity costs has made flexibility more significant than ever.

For instance, Instant Brands Inc. offered the Instant Pot Duo 7 in 1 electric pressure cooker on the American Amazon website in August 2021 for a promotional price of USD 69.95 or less. The item also functions as a yogurt maker.

Although these advances are on the market, the most difficult part is the price of such cutting-edge cooking equipment. But in order to boost the usage of cutting-edge cooking equipment, manufacturers of commercial cookers have worked hard to address this issue by creating new financing plans, interest-free deals, and leasing options.

As a result, commercial cooker manufacturers have spent a lot of money launching goods that no one even knew they needed. Development of commercial cookers in 2022.

  • To gain market share in the Pacific region, Alto Shaam Inc. established its business activities in Australia and New Zealand in February 2022.
  • Illinois Tool Works Inc. finished acquiring the MTS Test and Simulation Business in January 2022.
  • Malema Engineering Corporation, a producer of Flow-Measurement Devices for Bio-Pharma and semiconductor production applications, was bought by Dover Corporation in May 2022.

How Competitors are Coping Up with New Commercial Cookers Market Trends?

Commercial cooker producers are concentrating on strategic alliances and mergers & acquisitions to outperform their rivals and increase their reach among end users.

  • For instance, PartsXpress, the provider of food service and commercial appliance components for Smart Care Equipment Solutions, was acquired by Parts Town, a USA-based distributor of commercial food service equipment.
    • With this acquisition, Components Town took over as Smart Care Equipment Solutions' main source for genuine OEM parts.
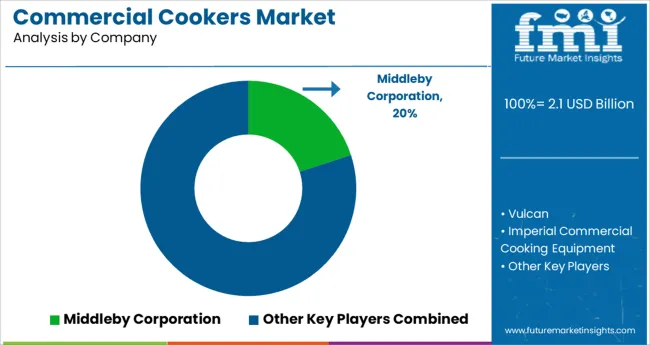
  • Imperial, based in Corona, California, provides a broad array of commercial cooking equipment that is used in a variety of food service settings and locations all over the world. In 2021, Imperial became a member of The Middleby Corporation, bringing with it a family of more than 100 renowned commercial kitchen brands.

Key Players

  • Vulcan
  • Imperial Commercial Cooking Equipment
  • Ralph Jacobsberg and Company
  • B+S Commercial Kitchens
  • Ali Group
  • Atosa USA Inc.
  • Comstock- Castle Stove Co.
  • Electroflux
  • Duke Manufacturing Co.
  • Illinois Tool Works Inc
  • Middleby Corporation
  • Comstock Castle Stove Co
  • Fagor Professional
  • Nisbets
  • Anvil World
  • AMtek
  • Henny Penny

Key Segments

By Type:

  • Gas
  • Dual
  • Electric

By Burner:

  • 2 Burner
  • 3 Burner
  • 4 Burner
  • 5 Burner
  • 6 Burner

By End Use:

  • Full-service Restaurant
  • Quick-service Restaurant
  • Catering

By Region:

  • North America
  • Latin America
  • Europe
  • East Asia
  • South Asia and the Pacific
  • Middle East & Africa

Frequently Asked Questions

What is the Growth Outlook of the Commercial Cookers Market?

The commercial cookers market is estimated to record a CAGR of 4.9% during the forecast period.

What is the Projected Value of the Commercial Cookers Market By 2033?

The commercial cookers market size is predicted to be valued at US$ 3,151.1 million by 2033.

What is the Present Size of the Commercial Cookers Market?

The commercial cookers market share is valued at US$ 1,953 million in 2023.

Which is the Leading Region in the Commercial Cookers Market?

North America is expected to lead the commercial cookers market with a share of 28.5% by 2033.

Which is the Leading Segment in the Commercial Cookers Market, Based on Type?

Gas segment dominates the commercial cookers market with a share of 68.4% by 2033.

Table of Content

1. Executive Summary | Commercial Cookers Market

    1.1. Global Market Outlook

    1.2. Demand Side Trends

    1.3. Supply Side Trends

    1.4. Technology Roadmap

    1.5. Analysis and Recommendations

2. Market Overview

    2.1. Market Coverage / Taxonomy

    2.2. Market Definition / Scope / Limitations

3. Key Market Trends

    3.1. Key Trends Impacting the Market

    3.2. Product Innovation / Development Trends

4. Key Success Factors

    4.1. Product Adoption / Usage Analysis

    4.2. Product USPs / Features

    4.3. Strategic Promotional Strategies

5. Global Market Demand Analysis 2018 to 2022 and Forecast, 2023 to 2033

    5.1. Historical Market Volume (Units) Analysis, 2018 to 2022

    5.2. Current and Future Market Volume (Units) Projections, 2023 to 2033

    5.3. Y-o-Y Growth Trend Analysis

6. Global Market - Pricing Analysis

    6.1. Regional Pricing Analysis by Type and Pricing Forecast

        6.1.1. Distributor Level pricing

        6.1.2. Manufacturer Level pricing

    6.2. Global Average Pricing Analysis Benchmark

7. Global Market Demand Analysis 2018 to 2022 and Forecast, 2023 to 2033

    7.1. Historical Market Value (US$ Million) Analysis, 2018 to 2022

    7.2. Current and Future Market Value (US$ Million) Projections, 2023 to 2033

        7.2.1. Y-o-Y Growth Trend Analysis

        7.2.2. Absolute $ Opportunity Analysis

8. Market Background

    8.1. Macro-Economic Factors

        8.1.1. Global GDP Growth Outlook

        8.1.2. Global HoReCa sector Overview

        8.1.3. Global Population & Urbanization Growth Outlook

        8.1.4. Global Food Service Industry Growth Outlook

        8.1.5. Global Other Key Macro-Economic Factors

    8.2. Forecast Factors - Relevance & Impact

        8.2.1. Historic Growth Rate of Companies

        8.2.2. Global Food Consumption Outlook

        8.2.3. Technological Advancements and Product Innovations Outlook

        8.2.4. Consumer Spending Overview

        8.2.5. Other key forecast factors

    8.3. Value Chain

        8.3.1. Raw Type Suppliers

        8.3.2. Product Manufacturers

        8.3.3. Average Profitability Margins

    8.4. COVID-19 Crisis - Impact Assessment

        8.4.1. Current Statistics

        8.4.2. Short-Mid-Long Term Outlook

        8.4.3. Likely Rebound

    8.5. Market Dynamics

        8.5.1. Drivers

        8.5.2. Restraints

        8.5.3. Opportunity Analysis

    8.6. Buyers Decision Analysis

9. Global Market Analysis 2018 to 2022 and Forecast 2023 to 2033, by Type 

    9.1. Introduction / Key Findings

    9.2. Historical Market Value (US$ Million) and Volume (Units) Analysis By Type, 2018 to 2022

    9.3. Current and Future Market Value (US$ Million) and Volume (Units) Analysis and Forecast By Type, 2023 to 2033

        9.3.1. Gas

        9.3.2. Electric

        9.3.3. Dual

    9.4. Market Attractiveness Analysis By Type

10. Global Market Analysis 2018 to 2022 and Forecast 2023 to 2033, by Burner

    10.1. Introduction / Key Findings

    10.2. Historical Market Value (US$ Million) and Volume (Units) Analysis By Burner, 2018 to 2022

    10.3. Current and Future Market Value (US$ Million) and Volume (Units) Analysis and Forecast By Burner, 2023 to 2033

        10.3.1. 2 Burners

        10.3.2. 3 Burners

        10.3.3. 4 Burners

        10.3.4. 5 Burners

        10.3.5. 6 Burners

    10.4. Market Attractiveness Analysis By Burner

11. Global Market Analysis 2018 to 2022 and Forecast 2023 to 2033, by End Use

    11.1. Introduction / Key Findings

    11.2. Historical Market Value (US$ Million) and Volume (Units) Analysis By End Use, 2018 to 2022

    11.3. Current and Future Market Value (US$ Million) and Volume (Units) Analysis and Forecast By End Use, 2023 to 2033

        11.3.1. Full-Service Restaurants

        11.3.2. Quick-Service Restaurants

        11.3.3. Catering

    11.4. Market Attractiveness Analysis By End Use

12. Global Market Analysis 2018 to 2022 and Forecast 2023 to 2033, by Region

    12.1. Introduction

    12.2. Historical Market Value (US$ Million) and Volume (Units) Analysis By Region, 2018 to 2022

    12.3. Current Market Value (US$ Million) and Volume (Units) Analysis and Forecast By Region, 2023 to 2033

        12.3.1. North America

        12.3.2. Latin America

        12.3.3. Europe

        12.3.4. East Asia

        12.3.5. South Asia and Pacific

        12.3.6. Middle East and Africa

    12.4. Market Attractiveness Analysis By Region

13. North America Market Analysis 2018 to 2022 and Forecast 2023 to 2033

    13.1. Introduction

    13.2. Pricing Analysis

    13.3. Historical Market (US$ Million) and Volume (Units) Trend Analysis By Market Taxonomy, 2018 to 2022

    13.4. Market Value (US$ Million) and Volume (Units) Forecast By Market Taxonomy, 2023 to 2033

        13.4.1. By Country

            13.4.1.1. United States of America

            13.4.1.2. Canada

        13.4.2. By Type

        13.4.3. By Burner

        13.4.4. By End Use

    13.5. Market Attractiveness Analysis

        13.5.1. By Country

        13.5.2. By Type

        13.5.3. By Burner

        13.5.4. By End Use

    13.6. Market Trends

    13.7. Drivers and Restraints - Impact Analysis

14. Latin America Market Analysis 2018 to 2022 and Forecast 2023 to 2033

    14.1. Introduction

    14.2. Pricing Analysis

    14.3. Historical Market Value (US$ Million) and Volume (Units) Trend Analysis By Market Taxonomy, 2018 to 2022

    14.4. Market Value (US$ Million) and Volume (Units) Forecast By Market Taxonomy, 2023 to 2033

        14.4.1. By Country

            14.4.1.1. Brazil

            14.4.1.2. Mexico

            14.4.1.3. Rest of Latin America

        14.4.2. By Type

        14.4.3. By Burner

        14.4.4. By End Use

    14.5. Market Attractiveness Analysis

        14.5.1. By Country

        14.5.2. By Type

        14.5.3. By Burner

        14.5.4. By End Use

    14.6. Market Trends

    14.7. Drivers and Restraints - Impact Analysis

15. Europe Market Analysis 2018 to 2022 and Forecast 2023 to 2033

    15.1. Introduction

    15.2. Pricing Analysis

    15.3. Historical Market Value (US$ Million) and Volume (Units) Trend Analysis By Market Taxonomy, 2018 to 2022

    15.4. Market (US$ Million) and Volume (Units) Forecast By Market Taxonomy, 2023 to 2033

        15.4.1. By Country

            15.4.1.1. Germany

            15.4.1.2. Italy

            15.4.1.3. France

            15.4.1.4. United Kingdom

            15.4.1.5. Spain

            15.4.1.6. BENELUX

            15.4.1.7. Russia

            15.4.1.8. Rest of Europe

        15.4.2. By Type

        15.4.3. By Burner

        15.4.4. By End Use

    15.5. Market Attractiveness Analysis

        15.5.1. By Country

        15.5.2. By Type

        15.5.3. By Burner

        15.5.4. By End Use

    15.6. Market Trends

    15.7. Drivers and Restraints - Impact Analysis

16. East Asia Market Analysis 2018 to 2022 and Forecast 2023 to 2033

    16.1. Introduction

    16.2. Pricing Analysis

    16.3. Historical Market Value (US$ Million) and Volume (Units) Trend Analysis By Market Taxonomy, 2018 to 2022

    16.4. Market Value (US$ Million) and Volume (Units) Forecast By Market Taxonomy, 2023 to 2033

        16.4.1. By Country

            16.4.1.1. China

            16.4.1.2. Japan

            16.4.1.3. South Korea

        16.4.2. By Type

        16.4.3. By Burner

        16.4.4. By End Use

    16.5. Market Attractiveness Analysis

        16.5.1. By Country

        16.5.2. By Type

        16.5.3. By Burner

        16.5.4. By End Use

    16.6. Market Trends

    16.7. Drivers and Restraints - Impact Analysis

17. South Asia and Pacific Market Analysis 2018 to 2022 and Forecast 2023 to 2033

    17.1. Introduction

    17.2. Pricing Analysis

    17.3. Historical Market Value (US$ Million) and Volume (Units) Trend Analysis By Market Taxonomy, 2018 to 2022

    17.4. Market Value (US$ Million) and Volume (Units) Forecast By Market Taxonomy, 2023 to 2033

        17.4.1. By Country

            17.4.1.1. India

            17.4.1.2. ASEAN

            17.4.1.3. Australia and New Zealand

            17.4.1.4. Rest of South Asia & Pacific

        17.4.2. By Type

        17.4.3. By Burner

        17.4.4. By End Use

    17.5. Market Attractiveness Analysis

        17.5.1. By Country

        17.5.2. By Type

        17.5.3. By Burner

        17.5.4. By End Use

    17.6. Market Trends

    17.7. Key Market Participants - Intensity Mapping

    17.8. Drivers and Restraints - Impact Analysis

18. Middle East and Africa Market Analysis 2018 to 2022 and Forecast 2023 to 2033

    18.1. Introduction

    18.2. Pricing Analysis

    18.3. Historical Market Value (US$ Million) and Volume (Units) Trend Analysis By Market Taxonomy, 2018 to 2022

    18.4. Market Value (US$ Million) and Volume Forecast By Market Taxonomy, 2023 to 2033

        18.4.1. By Country

            18.4.1.1. GCC Countries

            18.4.1.2. Turkey

            18.4.1.3. Northern Africa

            18.4.1.4. South Africa

            18.4.1.5. Rest of Middle East and Africa

        18.4.2. By Type

        18.4.3. By Burner

        18.4.4. By End Use

    18.5. Market Attractiveness Analysis

        18.5.1. By Country

        18.5.2. By Type

        18.5.3. By Burner

        18.5.4. By End Use

    18.6. Market Trends

    18.7. Key Market Participants - Intensity Mapping

    18.8. Drivers and Restraints - Impact Analysis

19. Country-wise Market Analysis 

    19.1. Introduction

        19.1.1. Market Value Proportion Analysis, By Key Countries

        19.1.2. Global Vs. Country Growth Comparison

    19.2. USA Market Analysis

        19.2.1. By Type

        19.2.2. By Burner

        19.2.3. By End Use

    19.3. Canada Market Analysis

        19.3.1. By Type

        19.3.2. By Burner

        19.3.3. By End Use

    19.4. Mexico Market Analysis

        19.4.1. By Type

        19.4.2. By Burner

        19.4.3. By End Use

    19.5. Brazil Market Analysis

        19.5.1. By Type

        19.5.2. By Burner

        19.5.3. By End Use

    19.6. Germany Market Analysis

        19.6.1. By Type

        19.6.2. By Burner

        19.6.3. By End Use

    19.7. Italy Market Analysis

        19.7.1. By Type

        19.7.2. By Burner

        19.7.3. By End Use

    19.8. France Market Analysis

        19.8.1. By Type

        19.8.2. By Burner

        19.8.3. By End Use

    19.9. United Kingdom Market Analysis

        19.9.1. By Type

        19.9.2. By Burner

        19.9.3. By End Use

    19.10. Spain Market Analysis

        19.10.1. By Type

        19.10.2. By Burner

        19.10.3. By End Use

    19.11. Russia Market Analysis

        19.11.1. By Type

        19.11.2. By Burner

        19.11.3. By End Use

    19.12. China Market Analysis

        19.12.1. By Type

        19.12.2. By Burner

        19.12.3. By End Use

    19.13. Japan Market Analysis

        19.13.1. By Type

        19.13.2. By Burner

        19.13.3. By End Use

    19.14. S. Korea Market Analysis

        19.14.1. By Type

        19.14.2. By Burner

        19.14.3. By End Use

    19.15. India Market Analysis

        19.15.1. By Type

        19.15.2. By Burner

        19.15.3. By End Use

    19.16. ASEAN Market Analysis

        19.16.1. By Type

        19.16.2. By Burner

        19.16.3. By End Use

    19.17. Australia and New Zealand Market Analysis

        19.17.1. By Type

        19.17.2. By Burner

        19.17.3. By End Use

    19.18. GCC Countries Market Analysis

        19.18.1. By Type

        19.18.2. By Burner

        19.18.3. By End Use

    19.19. Turkey Market Analysis

        19.19.1. By Type

        19.19.2. By Burner

        19.19.3. By End Use

    19.20. Northern Africa Market Analysis

        19.20.1. By Type

        19.20.2. By Burner

        19.20.3. By End Use

    19.21. South Africa Market Analysis

        19.21.1. By Type

        19.21.2. By Burner

        19.21.3. By End Use

20. Market Structure Analysis

    20.1. Market Analysis by Tier of Companies

    20.2. Market Concentration

    20.3. Market Share Analysis of Top Players

    20.4. Production Capacity Analysis

    20.5. Market Presence Analysis

        20.5.1. By Type Footprint of Players

        20.5.2. By Regional Footprint of Players

21. Competition Analysis

    21.1. Competition Dashboard

    21.2. Competition Benchmarking

    21.3. Competition Deep Dive

        21.3.1. Vulcan

            21.3.1.1. Overview

            21.3.1.2. Product Portfolio

            21.3.1.3. Profitability By Market Segments (Product/Channel/Region)

            21.3.1.4. Sales Footprint

            21.3.1.5. Strategy Overview

        21.3.2. Ali Group

            21.3.2.1. Overview

            21.3.2.2. Product Portfolio

            21.3.2.3. Profitability By Market Segments (Product/Channel/Region)

            21.3.2.4. Sales Footprint

            21.3.2.5. Strategy Overview

        21.3.3. Atosa USA Inc.

            21.3.3.1. Overview

            21.3.3.2. Product Portfolio

            21.3.3.3. Profitability By Market Segments (Product/Channel/Region)

            21.3.3.4. Sales Footprint

            21.3.3.5. Strategy Overview

        21.3.4. Comstock- Castle Stove Co.

            21.3.4.1. Overview

            21.3.4.2. Product Portfolio

            21.3.4.3. Profitability By Market Segments (Product/Channel/Region)

            21.3.4.4. Sales Footprint

            21.3.4.5. Strategy Overview

        21.3.5. Electroflux

            21.3.5.1. Overview

            21.3.5.2. Product Portfolio

            21.3.5.3. Profitability By Market Segments (Product/Channel/Region)

            21.3.5.4. Sales Footprint

            21.3.5.5. Strategy Overview

        21.3.6. Illinois Tool Works Inc.

            21.3.6.1. Overview

            21.3.6.2. Product Portfolio

            21.3.6.3. Profitability By Market Segments (Product/Channel/Region)

            21.3.6.4. Sales Footprint

            21.3.6.5. Strategy Overview

        21.3.7. Duke Manufacturing Co.

            21.3.7.1. Overview

            21.3.7.2. Product Portfolio

            21.3.7.3. Profitability By Market Segments (Product/Channel/Region)

            21.3.7.4. Sales Footprint

            21.3.7.5. Strategy Overview

        21.3.8. Comstock Castle Stove Co

            21.3.8.1. Overview

            21.3.8.2. Product Portfolio

            21.3.8.3. Profitability By Market Segments (Product/Channel/Region)

            21.3.8.4. Sales Footprint

            21.3.8.5. Strategy Overview

        21.3.9. Middleby Corporation

            21.3.9.1. Overview

            21.3.9.2. Product Portfolio

            21.3.9.3. Profitability By Market Segments (Product/Channel/Region)

            21.3.9.4. Sales Footprint

            21.3.9.5. Strategy Overview

        21.3.10. Fagor Professional

            21.3.10.1. Overview

            21.3.10.2. Product Portfolio

            21.3.10.3. Profitability By Market Segments (Product/Channel/Region)

            21.3.10.4. Sales Footprint

            21.3.10.5. Strategy Overview

        21.3.11. Nisbets

            21.3.11.1. Overview

            21.3.11.2. Product Portfolio

            21.3.11.3. Profitability By Market Segments (Product/Channel/Region)

            21.3.11.4. Sales Footprint

            21.3.11.5. Strategy Overview

        21.3.12. Anvil World

            21.3.12.1. Overview

            21.3.12.2. Product Portfolio

            21.3.12.3. Profitability By Market Segments (Product/Channel/Region)

            21.3.12.4. Sales Footprint

            21.3.12.5. Strategy Overview

        21.3.13. AMTek

            21.3.13.1. Overview

            21.3.13.2. Product Portfolio

            21.3.13.3. Profitability By Market Segments (Product/Channel/Region)

            21.3.13.4. Sales Footprint

            21.3.13.5. Strategy Overview

        21.3.14. Henny Penny

            21.3.14.1. Overview

            21.3.14.2. Product Portfolio

            21.3.14.3. Profitability By Market Segments (Product/Channel/Region)

            21.3.14.4. Sales Footprint

            21.3.14.5. Strategy Overview

        21.3.15. Imperial Commercial Cooking Equipment

            21.3.15.1. Overview

            21.3.15.2. Product Portfolio

            21.3.15.3. Profitability By Market Segments (Product/Channel/Region)

            21.3.15.4. Sales Footprint

            21.3.15.5. Strategy Overview

        21.3.16. Ralph Jacobsberg and Company

            21.3.16.1. Overview

            21.3.16.2. Product Portfolio

            21.3.16.3. Profitability By Market Segments (Product/Channel/Region)

            21.3.16.4. Sales Footprint

            21.3.16.5. Strategy Overview

        21.3.17. B+S Commercial Kitchens

            21.3.17.1. Overview

            21.3.17.2. Product Portfolio

            21.3.17.3. Profitability By Market Segments (Product/Channel/Region)

            21.3.17.4. Sales Footprint

            21.3.17.5. Strategy Overview

22. Assumptions and Acronyms Used

23. Research Methodology

List of Tables

Table 01: Global Market (US$ Million) and Volume (Units) Forecast By Type, 2018 to 2033

Table 02: Global Market (US$ Million) and Volume (Units) Forecast By Burner, 2018 to 2033

Table 03: Global Market (US$ Million) and Volume (Units) Forecast By End Use, 2018 to 2033

Table 04: Global Market (US$ Million) and Volume (Units) Forecast by Region, 2018 to 2033

Table 05: North America Market (US$ Million) and Volume (Units) Forecast by Country, 2018 to 2033

Table 06: North America Market (US$ Million) and Volume (Units) Forecast By Type, 2018 to 2033

Table 07: North America Market (US$ Million) and Volume (Units) Forecast By Burner, 2018 to 2033

Table 08: North America Market (US$ Million) and Volume (Units) Forecast By End Use, 2018 to 2033

Table 09: Latin America Market (US$ Million) and Volume (Units) Forecast by Country, 2018 to 2033

Table 10: Latin America Market (US$ Million) and Volume (Units) Forecast By Type, 2018 to 2033

Table 11: Latin America Market (US$ Million) and Volume (Units) Forecast By Burner, 2018 to 2033

Table 12: Latin America Market (US$ Million) and Volume (Units) Forecast By End Use, 2018 to 2033

Table 13: Europe Market (US$ Million) and Volume (Units) Forecast by Country, 2018 to 2033

Table 14: Europe Market (US$ Million) and Volume (Units) Forecast By Type, 2018 to 2033

Table 15: Europe Market (US$ Million) and Volume (Units) Forecast By Burner, 2018 to 2033

Table 16: Europe Market (US$ Million) and Volume (Units) Forecast By End Use, 2018 to 2033

Table 17: South Asia & Pacific Market (US$ Million) and Volume (Units) Forecast by Country, 2018 to 2033

Table 18: South Asia & Pacific Market (US$ Million) and Volume (Units) Forecast By Type, 2018 to 2033

Table 19: South Asia & Pacific Market (US$ Million) and Volume (Units) Forecast By Burner, 2018 to 2033

Table 20: South Asia & Pacific Market (US$ Million) and Volume (Units) Forecast By End Use, 2018 to 2033

Table 21: East Asia Market (US$ Million) and Volume (Units) Forecast by Country, 2018 to 2033

Table 22: East Asia Market (US$ Million) and Volume (Units) Forecast By Type, 2018 to 2033

Table 23: East Asia Market (US$ Million) and Volume (Units) Forecast By Burner, 2018 to 2033

Table 24: East Asia Market (US$ Million) and Volume (Units) Forecast By End Use, 2018 to 2033

Table 25: Middle East & Africa Market (US$ Million) and Volume (Units) Forecast by Country, 2018 to 2033

Table 26: Middle East & Africa Market (US$ Million) and Volume (Units) Forecast By Type, 2018 to 2033

Table 27: Middle East & Africa Market (US$ Million) and Volume (Units) Forecast By Burner, 2018 to 2033

Table 28: Middle East & Africa Market (US$ Million) and Volume (Units) Forecast By End Use, 2018 to 2033

List of Charts

Figure 01: Global Market Volume (units) and Y-o-Y Growth Rate from 2023 to 2033

Figure 02: Global Market Value (US$ Million) and Y-o-Y Growth Rate from 2023 to 2033

Figure 03: Global Market Absolute $ Opportunity Analysis, 2023 to 2033

Figure 04: Global Market Share and BPS Analysis By Type- 2023 to 2033

Figure 05: Global Market Y-o-Y Growth By Type, 2023 to 2033

Figure 06: Global Market Attractiveness Analysis By Type, 2023 to 2033

Figure 07: Global Market Incremental $ Opportunity By Type, 2023 to 2033

Figure 08: Global Market Share and BPS Analysis By Burner- 2023 to 2033

Figure 09: Global Market Y-o-Y Growth By Burner, 2023 to 2033

Figure 10: Global Market Attractiveness Analysis By Burner, 2023 to 2033

Figure 11: Global Market Incremental $ Opportunity By Burner, 2023 to 2033

Figure 12: Global Market Share and BPS Analysis By End Use- 2023 to 2033

Figure 13: Global Market Y-o-Y Growth By End Use, 2023 to 2033

Figure 14: Global Market Attractiveness Analysis By End Use, 2023 to 2033

Figure 15: Global Market Incremental $ Opportunity By End Use, 2023 to 2033

Figure 16: Global Market Share and BPS Analysis By Region - 2023 to 2033

Figure 17: Global Market Y-o-Y Growth By Region, 2023 to 2033

Figure 18: Global Market Attractiveness Analysis By Region, 2023 to 2033

Figure 19: Global Market Incremental $ Opportunity By Region, 2023 to 2033

Figure 20: North America Market Share and BPS Analysis By Country - 2023 to 2033

Figure 21: North America Market Y-o-Y Growth By Country, 2023 to 2033

Figure 22: North America Market Attractiveness Analysis By Country, 2023 to 2033

Figure 23: North America Market Incremental $ Opportunity By Country, 2023 to 2033

Figure 24: North America Market Share and BPS Analysis By Type- 2023 to 2033

Figure 25: North America Market Y-o-Y Growth By Type, 2023 to 2033

Figure 26: North America Market Attractiveness Analysis By Type, 2023 to 2033

Figure 27: North America Market Share and BPS Analysis By Burner- 2023 to 2033

Figure 28: North America Market Y-o-Y Growth By Burner, 2023 to 2033

Figure 29: North America Market Attractiveness Analysis By Burner, 2023 to 2033

Figure 30: North America Market Share and BPS Analysis By End Use- 2023 to 2033

Figure 31: North America Market Y-o-Y Growth By End Use, 2023 to 2033

Figure 32: North America Market Attractiveness Analysis By End Use, 2023 to 2033

Figure 33: Latin America Market Share and BPS Analysis By Country - 2023 to 2033

Figure 34: Latin America Market Y-o-Y Growth By Country, 2023 to 2033

Figure 35: Latin America Market Attractiveness Analysis By Country, 2023 to 2033

Figure 36: Latin America Market Incremental $ Opportunity By Country, 2023 to 2033

Figure 37: Latin America Market Share and BPS Analysis By Type- 2023 to 2033

Figure 38: Latin America Market Y-o-Y Growth By Type, 2023 to 2033

Figure 39: Latin America Market Attractiveness Analysis By Type, 2023 to 2033

Figure 40: Latin America Market Share and BPS Analysis By Burner- 2023 to 2033

Figure 41: Latin America Market Y-o-Y Growth By Burner, 2023 to 2033

Figure 42: Latin America Market Attractiveness Analysis By Burner, 2023 to 2033

Figure 43: Latin America Market Share and BPS Analysis By End Use- 2023 to 2033

Figure 44: Latin America Market Y-o-Y Growth By End Use, 2023 to 2033

Figure 45: Latin America Market Attractiveness Analysis By End Use, 2023 to 2033

Figure 46: Europe Market Share and BPS Analysis By Country - 2023 to 2033

Figure 47: Europe Market Y-o-Y Growth By Country, 2023 to 2033

Figure 48: Europe Market Attractiveness Analysis By Country, 2023 to 2033

Figure 49: Europe Market Incremental $ Opportunity By Country, 2023 to 2033

Figure 50: Europe Market Share and BPS Analysis By Type- 2023 to 2033

Figure 51: Europe Market Y-o-Y Growth By Type, 2023 to 2033

Figure 52: Europe Market Attractiveness Analysis By Type, 2023 to 2033

Figure 53: Europe Market Share and BPS Analysis By Burner- 2023 to 2033

Figure 54: Europe Market Y-o-Y Growth By Burner, 2023 to 2033

Figure 55: Europe Market Attractiveness Analysis By Burner, 2023 to 2033

Figure 56: Europe Market Share and BPS Analysis By End Use- 2023 to 2033

Figure 57: Europe Market Y-o-Y Growth By End Use, 2023 to 2033

Figure 58: Europe Market Attractiveness Analysis By End Use, 2023 to 2033

Figure 59: East Asia Market Share and BPS Analysis By Country - 2023 to 2033

Figure 60: East Asia Market Y-o-Y Growth By Country, 2023 to 2033

Figure 61: East Asia Market Attractiveness Analysis By Country, 2023 to 2033

Figure 62: East Asia Market Incremental $ Opportunity By Country, 2023 to 2033

Figure 63: East Asia Market Share and BPS Analysis By Type- 2023 to 2033

Figure 64: East Asia Market Y-o-Y Growth By Type, 2023 to 2033

Figure 65: East Asia Market Attractiveness Analysis By Type, 2023 to 2033

Figure 66: East Asia Market Share and BPS Analysis By Burner- 2023 to 2033

Figure 67: East Asia Market Y-o-Y Growth By Burner, 2023 to 2033

Figure 68: East Asia Market Attractiveness Analysis By Burner, 2023 to 2033

Figure 69: East Asia Market Share and BPS Analysis By End Use- 2023 to 2033

Figure 70: East Asia Market Y-o-Y Growth By End Use, 2023 to 2033

Figure 71: East Asia Market Attractiveness Analysis By End Use, 2023 to 2033

Figure 72: East Asia Market Share and BPS Analysis By End Use- 2023 to 2033

Figure 73: East Asia Market Y-o-Y Growth By End Use, 2023 to 2033

Figure 74: East Asia Market Attractiveness Analysis By End Use, 2023 to 2033

Figure 75: South Asia & Pacific Market Share and BPS Analysis By Country - 2023 to 2033

Figure 76: South Asia & Pacific Market Y-o-Y Growth By Country, 2023 to 2033

Figure 77: South Asia & Pacific Market Attractiveness Analysis By Country, 2023 to 2033

Figure 78: South Asia & Pacific Market Incremental $ Opportunity By Country, 2023 to 2033

Figure 79: South Asia & Pacific Market Share and BPS Analysis By Type- 2023 to 2033

Figure 80: South Asia & Pacific Market Y-o-Y Growth By Type, 2023 to 2033

Figure 81: South Asia & Pacific Market Attractiveness Analysis By Type, 2023 to 2033

Figure 82: South Asia & Pacific Market Share and BPS Analysis By Burner- 2023 to 2033

Figure 83: South Asia & Pacific Market Y-o-Y Growth By Burner, 2023 to 2033

Figure 84: South Asia & Pacific Market Attractiveness Analysis By Burner, 2023 to 2033

Figure 85: South Asia & Pacific Market Share and BPS Analysis By End Use- 2023 to 2033

Figure 86: South Asia & Pacific Market Y-o-Y Growth By End Use, 2023 to 2033

Figure 87: South Asia & Pacific Market Attractiveness Analysis By End Use, 2023 to 2033

Figure 88: Middle East & Africa Market Share and BPS Analysis By Country - 2023 to 2033

Figure 89: Middle East & Africa Market Y-o-Y Growth By Country, 2023 to 2033

Figure 90: Middle East & Africa Market Attractiveness Analysis By Country, 2023 to 2033

Figure 91: Middle East & Africa Market Incremental $ Opportunity By Country, 2023 to 2033

Figure 92: Middle East & Africa Market Share and BPS Analysis By Type- 2023 to 2033

Figure 93: Middle East & Africa Market Y-o-Y Growth By Type, 2023 to 2033

Figure 94: Middle East & Africa Market Attractiveness Analysis By Type, 2023 to 2033

Figure 95: Middle East & Africa Market Share and BPS Analysis By Burner- 2023 to 2033

Figure 96: Middle East & Africa Market Y-o-Y Growth By Burner, 2023 to 2033

Figure 97: Middle East & Africa Market Attractiveness Analysis By Burner, 2023 to 2033

Figure 98: Middle East & Africa Market Share and BPS Analysis By End Use- 2023 to 2033

Figure 99: Middle East & Africa Market Y-o-Y Growth By End Use, 2023 to 2033

Figure 100: Middle East & Africa Market Attractiveness Analysis By End Use, 2023 to 2033

Explore Process Automation Insights

View Reports

Commercial Cookers Market