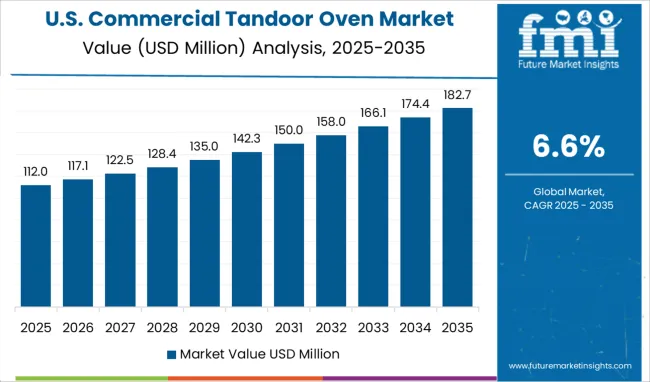
Commercial Tandoor Oven Market Analysis Size and Share Forecast Outlook 2023 to 2033

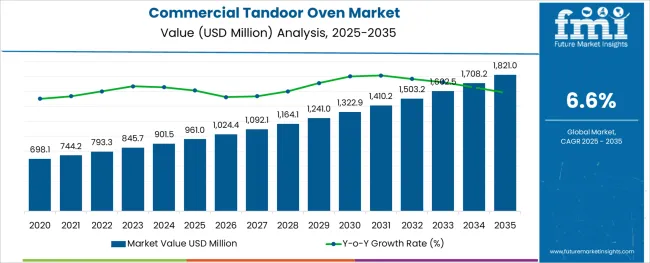
The Commercial Tandoor Oven Market is valued at USD 845.7 Million in 2023 and is projected to grow at a CAGR of 6.6% during the forecast period, to reach a value of USD 1,602.4 Million by the year 2033. Newly released data from Future Market Insights commercial tandoor oven market analysis report shows that the overall demand in terms of volume is projected to grow year-on-year (Y-o-Y) rate of 3.6% after 2023.

Attributes Values
Market Size Value in 2023 USD 845.7 Million
Market Forecast Value in 2033 USD 1,602.4 Million
Global Growth Rate (2023 to 2033) 6.6% CAGR
Forecast Period 2023 to 2033
Collective Value Share: Top 3 Countries (2022A) 38.8%

The capacity of a tandoor oven to retain heat is essential to its operation which makes it a very essential piece of equipment in most hotels for sustaining the very heated tandoori cooking method. Such advantages and sustainability have made it a piece of very popular equipment in traditional hotels and have boosted the commercial tandoor oven market opportunities in recent years.

Tandoor ovens have the advantage of maintaining the desired temperature for hours without the use of extra fuel after they have reached the desired temperature. In addition, because tandoori cooking is done at extremely high heat, even meat can be perfectly cooked in less than 20 minutes. This is a significant benefit for chefs using electric tandoor commercially.

2018 to 2022 Commercial Tandoor Oven Sales Outlook Compared to Forecast from 2023 to 2033

As per the previous commercial tandoor oven market survey report by FMI, the market grew with an average CAGR of 5.4% between the periods covering the years 2018 to 2022. During the final years of the previously recorded timeline, the overall market experienced a major jolt as all the public eating facilities were shut down to curb the spread of Covid-19.

However, during the following years, with the opening up of local markets, the commercial tandoor oven market restored its business activities and has re-established its previous growth rate for the upcoming years as the manufacturers are getting more orders these years and this promises better growth prospects during the forecast years.

Key Trends Influencing the Expansion of the Commercial Tandoor Oven Market

Energy and Time Conservation

Additionally, any food service equipment that decreases labor and boosts productivity is essential because modern restaurant kitchens are getting smaller with space constraints. This is why the equipment that's running smarter, smaller, and easier to operate is favored along with equipment that saves on labor and makes work easier.

Commercial Tandoor can run both with electricity and gases which eventually makes it convenient to use, moreover with its temperature regulation techniques the equipment saves a lot of time in any food service station. The emergence of cloud kitchens in recent years has also increased the demand for commercial tandoor ovens and is predicted to accelerate the target market growth and opportunities.

Multifunctional Kitchen Appliances.

Years following 2023 are also predicted to see a rise in the use of multi-functional kitchen appliances in commercial as well as household kitchens. Restaurant owners strive to maximize their cooking space, and one way they can achieve this is by using equipment that performs numerous tasks. Combination and rapid cook electric tandoor for commercial use, which offers many cooking processes for making a variety of foods, are among the hottest pieces of kitchen equipment.

Visually Appealing and Versatile Cooking Appliances

As the trend toward natural ingredients and clean menus persist, kitchens are implementing open designs and front-of-house prep. Customers want to know where their food originates from and feel involved in the experience, so restaurants need to adapt by putting new cooking technology into place. One trend that we can anticipate during the future years is the use of aesthetically pleasing cooking equipment that can boost the demand for commercial tandoor ovens around the world.

Brightly colored tandoor ovens are examples of some innovative designs that have increased the number of commercial tandoor ovens for sale at local stores. In addition, the new technology replacing large buttons and knobs with sleek touchscreens has rendered the product attractive for many high-end restaurants and hotels in urban areas.
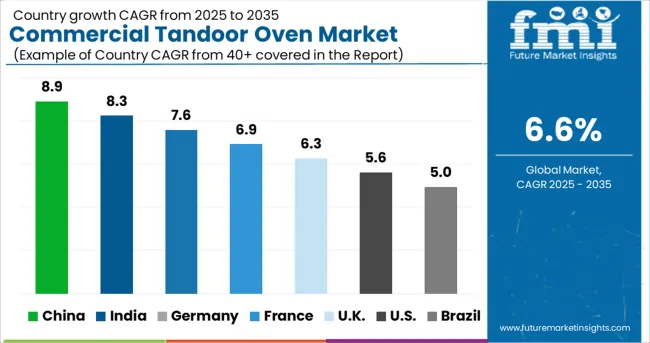
Top Countries Contributing to Commercial Tandoor Oven Demand

How is the USA Turning out to be a Growing Contributor to Commercial Tandoor Oven Market Size?

In the year 2023, the North American region accounts for a significant market share in the commercial tandoor oven market with the changing face of authentic and cultural food in America. For instance, the number of Indian restaurants is estimated to be above 10000 in the USA, and they range from Michelin-starred restaurants to family restaurants to small, local joints.

Every American is now familiar with Tandoor chicken and butter naan, and these foods are offered in nearly every part of the world. Everything from traditional and genuine to upscale fusion cuisine is available presenting a huge commercial tandoor oven market opportunity in the region.

What Factors Are Leading to the Growth of India’ commercial tandoor oven Market?

According to FMI commercial tandoor oven market analysis report, the Indian market is estimated to account for more than 50% share of the South Asia market in 2023 and the following years. Indians are known to live for their tandoori cuisine making it the traditional and largest commercial tandoor oven market.

Tandoori food aficionados and tandoori cuisine is found in every nook and cranny of the country, whether it be a street vendor or a fine dining establishment consequently giving rise to the highest demand for commercial tandoor ovens. The earthy flavor and distinctive Smokey hint of tandoori foods, together with the exquisite scent, set them apart from those prepared on a gas stove. All these factors together are also driving the regional commercial tandoor oven market exponentially

Commercial Tandoor Oven Market Analysis by Type and End Use

Which Material Type Of Tandoor Oven Is Estimated To Grow Significantly?

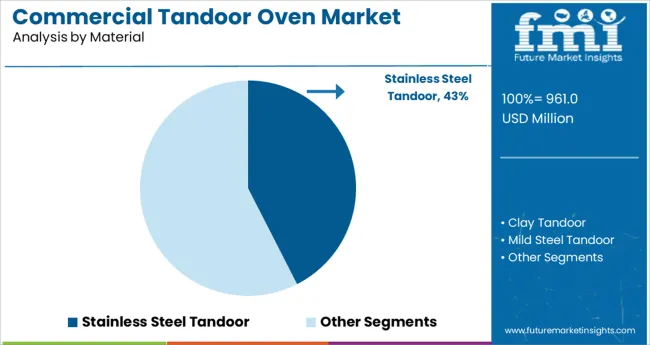
Though commercial clay tandoors are the traditional variants with a significant contribution to the market's growth, stainless steel, and mild steel ovens are preferred more these days for their efficiency and utility. Stainless steel has a variety of corrosion-resistant qualities, including not corroding and not rusting which makes it a perfect choice for any type of kitchen utensil and equipment. Also, stainless steel weighs nearly three times as much as aluminum so it provides a sturdy build quality to all types of commercial tandoor for long-term use.

Stainless steel is a low-maintenance metal that is also simple and inexpensive to clean and maintain. Moreover, due to its ease of cleaning and resistance to corrosion, stainless steel tandoor is favored in sterile and clean environments making it the most profitable material for commercial tandoor oven manufacturers these days.

Which Segment of the Commercial Tandoor Oven Market is the Largest Based on Capacity?

As the major buyers of this product are large restaurants and hotels that require the preparation of bread and naan in large quantities so commercial tandoor ovens with a capacity of more than 600 liters are the highest-selling product. Also, the efficiency and utility of these large ovens make them the preferred product for most end users.

However, as per the commercial tandoor oven market analysis report released by FMI, in recent years there has been a surge in smaller size ovens ranging from 100 liters to 400 liters. This major development is attributed to the growing sales of commercial tandoor ovens to be used for the purpose of domestic cooking and prepared food business in small towns.

Which is the Best Promising Commercial Tandoor Oven Type Available in the Market?

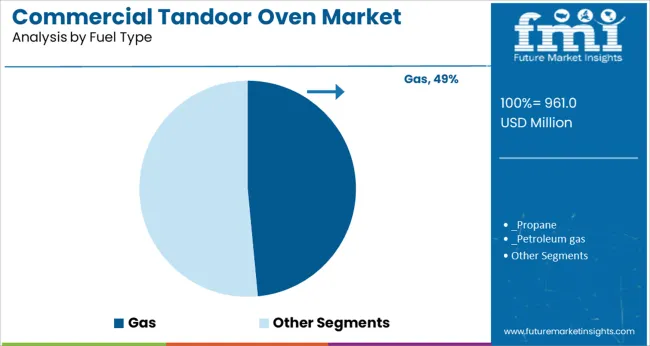
Presently, both the gas and electric variant of the product are available contributing equally to the commercial tandoor oven market key trends and opportunities. But, as per the market report, the electric tandoor for commercial use is overtaking the former type for better convenience and ease of use. Moreover, the rising prices of fuel and petroleum gas might prove to be a detrimental factor for the commercial tandoor oven market growth in the gas category. Other than that, some variants that are designed to run on coal and wood also do have a significant share in augmenting the commercial tandoor oven market trends in present times.
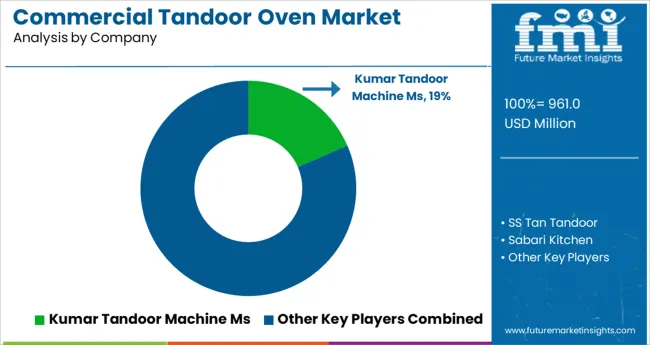
Competitive Outlook in the Commercial Tandoor Oven Industry

As the commercial tandoor oven manufacturers are mostly localized in South Asia region, particularly India, it makes the overall market highly competitive. Nevertheless, the growing popularity of Indian cuisine around the world can be an easy opportunity for any utensil manufacturer to enter the global commercial tandoor oven market.

Some of the major players operating in the commercial tandoor oven market include Kumar Tandoor Machine Ms, SS Tan Tandoor, Sabari Kitchen, Ranvir, Dhanraj Bhati Tandoorwala, Shri Krishna Cooking Equipments, Nand Equipment Pvt. Ltd, Mohanlal Tandoors, Homdoor, Kanhaiyalal Tandoors, GULSHAN TANDOOR, Shiv Tandoor Wala, Bhawani among others.

Scope of the Commercial Tandoor Oven Market Report

Attribute Details
Market Size Value in 2023 USD 845.7 Million
Market Forecast Value in 2033 USD 1,602.4 Million
Global Growth Rate 6.6% CAGR
Forecast Period 2023 to 2033
Historical Data Available for 2018 to 2022
Market Analysis MT for Volume and USD Million for Value
Key Regions Covered North America; Latin America; Europe; East Asia; South Asia; Oceania; and MEA
Key Countries Covered United States, Canada, Brazil, Mexico, Argentina, Chile, Peru, Germany, France, Italy, Spain, The United Kingdom, Netherlands, Belgium, Nordic, Russia, China, Japan, South Korea, India, Thailand, Malaysia, Indonesia, Singapore, Australia, New Zealand, GCC Countries, South Africa, Central Africa, North Africa, and others
Key Market Segments Covered Material, Shape, Fuel Type, Capacity, Region
Key Companies Profiled

Kumar Tandoor Machine Ms; SS Tan Tandoor; Sabari Kitchen; Ranvir; Dhanraj Bhati Tandoorwala; Shri Krishna Cooking Equipment; Nand Equipment Pvt. Ltd; Mohanlal Tandoors; Homdoor; Kanhaiyalal Tandoors; GULSHAN TANDOOR; Shiv Tandoor Wala; Bhawani; Others (On additional request)

Pricing Available upon Request

Top Investment Segments in the Commercial Tandoor Oven Market by Category

By Material:

  • Stainless Steel Tandoor
  • Clay tandoor
  • Mild Steel Tandoor

By Shape:

  • Round
  • Square

By Fuel type:

  • Gas
    • Propane
    • Petroleum gas
  • Electricity
  • Natural Sources
    • Coal
    • Wood

By Capacity:

  • 100-200 Ltrs
  • 200-400 Ltrs
  • 400-600 Ltrs
  • Above 600 Ltrs

By Region:

  • North America
  • Latin America
  • Europe
  • East Asia
  • South Asia
  • Oceania
  • Middle East & Africa

Table of Content

  • 1. Executive Summary | Commercial Tandoor Oven Market
  • 2. Market Overview
  • 3. Market Background
  • 4. Global Market Analysis 2018 to 2022 and Forecast, 2023 to 2033
  • 5. Global Market Analysis 2018 to 2022 and Forecast 2023 to 2033, By Material
    • 5.1 Stainless Steel Tandoor
    • 5.2 Clay Tandoor
    • 5.3 Mild Steel Tandoor
  • 6. Global Market Analysis 2018 to 2022 and Forecast 2023 to 2033, By Shape
    • 6.1 Round
    • 6.2 Square
  • 7. Global Market Analysis 2018 to 2022 and Forecast 2023 to 2033, By Fuel
    • 7.1 Gas (propane/petroleum gas)
    • 7.2 Electricity
    • 7.3 Natural Sources
  • 8. Global Market Analysis 2018 to 2022 and Forecast 2023 to 2033, By Capacity
    • 8.1 100-200 Ltrs
    • 8.2 200-400 Ltrs
    • 8.3 400-600 Ltrs
    • 8.4 Above 600 Ltrs
  • 9. Global Market Analysis 2018 to 2022 and Forecast 2023 to 2033, By Region
    • 9.1 North America
    • 9.2 Latin America
    • 9.3 Europe
    • 9.4 East Asia
    • 9.5 South Asia
    • 9.6 Oceania
    • 9.7 Middle East and Africa (MEA)
  • 10. North America Market Analysis 2018 to 2022 and Forecast 2023 to 2033, By Country
  • 11. Latin America Market Analysis 2018 to 2022 and Forecast 2023 to 2033, By Country
  • 12. Europe Market Analysis 2018 to 2022 and Forecast 2023 to 2033, By Country
  • 13. East Asia Market Analysis 2018 to 2022 and Forecast 2023 to 2033, By Country
  • 14. South Asia Market Analysis 2018 to 2022 and Forecast 2023 to 2033, By Country
  • 15. Oceania Market Analysis 2018 to 2022 and Forecast 2023 to 2033, By Country
  • 16. MEA Market Analysis 2018 to 2022 and Forecast 2023 to 2033, By Country
  • 17. Key Countries Market Analysis
  • 18. Market Structure Analysis
  • 19. Competition Analysis
    • 19.1 Kumar Tandoor Machine Ms
    • 19.2 SS Tan Tandoor
    • 19.3 Sabari Kitchen
    • 19.4 Ranvir
    • 19.5 Dhanraj Bhati Tandoorwala
    • 19.6 Shri Krishna Cooking Equipments
    • 19.7 Nand Equipment Pvt. Ltd
    • 19.8 Mohanlal Tandoors
    • 19.9 Homdoor
    • 19.10 Kanhaiyalal Tandoors
    • 19.11 GULSHAN TANDOOR
    • 19.12 Shiv Tandoor Wala
    • 19.13 Bhawani
  • 20. Assumptions & Acronyms Used
  • 21. Research Methodology

List of Tables

Table 1: Global Market Value (US$ million) Forecast by Region, 2018 to 2033

Table 2: Global Market Volume (Unit) Forecast by Region, 2018 to 2033

Table 3: Global Market Value (US$ million) Forecast by Material, 2018 to 2033

Table 4: Global Market Volume (Unit) Forecast by Material, 2018 to 2033

Table 5: Global Market Value (US$ million) Forecast by Shape, 2018 to 2033

Table 6: Global Market Volume (Unit) Forecast by Shape, 2018 to 2033

Table 7: Global Market Value (US$ million) Forecast by Fuel, 2018 to 2033

Table 8: Global Market Volume (Unit) Forecast by Fuel, 2018 to 2033

Table 9: Global Market Value (US$ million) Forecast by Capacity, 2018 to 2033

Table 10: Global Market Volume (Unit) Forecast by Capacity, 2018 to 2033

Table 11: North America Market Value (US$ million) Forecast by Country, 2018 to 2033

Table 12: North America Market Volume (Unit) Forecast by Country, 2018 to 2033

Table 13: North America Market Value (US$ million) Forecast by Material, 2018 to 2033

Table 14: North America Market Volume (Unit) Forecast by Material, 2018 to 2033

Table 15: North America Market Value (US$ million) Forecast by Shape, 2018 to 2033

Table 16: North America Market Volume (Unit) Forecast by Shape, 2018 to 2033

Table 17: North America Market Value (US$ million) Forecast by Fuel, 2018 to 2033

Table 18: North America Market Volume (Unit) Forecast by Fuel, 2018 to 2033

Table 19: North America Market Value (US$ million) Forecast by Capacity, 2018 to 2033

Table 20: North America Market Volume (Unit) Forecast by Capacity, 2018 to 2033

Table 21: Latin America Market Value (US$ million) Forecast by Country, 2018 to 2033

Table 22: Latin America Market Volume (Unit) Forecast by Country, 2018 to 2033

Table 23: Latin America Market Value (US$ million) Forecast by Material, 2018 to 2033

Table 24: Latin America Market Volume (Unit) Forecast by Material, 2018 to 2033

Table 25: Latin America Market Value (US$ million) Forecast by Shape, 2018 to 2033

Table 26: Latin America Market Volume (Unit) Forecast by Shape, 2018 to 2033

Table 27: Latin America Market Value (US$ million) Forecast by Fuel, 2018 to 2033

Table 28: Latin America Market Volume (Unit) Forecast by Fuel, 2018 to 2033

Table 29: Latin America Market Value (US$ million) Forecast by Capacity, 2018 to 2033

Table 30: Latin America Market Volume (Unit) Forecast by Capacity, 2018 to 2033

Table 31: Europe Market Value (US$ million) Forecast by Country, 2018 to 2033

Table 32: Europe Market Volume (Unit) Forecast by Country, 2018 to 2033

Table 33: Europe Market Value (US$ million) Forecast by Material, 2018 to 2033

Table 34: Europe Market Volume (Unit) Forecast by Material, 2018 to 2033

Table 35: Europe Market Value (US$ million) Forecast by Shape, 2018 to 2033

Table 36: Europe Market Volume (Unit) Forecast by Shape, 2018 to 2033

Table 37: Europe Market Value (US$ million) Forecast by Fuel, 2018 to 2033

Table 38: Europe Market Volume (Unit) Forecast by Fuel, 2018 to 2033

Table 39: Europe Market Value (US$ million) Forecast by Capacity, 2018 to 2033

Table 40: Europe Market Volume (Unit) Forecast by Capacity, 2018 to 2033

Table 41: East Asia Market Value (US$ million) Forecast by Country, 2018 to 2033

Table 42: East Asia Market Volume (Unit) Forecast by Country, 2018 to 2033

Table 43: East Asia Market Value (US$ million) Forecast by Material, 2018 to 2033

Table 44: East Asia Market Volume (Unit) Forecast by Material, 2018 to 2033

Table 45: East Asia Market Value (US$ million) Forecast by Shape, 2018 to 2033

Table 46: East Asia Market Volume (Unit) Forecast by Shape, 2018 to 2033

Table 47: East Asia Market Value (US$ million) Forecast by Fuel, 2018 to 2033

Table 48: East Asia Market Volume (Unit) Forecast by Fuel, 2018 to 2033

Table 49: East Asia Market Value (US$ million) Forecast by Capacity, 2018 to 2033

Table 50: East Asia Market Volume (Unit) Forecast by Capacity, 2018 to 2033

Table 51: South Asia Market Value (US$ million) Forecast by Country, 2018 to 2033

Table 52: South Asia Market Volume (Unit) Forecast by Country, 2018 to 2033

Table 53: South Asia Market Value (US$ million) Forecast by Material, 2018 to 2033

Table 54: South Asia Market Volume (Unit) Forecast by Material, 2018 to 2033

Table 55: South Asia Market Value (US$ million) Forecast by Shape, 2018 to 2033

Table 56: South Asia Market Volume (Unit) Forecast by Shape, 2018 to 2033

Table 57: South Asia Market Value (US$ million) Forecast by Fuel, 2018 to 2033

Table 58: South Asia Market Volume (Unit) Forecast by Fuel, 2018 to 2033

Table 59: South Asia Market Value (US$ million) Forecast by Capacity, 2018 to 2033

Table 60: South Asia Market Volume (Unit) Forecast by Capacity, 2018 to 2033

Table 61: Oceania Market Value (US$ million) Forecast by Country, 2018 to 2033

Table 62: Oceania Market Volume (Unit) Forecast by Country, 2018 to 2033

Table 63: Oceania Market Value (US$ million) Forecast by Material, 2018 to 2033

Table 64: Oceania Market Volume (Unit) Forecast by Material, 2018 to 2033

Table 65: Oceania Market Value (US$ million) Forecast by Shape, 2018 to 2033

Table 66: Oceania Market Volume (Unit) Forecast by Shape, 2018 to 2033

Table 67: Oceania Market Value (US$ million) Forecast by Fuel, 2018 to 2033

Table 68: Oceania Market Volume (Unit) Forecast by Fuel, 2018 to 2033

Table 69: Oceania Market Value (US$ million) Forecast by Capacity, 2018 to 2033

Table 70: Oceania Market Volume (Unit) Forecast by Capacity, 2018 to 2033

Table 71: MEA Market Value (US$ million) Forecast by Country, 2018 to 2033

Table 72: MEA Market Volume (Unit) Forecast by Country, 2018 to 2033

Table 73: MEA Market Value (US$ million) Forecast by Material, 2018 to 2033

Table 74: MEA Market Volume (Unit) Forecast by Material, 2018 to 2033

Table 75: MEA Market Value (US$ million) Forecast by Shape, 2018 to 2033

Table 76: MEA Market Volume (Unit) Forecast by Shape, 2018 to 2033

Table 77: MEA Market Value (US$ million) Forecast by Fuel, 2018 to 2033

Table 78: MEA Market Volume (Unit) Forecast by Fuel, 2018 to 2033

Table 79: MEA Market Value (US$ million) Forecast by Capacity, 2018 to 2033

Table 80: MEA Market Volume (Unit) Forecast by Capacity, 2018 to 2033

List of Figures

Figure 1: Global Market Value (US$ million) by Material, 2023 to 2033

Figure 2: Global Market Value (US$ million) by Shape, 2023 to 2033

Figure 3: Global Market Value (US$ million) by Fuel, 2023 to 2033

Figure 4: Global Market Value (US$ million) by Capacity, 2023 to 2033

Figure 5: Global Market Value (US$ million) by Region, 2023 to 2033

Figure 6: Global Market Value (US$ million) Analysis by Region, 2018 to 2033

Figure 7: Global Market Volume (Unit) Analysis by Region, 2018 to 2033

Figure 8: Global Market Value Share (%) and BPS Analysis by Region, 2023 to 2033

Figure 9: Global Market Y-o-Y Growth (%) Projections by Region, 2023 to 2033

Figure 10: Global Market Value (US$ million) Analysis by Material, 2018 to 2033

Figure 11: Global Market Volume (Unit) Analysis by Material, 2018 to 2033

Figure 12: Global Market Value Share (%) and BPS Analysis by Material, 2023 to 2033

Figure 13: Global Market Y-o-Y Growth (%) Projections by Material, 2023 to 2033

Figure 14: Global Market Value (US$ million) Analysis by Shape, 2018 to 2033

Figure 15: Global Market Volume (Unit) Analysis by Shape, 2018 to 2033

Figure 16: Global Market Value Share (%) and BPS Analysis by Shape, 2023 to 2033

Figure 17: Global Market Y-o-Y Growth (%) Projections by Shape, 2023 to 2033

Figure 18: Global Market Value (US$ million) Analysis by Fuel, 2018 to 2033

Figure 19: Global Market Volume (Unit) Analysis by Fuel, 2018 to 2033

Figure 20: Global Market Value Share (%) and BPS Analysis by Fuel, 2023 to 2033

Figure 21: Global Market Y-o-Y Growth (%) Projections by Fuel, 2023 to 2033

Figure 22: Global Market Value (US$ million) Analysis by Capacity, 2018 to 2033

Figure 23: Global Market Volume (Unit) Analysis by Capacity, 2018 to 2033

Figure 24: Global Market Value Share (%) and BPS Analysis by Capacity, 2023 to 2033

Figure 25: Global Market Y-o-Y Growth (%) Projections by Capacity, 2023 to 2033

Figure 26: Global Market Attractiveness by Material, 2023 to 2033

Figure 27: Global Market Attractiveness by Shape, 2023 to 2033

Figure 28: Global Market Attractiveness by Fuel, 2023 to 2033

Figure 29: Global Market Attractiveness by Capacity, 2023 to 2033

Figure 30: Global Market Attractiveness by Region, 2023 to 2033

Figure 31: North America Market Value (US$ million) by Material, 2023 to 2033

Figure 32: North America Market Value (US$ million) by Shape, 2023 to 2033

Figure 33: North America Market Value (US$ million) by Fuel, 2023 to 2033

Figure 34: North America Market Value (US$ million) by Capacity, 2023 to 2033

Figure 35: North America Market Value (US$ million) by Country, 2023 to 2033

Figure 36: North America Market Value (US$ million) Analysis by Country, 2018 to 2033

Figure 37: North America Market Volume (Unit) Analysis by Country, 2018 to 2033

Figure 38: North America Market Value Share (%) and BPS Analysis by Country, 2023 to 2033

Figure 39: North America Market Y-o-Y Growth (%) Projections by Country, 2023 to 2033

Figure 40: North America Market Value (US$ million) Analysis by Material, 2018 to 2033

Figure 41: North America Market Volume (Unit) Analysis by Material, 2018 to 2033

Figure 42: North America Market Value Share (%) and BPS Analysis by Material, 2023 to 2033

Figure 43: North America Market Y-o-Y Growth (%) Projections by Material, 2023 to 2033

Figure 44: North America Market Value (US$ million) Analysis by Shape, 2018 to 2033

Figure 45: North America Market Volume (Unit) Analysis by Shape, 2018 to 2033

Figure 46: North America Market Value Share (%) and BPS Analysis by Shape, 2023 to 2033

Figure 47: North America Market Y-o-Y Growth (%) Projections by Shape, 2023 to 2033

Figure 48: North America Market Value (US$ million) Analysis by Fuel, 2018 to 2033

Figure 49: North America Market Volume (Unit) Analysis by Fuel, 2018 to 2033

Figure 50: North America Market Value Share (%) and BPS Analysis by Fuel, 2023 to 2033

Figure 51: North America Market Y-o-Y Growth (%) Projections by Fuel, 2023 to 2033

Figure 52: North America Market Value (US$ million) Analysis by Capacity, 2018 to 2033

Figure 53: North America Market Volume (Unit) Analysis by Capacity, 2018 to 2033

Figure 54: North America Market Value Share (%) and BPS Analysis by Capacity, 2023 to 2033

Figure 55: North America Market Y-o-Y Growth (%) Projections by Capacity, 2023 to 2033

Figure 56: North America Market Attractiveness by Material, 2023 to 2033

Figure 57: North America Market Attractiveness by Shape, 2023 to 2033

Figure 58: North America Market Attractiveness by Fuel, 2023 to 2033

Figure 59: North America Market Attractiveness by Capacity, 2023 to 2033

Figure 60: North America Market Attractiveness by Country, 2023 to 2033

Figure 61: Latin America Market Value (US$ million) by Material, 2023 to 2033

Figure 62: Latin America Market Value (US$ million) by Shape, 2023 to 2033

Figure 63: Latin America Market Value (US$ million) by Fuel, 2023 to 2033

Figure 64: Latin America Market Value (US$ million) by Capacity, 2023 to 2033

Figure 65: Latin America Market Value (US$ million) by Country, 2023 to 2033

Figure 66: Latin America Market Value (US$ million) Analysis by Country, 2018 to 2033

Figure 67: Latin America Market Volume (Unit) Analysis by Country, 2018 to 2033

Figure 68: Latin America Market Value Share (%) and BPS Analysis by Country, 2023 to 2033

Figure 69: Latin America Market Y-o-Y Growth (%) Projections by Country, 2023 to 2033

Figure 70: Latin America Market Value (US$ million) Analysis by Material, 2018 to 2033

Figure 71: Latin America Market Volume (Unit) Analysis by Material, 2018 to 2033

Figure 72: Latin America Market Value Share (%) and BPS Analysis by Material, 2023 to 2033

Figure 73: Latin America Market Y-o-Y Growth (%) Projections by Material, 2023 to 2033

Figure 74: Latin America Market Value (US$ million) Analysis by Shape, 2018 to 2033

Figure 75: Latin America Market Volume (Unit) Analysis by Shape, 2018 to 2033

Figure 76: Latin America Market Value Share (%) and BPS Analysis by Shape, 2023 to 2033

Figure 77: Latin America Market Y-o-Y Growth (%) Projections by Shape, 2023 to 2033

Figure 78: Latin America Market Value (US$ million) Analysis by Fuel, 2018 to 2033

Figure 79: Latin America Market Volume (Unit) Analysis by Fuel, 2018 to 2033

Figure 80: Latin America Market Value Share (%) and BPS Analysis by Fuel, 2023 to 2033

Figure 81: Latin America Market Y-o-Y Growth (%) Projections by Fuel, 2023 to 2033

Figure 82: Latin America Market Value (US$ million) Analysis by Capacity, 2018 to 2033

Figure 83: Latin America Market Volume (Unit) Analysis by Capacity, 2018 to 2033

Figure 84: Latin America Market Value Share (%) and BPS Analysis by Capacity, 2023 to 2033

Figure 85: Latin America Market Y-o-Y Growth (%) Projections by Capacity, 2023 to 2033

Figure 86: Latin America Market Attractiveness by Material, 2023 to 2033

Figure 87: Latin America Market Attractiveness by Shape, 2023 to 2033

Figure 88: Latin America Market Attractiveness by Fuel, 2023 to 2033

Figure 89: Latin America Market Attractiveness by Capacity, 2023 to 2033

Figure 90: Latin America Market Attractiveness by Country, 2023 to 2033

Figure 91: Europe Market Value (US$ million) by Material, 2023 to 2033

Figure 92: Europe Market Value (US$ million) by Shape, 2023 to 2033

Figure 93: Europe Market Value (US$ million) by Fuel, 2023 to 2033

Figure 94: Europe Market Value (US$ million) by Capacity, 2023 to 2033

Figure 95: Europe Market Value (US$ million) by Country, 2023 to 2033

Figure 96: Europe Market Value (US$ million) Analysis by Country, 2018 to 2033

Figure 97: Europe Market Volume (Unit) Analysis by Country, 2018 to 2033

Figure 98: Europe Market Value Share (%) and BPS Analysis by Country, 2023 to 2033

Figure 99: Europe Market Y-o-Y Growth (%) Projections by Country, 2023 to 2033

Figure 100: Europe Market Value (US$ million) Analysis by Material, 2018 to 2033

Figure 101: Europe Market Volume (Unit) Analysis by Material, 2018 to 2033

Figure 102: Europe Market Value Share (%) and BPS Analysis by Material, 2023 to 2033

Figure 103: Europe Market Y-o-Y Growth (%) Projections by Material, 2023 to 2033

Figure 104: Europe Market Value (US$ million) Analysis by Shape, 2018 to 2033

Figure 105: Europe Market Volume (Unit) Analysis by Shape, 2018 to 2033

Figure 106: Europe Market Value Share (%) and BPS Analysis by Shape, 2023 to 2033

Figure 107: Europe Market Y-o-Y Growth (%) Projections by Shape, 2023 to 2033

Figure 108: Europe Market Value (US$ million) Analysis by Fuel, 2018 to 2033

Figure 109: Europe Market Volume (Unit) Analysis by Fuel, 2018 to 2033

Figure 110: Europe Market Value Share (%) and BPS Analysis by Fuel, 2023 to 2033

Figure 111: Europe Market Y-o-Y Growth (%) Projections by Fuel, 2023 to 2033

Figure 112: Europe Market Value (US$ million) Analysis by Capacity, 2018 to 2033

Figure 113: Europe Market Volume (Unit) Analysis by Capacity, 2018 to 2033

Figure 114: Europe Market Value Share (%) and BPS Analysis by Capacity, 2023 to 2033

Figure 115: Europe Market Y-o-Y Growth (%) Projections by Capacity, 2023 to 2033

Figure 116: Europe Market Attractiveness by Material, 2023 to 2033

Figure 117: Europe Market Attractiveness by Shape, 2023 to 2033

Figure 118: Europe Market Attractiveness by Fuel, 2023 to 2033

Figure 119: Europe Market Attractiveness by Capacity, 2023 to 2033

Figure 120: Europe Market Attractiveness by Country, 2023 to 2033

Figure 121: East Asia Market Value (US$ million) by Material, 2023 to 2033

Figure 122: East Asia Market Value (US$ million) by Shape, 2023 to 2033

Figure 123: East Asia Market Value (US$ million) by Fuel, 2023 to 2033

Figure 124: East Asia Market Value (US$ million) by Capacity, 2023 to 2033

Figure 125: East Asia Market Value (US$ million) by Country, 2023 to 2033

Figure 126: East Asia Market Value (US$ million) Analysis by Country, 2018 to 2033

Figure 127: East Asia Market Volume (Unit) Analysis by Country, 2018 to 2033

Figure 128: East Asia Market Value Share (%) and BPS Analysis by Country, 2023 to 2033

Figure 129: East Asia Market Y-o-Y Growth (%) Projections by Country, 2023 to 2033

Figure 130: East Asia Market Value (US$ million) Analysis by Material, 2018 to 2033

Figure 131: East Asia Market Volume (Unit) Analysis by Material, 2018 to 2033

Figure 132: East Asia Market Value Share (%) and BPS Analysis by Material, 2023 to 2033

Figure 133: East Asia Market Y-o-Y Growth (%) Projections by Material, 2023 to 2033

Figure 134: East Asia Market Value (US$ million) Analysis by Shape, 2018 to 2033

Figure 135: East Asia Market Volume (Unit) Analysis by Shape, 2018 to 2033

Figure 136: East Asia Market Value Share (%) and BPS Analysis by Shape, 2023 to 2033

Figure 137: East Asia Market Y-o-Y Growth (%) Projections by Shape, 2023 to 2033

Figure 138: East Asia Market Value (US$ million) Analysis by Fuel, 2018 to 2033

Figure 139: East Asia Market Volume (Unit) Analysis by Fuel, 2018 to 2033

Figure 140: East Asia Market Value Share (%) and BPS Analysis by Fuel, 2023 to 2033

Figure 141: East Asia Market Y-o-Y Growth (%) Projections by Fuel, 2023 to 2033

Figure 142: East Asia Market Value (US$ million) Analysis by Capacity, 2018 to 2033

Figure 143: East Asia Market Volume (Unit) Analysis by Capacity, 2018 to 2033

Figure 144: East Asia Market Value Share (%) and BPS Analysis by Capacity, 2023 to 2033

Figure 145: East Asia Market Y-o-Y Growth (%) Projections by Capacity, 2023 to 2033

Figure 146: East Asia Market Attractiveness by Material, 2023 to 2033

Figure 147: East Asia Market Attractiveness by Shape, 2023 to 2033

Figure 148: East Asia Market Attractiveness by Fuel, 2023 to 2033

Figure 149: East Asia Market Attractiveness by Capacity, 2023 to 2033

Figure 150: East Asia Market Attractiveness by Country, 2023 to 2033

Figure 151: South Asia Market Value (US$ million) by Material, 2023 to 2033

Figure 152: South Asia Market Value (US$ million) by Shape, 2023 to 2033

Figure 153: South Asia Market Value (US$ million) by Fuel, 2023 to 2033

Figure 154: South Asia Market Value (US$ million) by Capacity, 2023 to 2033

Figure 155: South Asia Market Value (US$ million) by Country, 2023 to 2033

Figure 156: South Asia Market Value (US$ million) Analysis by Country, 2018 to 2033

Figure 157: South Asia Market Volume (Unit) Analysis by Country, 2018 to 2033

Figure 158: South Asia Market Value Share (%) and BPS Analysis by Country, 2023 to 2033

Figure 159: South Asia Market Y-o-Y Growth (%) Projections by Country, 2023 to 2033

Figure 160: South Asia Market Value (US$ million) Analysis by Material, 2018 to 2033

Figure 161: South Asia Market Volume (Unit) Analysis by Material, 2018 to 2033

Figure 162: South Asia Market Value Share (%) and BPS Analysis by Material, 2023 to 2033

Figure 163: South Asia Market Y-o-Y Growth (%) Projections by Material, 2023 to 2033

Figure 164: South Asia Market Value (US$ million) Analysis by Shape, 2018 to 2033

Figure 165: South Asia Market Volume (Unit) Analysis by Shape, 2018 to 2033

Figure 166: South Asia Market Value Share (%) and BPS Analysis by Shape, 2023 to 2033

Figure 167: South Asia Market Y-o-Y Growth (%) Projections by Shape, 2023 to 2033

Figure 168: South Asia Market Value (US$ million) Analysis by Fuel, 2018 to 2033

Figure 169: South Asia Market Volume (Unit) Analysis by Fuel, 2018 to 2033

Figure 170: South Asia Market Value Share (%) and BPS Analysis by Fuel, 2023 to 2033

Figure 171: South Asia Market Y-o-Y Growth (%) Projections by Fuel, 2023 to 2033

Figure 172: South Asia Market Value (US$ million) Analysis by Capacity, 2018 to 2033

Figure 173: South Asia Market Volume (Unit) Analysis by Capacity, 2018 to 2033

Figure 174: South Asia Market Value Share (%) and BPS Analysis by Capacity, 2023 to 2033

Figure 175: South Asia Market Y-o-Y Growth (%) Projections by Capacity, 2023 to 2033

Figure 176: South Asia Market Attractiveness by Material, 2023 to 2033

Figure 177: South Asia Market Attractiveness by Shape, 2023 to 2033

Figure 178: South Asia Market Attractiveness by Fuel, 2023 to 2033

Figure 179: South Asia Market Attractiveness by Capacity, 2023 to 2033

Figure 180: South Asia Market Attractiveness by Country, 2023 to 2033

Figure 181: Oceania Market Value (US$ million) by Material, 2023 to 2033

Figure 182: Oceania Market Value (US$ million) by Shape, 2023 to 2033

Figure 183: Oceania Market Value (US$ million) by Fuel, 2023 to 2033

Figure 184: Oceania Market Value (US$ million) by Capacity, 2023 to 2033

Figure 185: Oceania Market Value (US$ million) by Country, 2023 to 2033

Figure 186: Oceania Market Value (US$ million) Analysis by Country, 2018 to 2033

Figure 187: Oceania Market Volume (Unit) Analysis by Country, 2018 to 2033

Figure 188: Oceania Market Value Share (%) and BPS Analysis by Country, 2023 to 2033

Figure 189: Oceania Market Y-o-Y Growth (%) Projections by Country, 2023 to 2033

Figure 190: Oceania Market Value (US$ million) Analysis by Material, 2018 to 2033

Figure 191: Oceania Market Volume (Unit) Analysis by Material, 2018 to 2033

Figure 192: Oceania Market Value Share (%) and BPS Analysis by Material, 2023 to 2033

Figure 193: Oceania Market Y-o-Y Growth (%) Projections by Material, 2023 to 2033

Figure 194: Oceania Market Value (US$ million) Analysis by Shape, 2018 to 2033

Figure 195: Oceania Market Volume (Unit) Analysis by Shape, 2018 to 2033

Figure 196: Oceania Market Value Share (%) and BPS Analysis by Shape, 2023 to 2033

Figure 197: Oceania Market Y-o-Y Growth (%) Projections by Shape, 2023 to 2033

Figure 198: Oceania Market Value (US$ million) Analysis by Fuel, 2018 to 2033

Figure 199: Oceania Market Volume (Unit) Analysis by Fuel, 2018 to 2033

Figure 200: Oceania Market Value Share (%) and BPS Analysis by Fuel, 2023 to 2033

Figure 201: Oceania Market Y-o-Y Growth (%) Projections by Fuel, 2023 to 2033

Figure 202: Oceania Market Value (US$ million) Analysis by Capacity, 2018 to 2033

Figure 203: Oceania Market Volume (Unit) Analysis by Capacity, 2018 to 2033

Figure 204: Oceania Market Value Share (%) and BPS Analysis by Capacity, 2023 to 2033

Figure 205: Oceania Market Y-o-Y Growth (%) Projections by Capacity, 2023 to 2033

Figure 206: Oceania Market Attractiveness by Material, 2023 to 2033

Figure 207: Oceania Market Attractiveness by Shape, 2023 to 2033

Figure 208: Oceania Market Attractiveness by Fuel, 2023 to 2033

Figure 209: Oceania Market Attractiveness by Capacity, 2023 to 2033

Figure 210: Oceania Market Attractiveness by Country, 2023 to 2033

Figure 211: MEA Market Value (US$ million) by Material, 2023 to 2033

Figure 212: MEA Market Value (US$ million) by Shape, 2023 to 2033

Figure 213: MEA Market Value (US$ million) by Fuel, 2023 to 2033

Figure 214: MEA Market Value (US$ million) by Capacity, 2023 to 2033

Figure 215: MEA Market Value (US$ million) by Country, 2023 to 2033

Figure 216: MEA Market Value (US$ million) Analysis by Country, 2018 to 2033

Figure 217: MEA Market Volume (Unit) Analysis by Country, 2018 to 2033

Figure 218: MEA Market Value Share (%) and BPS Analysis by Country, 2023 to 2033

Figure 219: MEA Market Y-o-Y Growth (%) Projections by Country, 2023 to 2033

Figure 220: MEA Market Value (US$ million) Analysis by Material, 2018 to 2033

Figure 221: MEA Market Volume (Unit) Analysis by Material, 2018 to 2033

Figure 222: MEA Market Value Share (%) and BPS Analysis by Material, 2023 to 2033

Figure 223: MEA Market Y-o-Y Growth (%) Projections by Material, 2023 to 2033

Figure 224: MEA Market Value (US$ million) Analysis by Shape, 2018 to 2033

Figure 225: MEA Market Volume (Unit) Analysis by Shape, 2018 to 2033

Figure 226: MEA Market Value Share (%) and BPS Analysis by Shape, 2023 to 2033

Figure 227: MEA Market Y-o-Y Growth (%) Projections by Shape, 2023 to 2033

Figure 228: MEA Market Value (US$ million) Analysis by Fuel, 2018 to 2033

Figure 229: MEA Market Volume (Unit) Analysis by Fuel, 2018 to 2033

Figure 230: MEA Market Value Share (%) and BPS Analysis by Fuel, 2023 to 2033

Figure 231: MEA Market Y-o-Y Growth (%) Projections by Fuel, 2023 to 2033

Figure 232: MEA Market Value (US$ million) Analysis by Capacity, 2018 to 2033

Figure 233: MEA Market Volume (Unit) Analysis by Capacity, 2018 to 2033

Figure 234: MEA Market Value Share (%) and BPS Analysis by Capacity, 2023 to 2033

Figure 235: MEA Market Y-o-Y Growth (%) Projections by Capacity, 2023 to 2033

Figure 236: MEA Market Attractiveness by Material, 2023 to 2033

Figure 237: MEA Market Attractiveness by Shape, 2023 to 2033

Figure 238: MEA Market Attractiveness by Fuel, 2023 to 2033

Figure 239: MEA Market Attractiveness by Capacity, 2023 to 2033

Figure 240: MEA Market Attractiveness by Country, 2023 to 2033

Frequently Asked Questions

How much worth is the Commercial Tandoor Oven Market?

The commercial tandoor oven market worth is nearly USD 845.7 Million in 2023.

At what CAGR is the market expected to expand through 2033?

Commercial tandoor oven market revenue is likely to grow at 6.6% through 2033.

How was the performance of the Commercial Tandoor Oven in past Years?

Commercial tandoor oven sales increased a CAGR of 5.4% over the past half-decade.

What will be the Commercial Tandoor Oven Market worth in 2033?

The commercial tandoor oven market value to reach USD 1,602.4 Million in 2033.

Which are the top countries driving the Commercial Tandoor Oven demand?

The top countries driving the commercial tandoor oven demand are India, The USA, and Germany.

Explore Similar Insights

Future Market Insights

Commercial Tandoor Oven Market