Reports

- Global Locations -

Headquarters

Future Market Insights, Inc.

Christiana Corporate, 200
Continental Drive, Suite 401,
Newark, Delaware - 19713,
United States

T: +1-845-579-5705

Americas

Future Market Insights, Inc.

616 Corporate Way, Suite 2-9018,
Valley Cottage, NY 10989, United States

T: +1-347-918-3531

MEA

Future Market Insights

1602-6 Jumeirah Bay X2 Tower, Plot No: JLT-PH2-X2A,
Jumeirah Lakes Towers, Dubai,
United Arab Emirates

Europe

Future Market Insights

3rd Floor, 207 Regent Street,
W1B 3HH London
United Kingdom

T: + 44 (0) 20 8123 9659
D: +44 (0) 20 3287 4268

Asia Pacific

Future Market Insights

IndiaLand Global Tech Park, Unit UG-1, Behind Grand HighStreet, Phase 1, Hinjawadi, MH, Pune – 411057, India

Commercial Panini Machine Market Outlook (2023 to 2033)

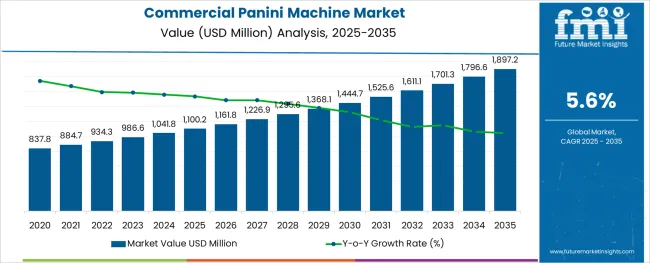
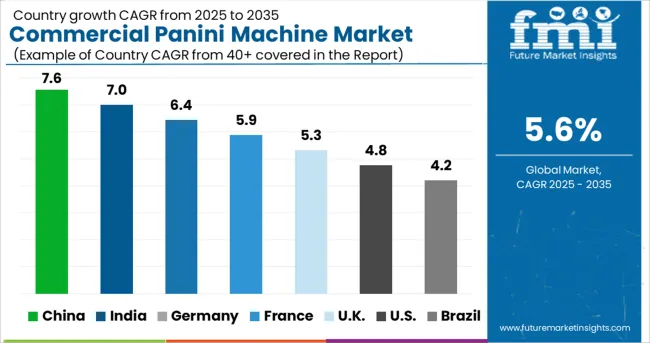
According to future market insights research, the commercial panini machine market is anticipated to grow at a CAGR of 5.6% while it is expected to increase from USD 986.6 million in 2023 to USD 1,701.2 million by 2033.

Attributes Details
Market Size Value in 2023 USD 986.6 million
Market Forecast Value in 2033 USD 1,701.2 million
Global Growth Rate (2023 to 2033) 5.6% CAGR
Forecast Period 2023-2033
Top 3 Countries market share of Commercial Panini Machine 35.6%

The food markets expanding as an effect of globalization, and people’s growing fascination with Italian food is creating opportunities for food business enthusiasts. Furthermore, food outlets that provide instant meals with different customization are in demand. This includes the advent of advanced technologies integrating with commercial panini machines.

Another factor that has fueled the sales of paninis is it being a healthy choice for lunch and dinner. New healthy blends of veggies and organic sauces have made it a tasty and healthy choice for food enthusiasts. Hence, its rising demand fuels the sales of commercial panini machines.

Panini is one of the biggest-selling food items on the street. Just hot dog in America, panini holds a special space in the south American street food market. With the rise of organized street food systems along with online food delivery options.

Don't pay for what you don't need

Customize your report by selecting specific countries or regions and save 30%!

Five Major Factors that Make a Panini Machine Better

Vendors try their best to produce advanced panini machines. There are certain factors that producers try to fulfill in order to prevent negative feedback. The producers have boosted the machines with high-tech options. Changes in consumer behavior along with advanced new kitchen instruments with a lot of features have pushed the vendors to adopt certain qualities.

  • Speed

Speed is one element that is important for the producing panini. The original feature exists to cook food as quickly as possible. The need for speed is still one of the most important drivers when choosing a panini press, even now when you can use it to get a perfectly cooked steak. So to choose the best panini press, the end users rapid heating time tests, relative maximum temperature tests, and the material used for the cooking plates. This affects the heating pattern closely.

  • Flexibility

The flexibility while shaping the panini along with producing cheese toasties. With different types of paninis, the sustainable and efficient panini press. The best panini press has a Premium, cutting-edge design and is more flexible because they combine different cooking processes in one appliance. For instance, the modern-day panini press combines a contact plate that applies infrared radiation, and a microwave cooking pattern to cook the panini.

  • Energy Consumption

The commercial panini maker is expected to have an efficient consumption model. The new panini machine is a high-energy user, linking it directly to the speed. Hence, the efficiency becomes directly proportional to the speed one wants to bake. The machine’s design also affects energy consumption; the small ones consume small units of energy.

  • Programs

The time-saving design of these panini makers comes with integrated chips that have pre-installed programs such as a timer, automatic switch off and on options along with the alert sounds and blinkers. . The best panini presses have a program for each and every dish and automatically switch off when the dish is ready.

  • Cleaning

The design of these new panini machines that integrates press configuration, ventilation filters, and cooking surfaces breaks the machines into different components that can be separated and cleaned separately. Otherwise, the panini machine cleaning will be less efficient and the appliance will underperform.

Commercial Panini Machine Market

Historical Outlook vs. Future Projections for Global Commercial Panini Machine Market

Historically, the Commercial Panini Machine market shows growth with a CAGR of 4.6% (2017 to 2022).

In recent years, the popularity of Panini sandwiches has grown exponentially in the United States. This can be attributed to the rise of casual dining and the trend toward healthy, artisanal foods. As a result, sales of commercial Panini machines have increased significantly.

Looking to the future, it is likely that the popularity of Panini sandwiches will continue to grow. This growth will be driven by continued demand for healthy and convenient foods.

For the Future projection of the commercial panini machine market, the value increased from USD 986.6 million in 2023 to USD 1,701.2 million in 2033. The CAGR (2023 to 2033) is estimated to be 5.6%.

Nandini Roy Choudhury

Principal Consultant

Talk to Analyst

Find your sweet spots for generating winning opportunities in this market.

Deep-dive into Growth Drivers Impacting Commercial Panini Machine Market

The higher penetration of the internet along with people wanting to try new cuisines is majorly flourishing the demand for commercial panini machines. FMI explains that the organized FMCG sector is flourishing and so does it expand its boundaries. People exploring the new food items in their feed that they want to try creates a consumer base for paninis in different parts of the world. Furthermore, the rising demand for food from online sources has made businesses open their cloud kitchen to serve different cuisines online. It takes a different set of machines to produce various cuisines. Therefore, fueling the sales of commercial panini machines.

Governments around the world supporting food businesses post-pandemic have also fueled them to adopt the latest gear to thrive in the production and expansion of the supply chain. Originally an Italian dish, the panini’s popularity among street food enthusiasts has no comparison, Therefore, the rising population is fueling the sales of panini machines globally. Research and development programs to increase the durability and processing of these machines have also helped the commercial panini machine market thrive.

Restraints

The lack of professional acquaintances along with the slow pace of acceptance of Italian cuisine are the major drivers that slow down the market’s pace. While other cuisines such as Indian and Chinese are a part of the mainstream food of many people from different strata of society.

Commercial Panini Machine Market :

Attributes Commercial Panini Machine Market
CAGR (2022 to 2032) 5.6%
Market Value (2026) US$ 1.16 billion
Growth Factor Increasing retail stores along with rising roadside food outlets around the world have fuelled the demand for commercial panini machines to enhance the panini-producing capacity.
Opportunity Advanced hydraulic press technology coupled with efficient energy consumption have led the market to multiple opportunities that are going to shape the market in the future.
Key Trends Companies have started launching programmed panini machines with high-speed cooking solutions that help the companies produce more and better.

Tray Sealing Machines:

Attributes Tray Sealing Machines
CAGR (2022 to 2032) 4.5%
Market Value (2026) US$ 3.94 billion
Growth Factor The concern over food safety and hygiene along with the proliferation of online food deliveries has led the companies to adopt tray sealing systems to pack PMCG products in safe packaging.
Opportunity The FMCG industry introducing a new set of sealing and packing solutions, providing vacuum and airtight sealing solutions is expected to fuel the sales of tray sealing machines.
Key Trends Government compliances including higher food hygiene index and regular inspections have fuelled the growth of the tray sealing machines market

Protective Packaging Market :

Attributes Protective Packaging Market
CAGR (2022-2032) 6.2%
Market Value (2026) US$ 44.85 billion
Growth Factor The protective packaging market’s growth is attributed to the easy-to-break and fragile products that can be harmed during storage and shipment.
Opportunity The market adds up to opportunities for the protective packaging market, changing the shipment dynamics of the markets.
Key Trends The growing consumer-based and fiber technology is creative field-specific protective packaging, shaping the trends for the market that create better protective packaging for the e-commerce cosmetics and pharmaceuticals goods.

Country Wise Insights

How North America Commercial Panini Machine Market is Shaping?

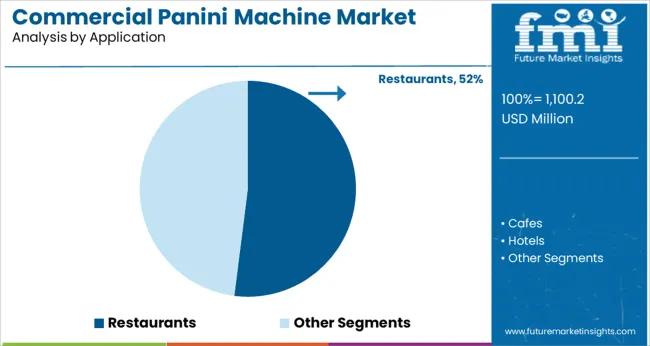
In recent years, the North American commercial Panini machine market has grown rapidly. This is due to the increasing popularity of Panini machines in restaurants and cafes. Commercial Panini machines offer a quick and easy way to make delicious sandwiches. They are also very versatile, allowing for a variety of different sandwich fillings.

The North American commercial Panini machine market is expected to continue growing in the coming years. This is due to the increasing demand from customers for quick and easy sandwich solutions. Additionally, the popularity of Panini machines is expected to continue to grow as they become more widely available.

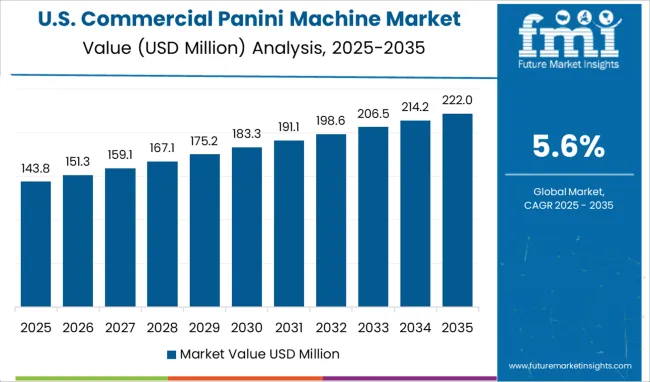
The USA contributes 68% of total North American revenue for the Commercial Panini Machine Market.

How Europe Commercial Panini Machine market is shaping?

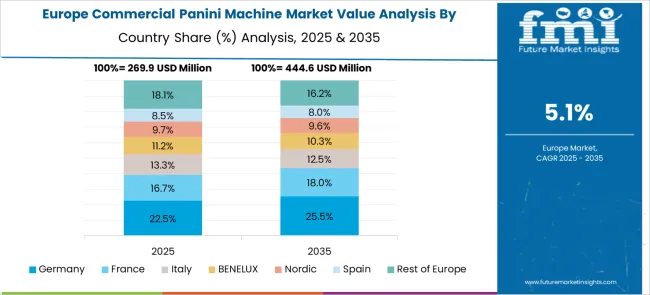
The European commercial Panini machine market is driven by the growing demand for convenient and healthy food options. The growing preference for on-the-go eating is also one of the key factors driving the market growth. Additionally, the increasing number of cafes and restaurants is also fuelling the demand for commercial Panini machines in Europe.

The United Kingdom accumulates 22% of the total European market share for the commercial panini machine market.

How Asia Pacific is growing in Commercial Panini Machine Market?

The Asia Pacific region is expected to be the fastest-growing market for commercial Panini machines during the forecast period. The main reason for this growth is the increasing demand for these machines from various end-use industries, such as food service, hospitality, and quick-service restaurants (QSRs).

China is leading the Asia Pacific market by contributing 32% of the total commercial panini machine market share of Asia Pacific.
Get the data you need at a Fraction of the cost

Personalize your report by choosing insights you need
and save 40%!

Category Wise Insights

What are the different types of contact grill Panini machines?

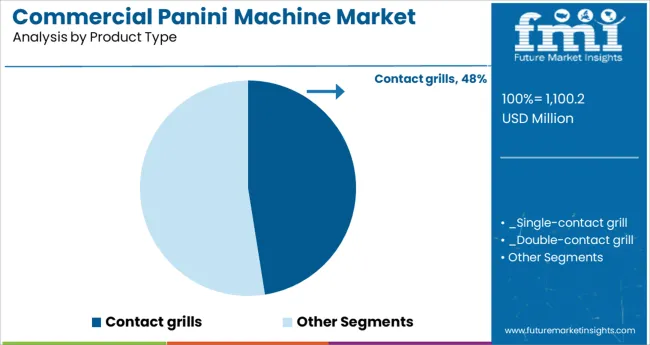
The contact grill is made of cast iron The SAVOYE electric grill is used to toast tiny sandwiches like focaccia, buns, blinis, wraps, and Swedish bread. For grilling meats like sliced steaks, this electric contact grill can also be utilized. The PANINI contact grill is used by the best Panini sandwich experts.

What distinguishes a griddle from a grill Panini?

While a Panini maker has two cooking plates, top and bottom, an electric griddle just has one. As a result, when using a Panini maker, you don't need to flip your meal because both the top and bottom sides cook simultaneously. Additionally, it implies a shorter cooking time. Therefore, it fuels the overall sales of the commercial panini machines market.
Competitive Landscape

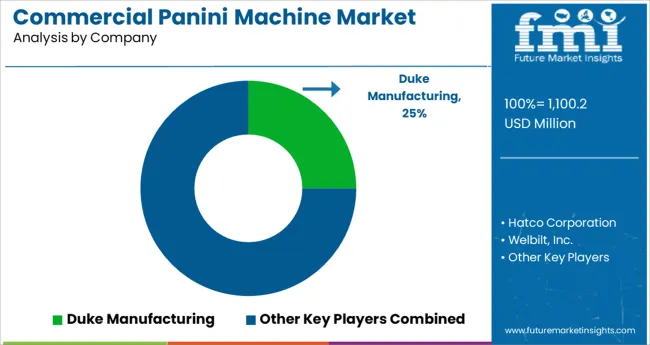
The increasing popularity of panini machines in the food service industry is one of the key factors driving the growth of the market. The growing demand for healthy and nutritious food options is another factor expected to boost the growth of the market.  The competitive landscape of the commercial Panini machine market is highly fragmented with many players. Key players in the market include Duke Manufacturing, Hatco Corporation, Welbilt, Inc., and Toastmasters, Inc.

Recent Market Developments      

  • Electrolux has launched its SpeeDelight high-speed panini press that limits energy consumption, advanced programs, and enhanced flexibility and speed. This is supposed to increase the competition in the market space.

Commercial Panini Machine Market Report Scope:

Attribute Details
Forecast Period 2023 to 2033
Historical Data Available for 2018 to 2022
Market Analysis USD million for Value and Units for Volume
Key Regions Covered
  • North America
  • Latin America
  • Europe
  • Asia Pacific
  • Middle East and Africa (MEA)
  • RoW
Key Countries Covered
  • USA
  • Germany
  • United Kingdom
  • France
  • Spain
  • Italy
  • Brazil
  • Argentina
  • China
  • India
  • Japan
  • UAE
  • Australia
  • New Zealand
Key Segments Covered
  • Product Type
  • Application
  • Sales Channel
  • Geography
Key Companies Profiled
  • Duke Manufacturing
  • Hatco Corporation
  • Welbilt, Inc.
  • Toastmaster, Inc.
  • Hamilton Beach
  • Villaware
  • Lodge
  • Cuisinart
  • Cuisinart
  • Oster
  • Breville
  • Warning
  • De’Longhi
Report Coverage DROT Analysis, Market Forecast, Company Share Analysis, Market Dynamics and Challenges, Competitive Landscape, and Strategic Growth Initiatives
Customization & Pricing Available upon Request

Segmentation of Commercial Panini Machine

Segmentation by Product Type:

  • Contact grills
  • Press grills
  • Open grills

Segmentation by Application:

  • Restaurants
  • Cafes
  • Hotels
  • Others

Segmentation by Sales Channel:

  • Online
  • Offline

Segmentation by Geography:

  • North America
  • Latin America
  • Europe
  • Asia Pacific
  • Middle East and Africa (MEA)
  • RoW

Frequently Asked Questions

What is the market size of Commercial Panini Machines Market?

The global commercial panini machine market will reach a valuation of USD 986.6 million by the end of 2023.

What is the USA Commercial Panini Machine Market Outlook?

The USA commercial panini machine market is contributing 68% of the North American market share which is valued at around USD 254.9 million.

Which are the major countries driving demand for Commercial Panini Machine Market?

USA, Canada, Mexico, Argentina, Brazil, Germany, United Kingdom, France, Italy, Spain, Russia, China, Japan, India, and Australia are the major countries driving demand for Commercial Panini Machine Market.

What is the United Kingdom Commercial Panini Machine Market Outlook?

The United Kingdom commercial panini machine market is contributing 22% of the European market share which is valued at USD 86.8 Mn. Who are the top 5 players operating in the market? • Duke Manufacturing • Hatco Corporation • Welbilt, Inc. • Toastmaster, Inc. • Hamilton Beach Above are the top 5 market players in the commercial panini machine industry.

What is the contribution of China in the Commercial Panini Machine market?

The Japan Commercial Panini Machine market contribution is 32% of the Asia Pacific market share and has a value of USD 56.8 million.

What is the demand outlook forecast for the Commercial Panini Machine market?

The global Commercial Panini Machine market is forecasted to surpass USD 1.16 billion by the end of 2026.

Table of Content

1. Executive Summary | Commercial Panini Machine Market

    1.1. Global Market Outlook

    1.2. Demand-side Trends

    1.3. Supply-side Trends

    1.4. Technology Roadmap Analysis

    1.5. Analysis and Recommendations

2. Market Overview

    2.1. Market Coverage / Taxonomy

    2.2. Market Definition / Scope / Limitations

3. Market Background

    3.1. Market Dynamics

        3.1.1. Drivers

        3.1.2. Restraints

        3.1.3. Opportunity

        3.1.4. Trends

    3.2. Scenario Forecast

        3.2.1. Demand in Optimistic Scenario

        3.2.2. Demand in Likely Scenario

        3.2.3. Demand in Conservative Scenario

    3.3. Product launches & Recent Developments

    3.4. Product Life Cycle Analysis

    3.5. Value Chain Analysis

        3.5.1. Supply Side Participants and their Roles

            3.5.1.1. Producers

            3.5.1.2. Mid-Level Participants (Traders/ Agents/ Brokers)

            3.5.1.3. Wholesalers and Distributors

        3.5.2. % of Operating Margin Analysis

        3.5.3. List of Raw Material Suppliers

        3.5.4. List of Existing and Potential Buyer’s

    3.6. Global Market - Pricing Analysis

        3.6.1. Price Point Assessment by Region

        3.6.2. Price Point Assessment by Product Type

        3.6.3. Price Forecast till 2033

        3.6.4. Factors affecting pricing

    3.7. Forecast Factors - Relevance & Impact

    3.8. PESTLE and Porter’s Analysis

    3.9. Regulatory Landscape

        3.9.1. Packaging & Labelling Regulations

        3.9.2. Certifications and Certifying Agency Overview

        3.9.3. Import/Export Policies

    3.10. Regional Parent Market Outlook

    3.11. Production and Consumption Statistics

    3.12. Import and Export Statistics

    3.13. Consumers Survey Analysis

    3.14. Macro-Economic Factors

    3.15. Product Claims & Nutritional Information Scan by Buyers

4. Global Market Analysis 2018 to 2022 and Forecast, 2023 to 2033

    4.1. Historical Market Size Value (US$ million) & Volume (MT) Analysis, 2018 to 2022

    4.2. Current and Future Market Size Value (US$ million) & Volume (MT) Projections, 2023 to 2033

        4.2.1. Y-o-Y Growth Trend Analysis

        4.2.2. Absolute $ Opportunity Analysis

5. Global Market Analysis 2018 to 2022 and Forecast 2023 to 2033, By Product Type

    5.1. Introduction / Key Findings

    5.2. Historical Market Size Value (US$ million) & Volume (MT) Analysis By Product Type, 2018 to 2022

    5.3. Current and Future Market Size Value (US$ million) & Volume (MT) Analysis and Forecast By Product Type, 2023 to 2033

        5.3.1. Contact grills

            5.3.1.1. Single-contact grill

            5.3.1.2. Double-contact grill

        5.3.2. Press grills

        5.3.3. Open grills

    5.4. Y-o-Y Growth Trend Analysis By Product Type, 2018 to 2022

    5.5. Absolute $ Opportunity Analysis By Product Type, 2023 to 2033

6. Global Market Analysis 2018 to 2022 and Forecast 2023 to 2033, By Application

    6.1. Introduction / Key Findings

    6.2. Historical Market Size Value (US$ million) & Volume (MT) Analysis By Application, 2018 to 2022

    6.3. Current and Future Market Size Value (US$ million) & Volume (MT) Analysis and Forecast By Application, 2023 to 2033

        6.3.1. Restaurants

        6.3.2. Cafes

        6.3.3. Hotels

    6.4. Y-o-Y Growth Trend Analysis By Application, 2018 to 2022

    6.5. Absolute $ Opportunity Analysis By Application, 2023 to 2033

7. Global Market Analysis 2018 to 2022 and Forecast 2023 to 2033, By Sales Channel

    7.1. Introduction / Key Findings

    7.2. Historical Market Size Value (US$ million) & Volume (MT) Analysis By Sales Channel, 2018 to 2022

    7.3. Current and Future Market Size Value (US$ million) & Volume (MT) Analysis and Forecast By Sales Channel, 2023 to 2033

        7.3.1. Online

        7.3.2. Offline

    7.4. Y-o-Y Growth Trend Analysis By Sales Channel, 2018 to 2022

    7.5. Absolute $ Opportunity Analysis By Sales Channel, 2023 to 2033

8. Global Market Analysis 2018 to 2022 and Forecast 2023 to 2033, By Region

    8.1. Introduction

    8.2. Historical Market Size Value (US$ million) & Volume (MT) Analysis By Region, 2018 to 2022

    8.3. Current Market Size Value (US$ million) & Volume (MT) Analysis and Forecast By Region, 2023 to 2033

        8.3.1. North America

        8.3.2. Latin America

        8.3.3. Europe

        8.3.4. East Asia

        8.3.5. South Asia

        8.3.6. Oceania

        8.3.7. MEA

    8.4. Market Attractiveness Analysis By Region

9. North America Market Analysis 2018 to 2022 and Forecast 2023 to 2033, By Country

    9.1. Historical Market Size Value (US$ million) & Volume (MT) Trend Analysis By Market Taxonomy, 2018 to 2022

    9.2. Market Size Value (US$ million) & Volume (MT) Forecast By Market Taxonomy, 2023 to 2033

        9.2.1. By Country

            9.2.1.1. USA

            9.2.1.2. Canada

        9.2.2. By Product Type

        9.2.3. By Application

        9.2.4. By Sales Channel

    9.3. Market Attractiveness Analysis

        9.3.1. By Country

        9.3.2. By Product Type

        9.3.3. By Application

        9.3.4. By Sales Channel

    9.4. Key Takeaways

10. Latin America Market Analysis 2018 to 2022 and Forecast 2023 to 2033, By Country

    10.1. Historical Market Size Value (US$ million) & Volume (MT) Trend Analysis By Market Taxonomy, 2018 to 2022

    10.2. Market Size Value (US$ million) & Volume (MT) Forecast By Market Taxonomy, 2023 to 2033

        10.2.1. By Country

            10.2.1.1. Brazil

            10.2.1.2. Mexico

            10.2.1.3. Argentina

            10.2.1.4. Chile

            10.2.1.5. Peru

            10.2.1.6. Rest of Latin America

        10.2.2. By Product Type

        10.2.3. By Application

        10.2.4. By Sales Channel

    10.3. Market Attractiveness Analysis

        10.3.1. By Country

        10.3.2. By Product Type

        10.3.3. By Application

        10.3.4. By Sales Channel

    10.4. Key Takeaways

11. Europe Market Analysis 2018 to 2022 and Forecast 2023 to 2033, By Country

    11.1. Historical Market Size Value (US$ million) & Volume (MT) Trend Analysis By Market Taxonomy, 2018 to 2022

    11.2. Market Size Value (US$ million) & Volume (MT) Forecast By Market Taxonomy, 2023 to 2033

        11.2.1. By Country

            11.2.1.1. Germany

            11.2.1.2. Italy

            11.2.1.3. France

            11.2.1.4. United Kingdom

            11.2.1.5. Spain

            11.2.1.6. Russia

            11.2.1.7. BENELUX

            11.2.1.8. Poland

            11.2.1.9. Nordic Countries

            11.2.1.10. Rest of Europe

        11.2.2. By Product Type

        11.2.3. By Application

        11.2.4. By Sales Channel

    11.3. Market Attractiveness Analysis

        11.3.1. By Country

        11.3.2. By Product Type

        11.3.3. By Application

        11.3.4. By Sales Channel

    11.4. Key Takeaways

12. East Asia Market Analysis 2018 to 2022 and Forecast 2023 to 2033, By Country

    12.1. Historical Market Size Value (US$ million) & Volume (MT) Trend Analysis By Market Taxonomy, 2018 to 2022

    12.2. Market Size Value (US$ million) & Volume (MT) Forecast By Market Taxonomy, 2023 to 2033

        12.2.1. By Country

            12.2.1.1. China

            12.2.1.2. Japan

            12.2.1.3. South Korea

        12.2.2. By Product Type

        12.2.3. By Application

        12.2.4. By Sales Channel

    12.3. Market Attractiveness Analysis

        12.3.1. By Country

        12.3.2. By Product Type

        12.3.3. By Application

        12.3.4. By Sales Channel

    12.4. Key Takeaways

13. South Asia Market Analysis 2018 to 2022 and Forecast 2023 to 2033, By Country

    13.1. Historical Market Size Value (US$ million) & Volume (MT) Trend Analysis By Market Taxonomy, 2018 to 2022

    13.2. Market Size Value (US$ million) & Volume (MT) Forecast By Market Taxonomy, 2023 to 2033

        13.2.1. By Country

            13.2.1.1. India

            13.2.1.2. Thailand

            13.2.1.3. Malaysia

            13.2.1.4. Indonesia

            13.2.1.5. Singapore

            13.2.1.6. Rest of South Asia

        13.2.2. By Product Type

        13.2.3. By Application

        13.2.4. By Sales Channel

    13.3. Market Attractiveness Analysis

        13.3.1. By Country

        13.3.2. By Product Type

        13.3.3. By Application

        13.3.4. By Sales Channel

    13.4. Key Takeaways

14. Oceania Market Analysis 2018 to 2022 and Forecast 2023 to 2033, By Country

    14.1. Historical Market Size Value (US$ million) & Volume (MT) Trend Analysis By Market Taxonomy, 2018 to 2022

    14.2. Market Size Value (US$ million) & Volume (MT) Forecast By Market Taxonomy, 2023 to 2033

        14.2.1. By Country

            14.2.1.1. Australia

            14.2.1.2. New Zealand

        14.2.2. By Product Type

        14.2.3. By Application

        14.2.4. By Sales Channel

    14.3. Market Attractiveness Analysis

        14.3.1. By Country

        14.3.2. By Product Type

        14.3.3. By Application

        14.3.4. By Sales Channel

    14.4. Key Takeaways

15. MEA Market Analysis 2018 to 2022 and Forecast 2023 to 2033, By Country

    15.1. Historical Market Size Value (US$ million) & Volume (MT) Trend Analysis By Market Taxonomy, 2018 to 2022

    15.2. Market Size Value (US$ million) & Volume (MT) Forecast By Market Taxonomy, 2023 to 2033

        15.2.1. By Country

            15.2.1.1. GCC Countries

            15.2.1.2. South Africa

            15.2.1.3. Central Africa

            15.2.1.4. North Africa

        15.2.2. By Product Type

        15.2.3. By Application

        15.2.4. By Sales Channel

    15.3. Market Attractiveness Analysis

        15.3.1. By Country

        15.3.2. By Product Type

        15.3.3. By Application

        15.3.4. By Sales Channel

    15.4. Key Takeaways

16. Key Countries Market Analysis

    16.1. The USA

        16.1.1. Pricing Analysis

        16.1.2. Market Share Analysis, 2022

            16.1.2.1. By Product Type

            16.1.2.2. By Application

            16.1.2.3. By Sales Channel

    16.2. Canada

        16.2.1. Pricing Analysis

        16.2.2. Market Share Analysis, 2022

            16.2.2.1. By Product Type

            16.2.2.2. By Application

            16.2.2.3. By Sales Channel

    16.3. Brazil

        16.3.1. Pricing Analysis

        16.3.2. Market Share Analysis, 2022

            16.3.2.1. By Product Type

            16.3.2.2. By Application

            16.3.2.3. By Sales Channel

    16.4. Mexico

        16.4.1. Pricing Analysis

        16.4.2. Market Share Analysis, 2022

            16.4.2.1. By Product Type

            16.4.2.2. By Application

            16.4.2.3. By Sales Channel

    16.5. Argentina

        16.5.1. Pricing Analysis

        16.5.2. Market Share Analysis, 2022

            16.5.2.1. By Product Type

            16.5.2.2. By Application

            16.5.2.3. By Sales Channel

    16.6. Chile

        16.6.1. Pricing Analysis

        16.6.2. Market Share Analysis, 2022

            16.6.2.1. By Product Type

            16.6.2.2. By Application

            16.6.2.3. By Sales Channel

    16.7. Peru

        16.7.1. Pricing Analysis

        16.7.2. Market Share Analysis, 2022

            16.7.2.1. By Product Type

            16.7.2.2. By Application

            16.7.2.3. By Sales Channel

    16.8. Germany

        16.8.1. Pricing Analysis

        16.8.2. Market Share Analysis, 2022

            16.8.2.1. By Product Type

            16.8.2.2. By Application

            16.8.2.3. By Sales Channel

    16.9. Italy

        16.9.1. Pricing Analysis

        16.9.2. Market Share Analysis, 2022

            16.9.2.1. By Product Type

            16.9.2.2. By Application

            16.9.2.3. By Sales Channel

    16.10. France

        16.10.1. Pricing Analysis

        16.10.2. Market Share Analysis, 2022

            16.10.2.1. By Product Type

            16.10.2.2. By Application

            16.10.2.3. By Sales Channel

    16.11. Spain

        16.11.1. Pricing Analysis

        16.11.2. Market Share Analysis, 2022

            16.11.2.1. By Product Type

            16.11.2.2. By Application

            16.11.2.3. By Sales Channel

    16.12. The United Kingdom

        16.12.1. Pricing Analysis

        16.12.2. Market Share Analysis, 2022

            16.12.2.1. By Product Type

            16.12.2.2. By Application

            16.12.2.3. By Sales Channel

    16.13. Russia

        16.13.1. Pricing Analysis

        16.13.2. Market Share Analysis, 2022

            16.13.2.1. By Product Type

            16.13.2.2. By Application

            16.13.2.3. By Sales Channel

    16.14. Poland

        16.14.1. Pricing Analysis

        16.14.2. Market Share Analysis, 2022

            16.14.2.1. By Product Type

            16.14.2.2. By Application

            16.14.2.3. By Sales Channel

    16.15. BENELUX

        16.15.1. Pricing Analysis

        16.15.2. Market Share Analysis, 2022

            16.15.2.1. By Product Type

            16.15.2.2. By Application

            16.15.2.3. By Sales Channel

    16.16. Nordic Countries

        16.16.1. Pricing Analysis

        16.16.2. Market Share Analysis, 2022

            16.16.2.1. By Product Type

            16.16.2.2. By Application

            16.16.2.3. By Sales Channel

    16.17. China

        16.17.1. Pricing Analysis

        16.17.2. Market Share Analysis, 2022

            16.17.2.1. By Product Type

            16.17.2.2. By Application

            16.17.2.3. By Sales Channel

    16.18. Japan

        16.18.1. Pricing Analysis

        16.18.2. Market Share Analysis, 2022

            16.18.2.1. By Product Type

            16.18.2.2. By Application

            16.18.2.3. By Sales Channel

    16.19. South Korea

        16.19.1. Pricing Analysis

        16.19.2. Market Share Analysis, 2022

            16.19.2.1. By Product Type

            16.19.2.2. By Application

            16.19.2.3. By Sales Channel

    16.20. India

        16.20.1. Pricing Analysis

        16.20.2. Market Share Analysis, 2022

            16.20.2.1. By Product Type

            16.20.2.2. By Application

            16.20.2.3. By Sales Channel

    16.21. Thailand

        16.21.1. Pricing Analysis

        16.21.2. Market Share Analysis, 2022

            16.21.2.1. By Product Type

            16.21.2.2. By Application

            16.21.2.3. By Sales Channel

    16.22. Indonesia

        16.22.1. Pricing Analysis

        16.22.2. Market Share Analysis, 2022

            16.22.2.1. By Product Type

            16.22.2.2. By Application

            16.22.2.3. By Sales Channel

    16.23. Malaysia

        16.23.1. Pricing Analysis

        16.23.2. Market Share Analysis, 2022

            16.23.2.1. By Product Type

            16.23.2.2. By Application

            16.23.2.3. By Sales Channel

    16.24. Singapore

        16.24.1. Pricing Analysis

        16.24.2. Market Share Analysis, 2022

            16.24.2.1. By Product Type

            16.24.2.2. By Application

            16.24.2.3. By Sales Channel

    16.25. Australia

        16.25.1. Pricing Analysis

        16.25.2. Market Share Analysis, 2022

            16.25.2.1. By Product Type

            16.25.2.2. By Application

            16.25.2.3. By Sales Channel

    16.26. New Zealand

        16.26.1. Pricing Analysis

        16.26.2. Market Share Analysis, 2022

            16.26.2.1. By Product Type

            16.26.2.2. By Application

            16.26.2.3. By Sales Channel

    16.27. GCC Countries

        16.27.1. Pricing Analysis

        16.27.2. Market Share Analysis, 2022

            16.27.2.1. By Product Type

            16.27.2.2. By Application

            16.27.2.3. By Sales Channel

    16.28. South Africa

        16.28.1. Pricing Analysis

        16.28.2. Market Share Analysis, 2022

            16.28.2.1. By Product Type

            16.28.2.2. By Application

            16.28.2.3. By Sales Channel

    16.29. North Africa

        16.29.1. Pricing Analysis

        16.29.2. Market Share Analysis, 2022

            16.29.2.1. By Product Type

            16.29.2.2. By Application

            16.29.2.3. By Sales Channel

    16.30. Central Africa

        16.30.1. Pricing Analysis

        16.30.2. Market Share Analysis, 2022

            16.30.2.1. By Product Type

            16.30.2.2. By Application

            16.30.2.3. By Sales Channel

17. Market Structure Analysis

    17.1. Competition Dashboard

    17.2. Competition Benchmarking

    17.3. Market Share Analysis of Top Players

        17.3.1. By Regional

        17.3.2. By Product Type

        17.3.3. By Application

        17.3.4. By Sales Channel

18. Competition Analysis

    18.1. Competition Deep Dive

        18.1.1. Duke Manufacturing

            18.1.1.1. Overview

            18.1.1.2. Product Portfolio

            18.1.1.3. Profitability by Market Segments (Product Type /Application/Sales Channel/Region)

            18.1.1.4. Sales Footprint

            18.1.1.5. Strategy Overview

                18.1.1.5.1. Marketing Strategy

                18.1.1.5.2. Product Strategy

                18.1.1.5.3. Channel Strategy

        18.1.2. Hatco Corporation

            18.1.2.1. Overview

            18.1.2.2. Product Portfolio

            18.1.2.3. Profitability by Market Segments (Product Type /Application/Sales Channel/Region)

            18.1.2.4. Sales Footprint

            18.1.2.5. Strategy Overview

                18.1.2.5.1. Marketing Strategy

                18.1.2.5.2. Product Strategy

                18.1.2.5.3. Channel Strategy

        18.1.3. Welbilt, Inc.

            18.1.3.1. Overview

            18.1.3.2. Product Portfolio

            18.1.3.3. Profitability by Market Segments (Product Type /Application/Sales Channel/Region)

            18.1.3.4. Sales Footprint

            18.1.3.5. Strategy Overview

                18.1.3.5.1. Marketing Strategy

                18.1.3.5.2. Product Strategy

                18.1.3.5.3. Channel Strategy

        18.1.4. Toastmaster, Inc.

            18.1.4.1. Overview

            18.1.4.2. Product Portfolio

            18.1.4.3. Profitability by Market Segments (Product Type /Application/Sales Channel/Region)

            18.1.4.4. Sales Footprint

            18.1.4.5. Strategy Overview

                18.1.4.5.1. Marketing Strategy

                18.1.4.5.2. Product Strategy

                18.1.4.5.3. Channel Strategy

        18.1.5. Hamilton Beach

            18.1.5.1. Overview

            18.1.5.2. Product Portfolio

            18.1.5.3. Profitability by Market Segments (Product Type /Application/Sales Channel/Region)

            18.1.5.4. Sales Footprint

            18.1.5.5. Strategy Overview

                18.1.5.5.1. Marketing Strategy

                18.1.5.5.2. Product Strategy

                18.1.5.5.3. Channel Strategy

        18.1.6. Villaware

            18.1.6.1. Overview

            18.1.6.2. Product Portfolio

            18.1.6.3. Profitability by Market Segments (Product Type /Application/Sales Channel/Region)

            18.1.6.4. Sales Footprint

            18.1.6.5. Strategy Overview

                18.1.6.5.1. Marketing Strategy

                18.1.6.5.2. Product Strategy

                18.1.6.5.3. Channel Strategy

        18.1.7. Lodge

            18.1.7.1. Overview

            18.1.7.2. Product Portfolio

            18.1.7.3. Profitability by Market Segments (Product Type /Application/Sales Channel/Region)

            18.1.7.4. Sales Footprint

            18.1.7.5. Strategy Overview

                18.1.7.5.1. Marketing Strategy

                18.1.7.5.2. Product Strategy

                18.1.7.5.3. Channel Strategy

        18.1.8. Cuisinart

            18.1.8.1. Overview

            18.1.8.2. Product Portfolio

            18.1.8.3. Profitability by Market Segments (Product Type /Application/Sales Channel/Region)

            18.1.8.4. Sales Footprint

            18.1.8.5. Strategy Overview

                18.1.8.5.1. Marketing Strategy

                18.1.8.5.2. Product Strategy

                18.1.8.5.3. Channel Strategy

        18.1.9. Cuisinart

            18.1.9.1. Overview

            18.1.9.2. Product Portfolio

            18.1.9.3. Profitability by Market Segments (Product Type /Application/Sales Channel/Region)

            18.1.9.4. Sales Footprint

            18.1.9.5. Strategy Overview

                18.1.9.5.1. Marketing Strategy

                18.1.9.5.2. Product Strategy

                18.1.9.5.3. Channel Strategy

        18.1.10. Oster

            18.1.10.1. Overview

            18.1.10.2. Product Portfolio

            18.1.10.3. Profitability by Market Segments (Product Type /Application/Sales Channel/Region)

            18.1.10.4. Sales Footprint

            18.1.10.5. Strategy Overview

                18.1.10.5.1. Marketing Strategy

                18.1.10.5.2. Product Strategy

                18.1.10.5.3. Channel Strategy

        18.1.11. Breville

            18.1.11.1. Overview

            18.1.11.2. Product Portfolio

            18.1.11.3. Profitability by Market Segments (Product Type /Application/Sales Channel/Region)

            18.1.11.4. Sales Footprint

            18.1.11.5. Strategy Overview

                18.1.11.5.1. Marketing Strategy

                18.1.11.5.2. Product Strategy

                18.1.11.5.3. Channel Strategy

        18.1.12. Waring

            18.1.12.1. Overview

            18.1.12.2. Product Portfolio

            18.1.12.3. Profitability by Market Segments (Product Type /Application/Sales Channel/Region)

            18.1.12.4. Sales Footprint

            18.1.12.5. Strategy Overview

                18.1.12.5.1. Marketing Strategy

                18.1.12.5.2. Product Strategy

                18.1.12.5.3. Channel Strategy

        18.1.13. De’Longhi

            18.1.13.1. Overview

            18.1.13.2. Product Portfolio

            18.1.13.3. Profitability by Market Segments (Product Type /Application/Sales Channel/Region)

            18.1.13.4. Sales Footprint

            18.1.13.5. Strategy Overview

                18.1.13.5.1. Marketing Strategy

                18.1.13.5.2. Product Strategy

                18.1.13.5.3. Channel Strategy

19. Assumptions & Acronyms Used

20. Research Methodology

Don't pay for what you don't need

Customize your report by selecting specific countries or regions and save 30%!

List of Tables

Table 1: Global Market Value (US$ million) Forecast by Region, 2018 to 2033

Table 2: Global Market Volume (MT) Forecast by Region, 2018 to 2033

Table 3: Global Market Value (US$ million) Forecast by Product Type, 2018 to 2033

Table 4: Global Market Volume (MT) Forecast by Product Type, 2018 to 2033

Table 5: Global Market Value (US$ million) Forecast by Application, 2018 to 2033

Table 6: Global Market Volume (MT) Forecast by Application, 2018 to 2033

Table 7: Global Market Value (US$ million) Forecast by Sales Channel, 2018 to 2033

Table 8: Global Market Volume (MT) Forecast by Sales Channel, 2018 to 2033

Table 9: North America Market Value (US$ million) Forecast by Country, 2018 to 2033

Table 10: North America Market Volume (MT) Forecast by Country, 2018 to 2033

Table 11: North America Market Value (US$ million) Forecast by Product Type, 2018 to 2033

Table 12: North America Market Volume (MT) Forecast by Product Type, 2018 to 2033

Table 13: North America Market Value (US$ million) Forecast by Application, 2018 to 2033

Table 14: North America Market Volume (MT) Forecast by Application, 2018 to 2033

Table 15: North America Market Value (US$ million) Forecast by Sales Channel, 2018 to 2033

Table 16: North America Market Volume (MT) Forecast by Sales Channel, 2018 to 2033

Table 17: Latin America Market Value (US$ million) Forecast by Country, 2018 to 2033

Table 18: Latin America Market Volume (MT) Forecast by Country, 2018 to 2033

Table 19: Latin America Market Value (US$ million) Forecast by Product Type, 2018 to 2033

Table 20: Latin America Market Volume (MT) Forecast by Product Type, 2018 to 2033

Table 21: Latin America Market Value (US$ million) Forecast by Application, 2018 to 2033

Table 22: Latin America Market Volume (MT) Forecast by Application, 2018 to 2033

Table 23: Latin America Market Value (US$ million) Forecast by Sales Channel, 2018 to 2033

Table 24: Latin America Market Volume (MT) Forecast by Sales Channel, 2018 to 2033

Table 25: Europe Market Value (US$ million) Forecast by Country, 2018 to 2033

Table 26: Europe Market Volume (MT) Forecast by Country, 2018 to 2033

Table 27: Europe Market Value (US$ million) Forecast by Product Type, 2018 to 2033

Table 28: Europe Market Volume (MT) Forecast by Product Type, 2018 to 2033

Table 29: Europe Market Value (US$ million) Forecast by Application, 2018 to 2033

Table 30: Europe Market Volume (MT) Forecast by Application, 2018 to 2033

Table 31: Europe Market Value (US$ million) Forecast by Sales Channel, 2018 to 2033

Table 32: Europe Market Volume (MT) Forecast by Sales Channel, 2018 to 2033

Table 33: East Asia Market Value (US$ million) Forecast by Country, 2018 to 2033

Table 34: East Asia Market Volume (MT) Forecast by Country, 2018 to 2033

Table 35: East Asia Market Value (US$ million) Forecast by Product Type, 2018 to 2033

Table 36: East Asia Market Volume (MT) Forecast by Product Type, 2018 to 2033

Table 37: East Asia Market Value (US$ million) Forecast by Application, 2018 to 2033

Table 38: East Asia Market Volume (MT) Forecast by Application, 2018 to 2033

Table 39: East Asia Market Value (US$ million) Forecast by Sales Channel, 2018 to 2033

Table 40: East Asia Market Volume (MT) Forecast by Sales Channel, 2018 to 2033

Table 41: South Asia Market Value (US$ million) Forecast by Country, 2018 to 2033

Table 42: South Asia Market Volume (MT) Forecast by Country, 2018 to 2033

Table 43: South Asia Market Value (US$ million) Forecast by Product Type, 2018 to 2033

Table 44: South Asia Market Volume (MT) Forecast by Product Type, 2018 to 2033

Table 45: South Asia Market Value (US$ million) Forecast by Application, 2018 to 2033

Table 46: South Asia Market Volume (MT) Forecast by Application, 2018 to 2033

Table 47: South Asia Market Value (US$ million) Forecast by Sales Channel, 2018 to 2033

Table 48: South Asia Market Volume (MT) Forecast by Sales Channel, 2018 to 2033

Table 49: Oceania Market Value (US$ million) Forecast by Country, 2018 to 2033

Table 50: Oceania Market Volume (MT) Forecast by Country, 2018 to 2033

Table 51: Oceania Market Value (US$ million) Forecast by Product Type, 2018 to 2033

Table 52: Oceania Market Volume (MT) Forecast by Product Type, 2018 to 2033

Table 53: Oceania Market Value (US$ million) Forecast by Application, 2018 to 2033

Table 54: Oceania Market Volume (MT) Forecast by Application, 2018 to 2033

Table 55: Oceania Market Value (US$ million) Forecast by Sales Channel, 2018 to 2033

Table 56: Oceania Market Volume (MT) Forecast by Sales Channel, 2018 to 2033

Table 57: MEA Market Value (US$ million) Forecast by Country, 2018 to 2033

Table 58: MEA Market Volume (MT) Forecast by Country, 2018 to 2033

Table 59: MEA Market Value (US$ million) Forecast by Product Type, 2018 to 2033

Table 60: MEA Market Volume (MT) Forecast by Product Type, 2018 to 2033

Table 61: MEA Market Value (US$ million) Forecast by Application, 2018 to 2033

Table 62: MEA Market Volume (MT) Forecast by Application, 2018 to 2033

Table 63: MEA Market Value (US$ million) Forecast by Sales Channel, 2018 to 2033

Table 64: MEA Market Volume (MT) Forecast by Sales Channel, 2018 to 2033
Nandini Roy Choudhury

Principal Consultant

Talk to Analyst

Find your sweet spots for generating winning opportunities in this market.

List of Charts

Figure 1: Global Market Value (US$ million) by Product Type, 2023 to 2033

Figure 2: Global Market Value (US$ million) by Application, 2023 to 2033

Figure 3: Global Market Value (US$ million) by Sales Channel, 2023 to 2033

Figure 4: Global Market Value (US$ million) by Region, 2023 to 2033

Figure 5: Global Market Value (US$ million) Analysis by Region, 2018 to 2033

Figure 6: Global Market Volume (MT) Analysis by Region, 2018 to 2033

Figure 7: Global Market Value Share (%) and BPS Analysis by Region, 2023 to 2033

Figure 8: Global Market Y-o-Y Growth (%) Projections by Region, 2023 to 2033

Figure 9: Global Market Value (US$ million) Analysis by Product Type, 2018 to 2033

Figure 10: Global Market Volume (MT) Analysis by Product Type, 2018 to 2033

Figure 11: Global Market Value Share (%) and BPS Analysis by Product Type, 2023 to 2033

Figure 12: Global Market Y-o-Y Growth (%) Projections by Product Type, 2023 to 2033

Figure 13: Global Market Value (US$ million) Analysis by Application, 2018 to 2033

Figure 14: Global Market Volume (MT) Analysis by Application, 2018 to 2033

Figure 15: Global Market Value Share (%) and BPS Analysis by Application, 2023 to 2033

Figure 16: Global Market Y-o-Y Growth (%) Projections by Application, 2023 to 2033

Figure 17: Global Market Value (US$ million) Analysis by Sales Channel, 2018 to 2033

Figure 18: Global Market Volume (MT) Analysis by Sales Channel, 2018 to 2033

Figure 19: Global Market Value Share (%) and BPS Analysis by Sales Channel, 2023 to 2033

Figure 20: Global Market Y-o-Y Growth (%) Projections by Sales Channel, 2023 to 2033

Figure 21: Global Market Attractiveness by Product Type, 2023 to 2033

Figure 22: Global Market Attractiveness by Application, 2023 to 2033

Figure 23: Global Market Attractiveness by Sales Channel, 2023 to 2033

Figure 24: Global Market Attractiveness by Region, 2023 to 2033

Figure 25: North America Market Value (US$ million) by Product Type, 2023 to 2033

Figure 26: North America Market Value (US$ million) by Application, 2023 to 2033

Figure 27: North America Market Value (US$ million) by Sales Channel, 2023 to 2033

Figure 28: North America Market Value (US$ million) by Country, 2023 to 2033

Figure 29: North America Market Value (US$ million) Analysis by Country, 2018 to 2033

Figure 30: North America Market Volume (MT) Analysis by Country, 2018 to 2033

Figure 31: North America Market Value Share (%) and BPS Analysis by Country, 2023 to 2033

Figure 32: North America Market Y-o-Y Growth (%) Projections by Country, 2023 to 2033

Figure 33: North America Market Value (US$ million) Analysis by Product Type, 2018 to 2033

Figure 34: North America Market Volume (MT) Analysis by Product Type, 2018 to 2033

Figure 35: North America Market Value Share (%) and BPS Analysis by Product Type, 2023 to 2033

Figure 36: North America Market Y-o-Y Growth (%) Projections by Product Type, 2023 to 2033

Figure 37: North America Market Value (US$ million) Analysis by Application, 2018 to 2033

Figure 38: North America Market Volume (MT) Analysis by Application, 2018 to 2033

Figure 39: North America Market Value Share (%) and BPS Analysis by Application, 2023 to 2033

Figure 40: North America Market Y-o-Y Growth (%) Projections by Application, 2023 to 2033

Figure 41: North America Market Value (US$ million) Analysis by Sales Channel, 2018 to 2033

Figure 42: North America Market Volume (MT) Analysis by Sales Channel, 2018 to 2033

Figure 43: North America Market Value Share (%) and BPS Analysis by Sales Channel, 2023 to 2033

Figure 44: North America Market Y-o-Y Growth (%) Projections by Sales Channel, 2023 to 2033

Figure 45: North America Market Attractiveness by Product Type, 2023 to 2033

Figure 46: North America Market Attractiveness by Application, 2023 to 2033

Figure 47: North America Market Attractiveness by Sales Channel, 2023 to 2033

Figure 48: North America Market Attractiveness by Country, 2023 to 2033

Figure 49: Latin America Market Value (US$ million) by Product Type, 2023 to 2033

Figure 50: Latin America Market Value (US$ million) by Application, 2023 to 2033

Figure 51: Latin America Market Value (US$ million) by Sales Channel, 2023 to 2033

Figure 52: Latin America Market Value (US$ million) by Country, 2023 to 2033

Figure 53: Latin America Market Value (US$ million) Analysis by Country, 2018 to 2033

Figure 54: Latin America Market Volume (MT) Analysis by Country, 2018 to 2033

Figure 55: Latin America Market Value Share (%) and BPS Analysis by Country, 2023 to 2033

Figure 56: Latin America Market Y-o-Y Growth (%) Projections by Country, 2023 to 2033

Figure 57: Latin America Market Value (US$ million) Analysis by Product Type, 2018 to 2033

Figure 58: Latin America Market Volume (MT) Analysis by Product Type, 2018 to 2033

Figure 59: Latin America Market Value Share (%) and BPS Analysis by Product Type, 2023 to 2033

Figure 60: Latin America Market Y-o-Y Growth (%) Projections by Product Type, 2023 to 2033

Figure 61: Latin America Market Value (US$ million) Analysis by Application, 2018 to 2033

Figure 62: Latin America Market Volume (MT) Analysis by Application, 2018 to 2033

Figure 63: Latin America Market Value Share (%) and BPS Analysis by Application, 2023 to 2033

Figure 64: Latin America Market Y-o-Y Growth (%) Projections by Application, 2023 to 2033

Figure 65: Latin America Market Value (US$ million) Analysis by Sales Channel, 2018 to 2033

Figure 66: Latin America Market Volume (MT) Analysis by Sales Channel, 2018 to 2033

Figure 67: Latin America Market Value Share (%) and BPS Analysis by Sales Channel, 2023 to 2033

Figure 68: Latin America Market Y-o-Y Growth (%) Projections by Sales Channel, 2023 to 2033

Figure 69: Latin America Market Attractiveness by Product Type, 2023 to 2033

Figure 70: Latin America Market Attractiveness by Application, 2023 to 2033

Figure 71: Latin America Market Attractiveness by Sales Channel, 2023 to 2033

Figure 72: Latin America Market Attractiveness by Country, 2023 to 2033

Figure 73: Europe Market Value (US$ million) by Product Type, 2023 to 2033

Figure 74: Europe Market Value (US$ million) by Application, 2023 to 2033

Figure 75: Europe Market Value (US$ million) by Sales Channel, 2023 to 2033

Figure 76: Europe Market Value (US$ million) by Country, 2023 to 2033

Figure 77: Europe Market Value (US$ million) Analysis by Country, 2018 to 2033

Figure 78: Europe Market Volume (MT) Analysis by Country, 2018 to 2033

Figure 79: Europe Market Value Share (%) and BPS Analysis by Country, 2023 to 2033

Figure 80: Europe Market Y-o-Y Growth (%) Projections by Country, 2023 to 2033

Figure 81: Europe Market Value (US$ million) Analysis by Product Type, 2018 to 2033

Figure 82: Europe Market Volume (MT) Analysis by Product Type, 2018 to 2033

Figure 83: Europe Market Value Share (%) and BPS Analysis by Product Type, 2023 to 2033

Figure 84: Europe Market Y-o-Y Growth (%) Projections by Product Type, 2023 to 2033

Figure 85: Europe Market Value (US$ million) Analysis by Application, 2018 to 2033

Figure 86: Europe Market Volume (MT) Analysis by Application, 2018 to 2033

Figure 87: Europe Market Value Share (%) and BPS Analysis by Application, 2023 to 2033

Figure 88: Europe Market Y-o-Y Growth (%) Projections by Application, 2023 to 2033

Figure 89: Europe Market Value (US$ million) Analysis by Sales Channel, 2018 to 2033

Figure 90: Europe Market Volume (MT) Analysis by Sales Channel, 2018 to 2033

Figure 91: Europe Market Value Share (%) and BPS Analysis by Sales Channel, 2023 to 2033

Figure 92: Europe Market Y-o-Y Growth (%) Projections by Sales Channel, 2023 to 2033

Figure 93: Europe Market Attractiveness by Product Type, 2023 to 2033

Figure 94: Europe Market Attractiveness by Application, 2023 to 2033

Figure 95: Europe Market Attractiveness by Sales Channel, 2023 to 2033

Figure 96: Europe Market Attractiveness by Country, 2023 to 2033

Figure 97: East Asia Market Value (US$ million) by Product Type, 2023 to 2033

Figure 98: East Asia Market Value (US$ million) by Application, 2023 to 2033

Figure 99: East Asia Market Value (US$ million) by Sales Channel, 2023 to 2033

Figure 100: East Asia Market Value (US$ million) by Country, 2023 to 2033

Figure 101: East Asia Market Value (US$ million) Analysis by Country, 2018 to 2033

Figure 102: East Asia Market Volume (MT) Analysis by Country, 2018 to 2033

Figure 103: East Asia Market Value Share (%) and BPS Analysis by Country, 2023 to 2033

Figure 104: East Asia Market Y-o-Y Growth (%) Projections by Country, 2023 to 2033

Figure 105: East Asia Market Value (US$ million) Analysis by Product Type, 2018 to 2033

Figure 106: East Asia Market Volume (MT) Analysis by Product Type, 2018 to 2033

Figure 107: East Asia Market Value Share (%) and BPS Analysis by Product Type, 2023 to 2033

Figure 108: East Asia Market Y-o-Y Growth (%) Projections by Product Type, 2023 to 2033

Figure 109: East Asia Market Value (US$ million) Analysis by Application, 2018 to 2033

Figure 110: East Asia Market Volume (MT) Analysis by Application, 2018 to 2033

Figure 111: East Asia Market Value Share (%) and BPS Analysis by Application, 2023 to 2033

Figure 112: East Asia Market Y-o-Y Growth (%) Projections by Application, 2023 to 2033

Figure 113: East Asia Market Value (US$ million) Analysis by Sales Channel, 2018 to 2033

Figure 114: East Asia Market Volume (MT) Analysis by Sales Channel, 2018 to 2033

Figure 115: East Asia Market Value Share (%) and BPS Analysis by Sales Channel, 2023 to 2033

Figure 116: East Asia Market Y-o-Y Growth (%) Projections by Sales Channel, 2023 to 2033

Figure 117: East Asia Market Attractiveness by Product Type, 2023 to 2033

Figure 118: East Asia Market Attractiveness by Application, 2023 to 2033

Figure 119: East Asia Market Attractiveness by Sales Channel, 2023 to 2033

Figure 120: East Asia Market Attractiveness by Country, 2023 to 2033

Figure 121: South Asia Market Value (US$ million) by Product Type, 2023 to 2033

Figure 122: South Asia Market Value (US$ million) by Application, 2023 to 2033

Figure 123: South Asia Market Value (US$ million) by Sales Channel, 2023 to 2033

Figure 124: South Asia Market Value (US$ million) by Country, 2023 to 2033

Figure 125: South Asia Market Value (US$ million) Analysis by Country, 2018 to 2033

Figure 126: South Asia Market Volume (MT) Analysis by Country, 2018 to 2033

Figure 127: South Asia Market Value Share (%) and BPS Analysis by Country, 2023 to 2033

Figure 128: South Asia Market Y-o-Y Growth (%) Projections by Country, 2023 to 2033

Figure 129: South Asia Market Value (US$ million) Analysis by Product Type, 2018 to 2033

Figure 130: South Asia Market Volume (MT) Analysis by Product Type, 2018 to 2033

Figure 131: South Asia Market Value Share (%) and BPS Analysis by Product Type, 2023 to 2033

Figure 132: South Asia Market Y-o-Y Growth (%) Projections by Product Type, 2023 to 2033

Figure 133: South Asia Market Value (US$ million) Analysis by Application, 2018 to 2033

Figure 134: South Asia Market Volume (MT) Analysis by Application, 2018 to 2033

Figure 135: South Asia Market Value Share (%) and BPS Analysis by Application, 2023 to 2033

Figure 136: South Asia Market Y-o-Y Growth (%) Projections by Application, 2023 to 2033

Figure 137: South Asia Market Value (US$ million) Analysis by Sales Channel, 2018 to 2033

Figure 138: South Asia Market Volume (MT) Analysis by Sales Channel, 2018 to 2033

Figure 139: South Asia Market Value Share (%) and BPS Analysis by Sales Channel, 2023 to 2033

Figure 140: South Asia Market Y-o-Y Growth (%) Projections by Sales Channel, 2023 to 2033

Figure 141: South Asia Market Attractiveness by Product Type, 2023 to 2033

Figure 142: South Asia Market Attractiveness by Application, 2023 to 2033

Figure 143: South Asia Market Attractiveness by Sales Channel, 2023 to 2033

Figure 144: South Asia Market Attractiveness by Country, 2023 to 2033

Figure 145: Oceania Market Value (US$ million) by Product Type, 2023 to 2033

Figure 146: Oceania Market Value (US$ million) by Application, 2023 to 2033

Figure 147: Oceania Market Value (US$ million) by Sales Channel, 2023 to 2033

Figure 148: Oceania Market Value (US$ million) by Country, 2023 to 2033

Figure 149: Oceania Market Value (US$ million) Analysis by Country, 2018 to 2033

Figure 150: Oceania Market Volume (MT) Analysis by Country, 2018 to 2033

Figure 151: Oceania Market Value Share (%) and BPS Analysis by Country, 2023 to 2033

Figure 152: Oceania Market Y-o-Y Growth (%) Projections by Country, 2023 to 2033

Figure 153: Oceania Market Value (US$ million) Analysis by Product Type, 2018 to 2033

Figure 154: Oceania Market Volume (MT) Analysis by Product Type, 2018 to 2033

Figure 155: Oceania Market Value Share (%) and BPS Analysis by Product Type, 2023 to 2033

Figure 156: Oceania Market Y-o-Y Growth (%) Projections by Product Type, 2023 to 2033

Figure 157: Oceania Market Value (US$ million) Analysis by Application, 2018 to 2033

Figure 158: Oceania Market Volume (MT) Analysis by Application, 2018 to 2033

Figure 159: Oceania Market Value Share (%) and BPS Analysis by Application, 2023 to 2033

Figure 160: Oceania Market Y-o-Y Growth (%) Projections by Application, 2023 to 2033

Figure 161: Oceania Market Value (US$ million) Analysis by Sales Channel, 2018 to 2033

Figure 162: Oceania Market Volume (MT) Analysis by Sales Channel, 2018 to 2033

Figure 163: Oceania Market Value Share (%) and BPS Analysis by Sales Channel, 2023 to 2033

Figure 164: Oceania Market Y-o-Y Growth (%) Projections by Sales Channel, 2023 to 2033

Figure 165: Oceania Market Attractiveness by Product Type, 2023 to 2033

Figure 166: Oceania Market Attractiveness by Application, 2023 to 2033

Figure 167: Oceania Market Attractiveness by Sales Channel, 2023 to 2033

Figure 168: Oceania Market Attractiveness by Country, 2023 to 2033

Figure 169: MEA Market Value (US$ million) by Product Type, 2023 to 2033

Figure 170: MEA Market Value (US$ million) by Application, 2023 to 2033

Figure 171: MEA Market Value (US$ million) by Sales Channel, 2023 to 2033

Figure 172: MEA Market Value (US$ million) by Country, 2023 to 2033

Figure 173: MEA Market Value (US$ million) Analysis by Country, 2018 to 2033

Figure 174: MEA Market Volume (MT) Analysis by Country, 2018 to 2033

Figure 175: MEA Market Value Share (%) and BPS Analysis by Country, 2023 to 2033

Figure 176: MEA Market Y-o-Y Growth (%) Projections by Country, 2023 to 2033

Figure 177: MEA Market Value (US$ million) Analysis by Product Type, 2018 to 2033

Figure 178: MEA Market Volume (MT) Analysis by Product Type, 2018 to 2033

Figure 179: MEA Market Value Share (%) and BPS Analysis by Product Type, 2023 to 2033

Figure 180: MEA Market Y-o-Y Growth (%) Projections by Product Type, 2023 to 2033

Figure 181: MEA Market Value (US$ million) Analysis by Application, 2018 to 2033

Figure 182: MEA Market Volume (MT) Analysis by Application, 2018 to 2033

Figure 183: MEA Market Value Share (%) and BPS Analysis by Application, 2023 to 2033

Figure 184: MEA Market Y-o-Y Growth (%) Projections by Application, 2023 to 2033

Figure 185: MEA Market Value (US$ million) Analysis by Sales Channel, 2018 to 2033

Figure 186: MEA Market Volume (MT) Analysis by Sales Channel, 2018 to 2033

Figure 187: MEA Market Value Share (%) and BPS Analysis by Sales Channel, 2023 to 2033

Figure 188: MEA Market Y-o-Y Growth (%) Projections by Sales Channel, 2023 to 2033

Figure 189: MEA Market Attractiveness by Product Type, 2023 to 2033

Figure 190: MEA Market Attractiveness by Application, 2023 to 2033

Figure 191: MEA Market Attractiveness by Sales Channel, 2023 to 2033

Figure 192: MEA Market Attractiveness by Country, 2023-20

Explore Process Automation Insights

View Reports

Commercial Panini Machine Market