Reports

- Global Locations -

Headquarters

Future Market Insights, Inc.

Christiana Corporate, 200
Continental Drive, Suite 401,
Newark, Delaware - 19713,
United States

T: +1-347-918-3531

Americas

Future Market Insights, Inc.

616 Corporate Way, Suite 2-9018,
Valley Cottage, NY 10989, United States

MEA

Future Market Insights

1602-6 Jumeirah Bay X2 Tower, Plot No: JLT-PH2-X2A,
Jumeirah Lakes Towers, Dubai,
United Arab Emirates

Europe

Future Market Insights

3rd Floor, 207 Regent Street,
W1B 3HH London
United Kingdom

T: + 44 (0) 20 8123 9659

Asia Pacific

Future Market Insights

IndiaLand Global Tech Park, Unit UG-1, Behind Grand HighStreet, Phase 1, Hinjawadi, MH, Pune – 411057, India

A Summary of the Commercial Wine Dispenser Market Development (2023 to 2033)

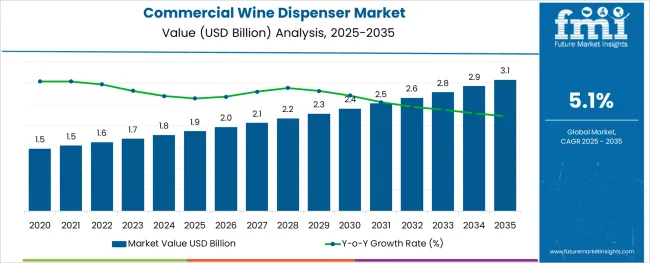
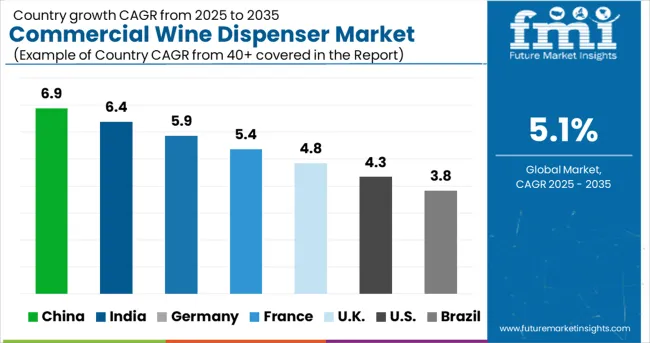
The global commercial wine dispenser market is projected to have an average-paced CAGR of 5.1% during the forecast period. The current valuation of the market is US$ 1,689.3 million in 2023. The market value of the commercial wine dispenser market is anticipated to reach a high of US$ 2,778.0 million by the year 2033. A historical market valuation of US$ 1,607.33 million has been recorded by the experts of Future Market Insights for the concerned market during the base year. This growth is supported by:

  • Increased urbanization comes with changing norms like a rise in disposable income in developing regions and development in demographics is estimated to influence the consumption habits amidst the populace.
  • Rising awareness amongst the urban populace regarding the health benefits of wine which include reduction of weight, maintenance of blood pressure, and prevention of coronary artery diseases is fueling the consumption of red wine, which is thereby impacting the sales of commercial wine dispensers.
  • The surge in the number of restaurant chains, brewpubs, cafes, and bars is fostering the demand for wine, which in turn is accruing large market shares of commercial wine dispensers across developing economies.
  • The commercial wine dispensers help in delivering wines accurately as the setup allows the bars to serve wine to their consumers in a cost-effective and efficient manner.
  • The commercial wine dispensers are equipped with advanced technologies like touch-screen configuration and more that allow the bartenders and waiters to input the desired drink with appropriate volumes. These conveniences offered by commercial wine dispensers are likely to stir up the market dynamics for commercial wine dispensers in the forthcoming years.
  • The growth of the beverage sector is also identified to fuel the market size of commercial wine dispensers.

Although the market is witnessing healthy growth, it has been estimated by expert analysts at FMI that certain aspects are likely to curb the growth of the forum in the upcoming years. The key restraints identified in the market are:

  • There is intense competition from substitute products that pose a threat and act as a major deterring element in the growth of the commercial wine dispenser market.
  • The high cost associated with the initial installation of the commercial wine dispensers and the maintenance charges for the equipment is estimated to impede the adoption of the product through the forecast period.
Report Attribute Details
Commercial Wine Dispenser Market Value (2023) US$ 1,689.3 million
Commercial Wine Dispenser Market Anticipated Value (2033) US$ 2,778.0 million
Commercial Wine Dispenser Market Projected Growth Rate (2023 to 2033) 5.1%

Don't pay for what you don't need

Customize your report by selecting specific countries or regions and save 30%!

Deep-dive into Growth Drivers Impacting Commercial Wine Dispenser Market

As per the analysis of Future Market Insights, people across the globe are spending more on food and recreational activities, owing to their rise in earnings across developing economies. The surge in consumer income has led to an increase in annual away-from-home expenditures such as convenience food, fast food, alcoholic beverages, non-alcoholic beverages, and more. These aspects are also raising the consumption of wine with dining-out facilities, thereby propelling the growth of the commercial wine dispenser market.

Commercial Wine Dispenser Market

A Peek into the Historical Market Scenario

After analyzing the market in-depth, the experts of FMI have unveiled that the commercial wine dispenser market has been witnessing an unprecedented surge in the past few years. There is an approximate rise of US$ 81.97 million surge in the total market value from 2022 to 2023. The market during the period 2018 to 2022 registered a CAGR of 4.5%.

The growth of the market can be attributed to the fact that commercial wine dispensers are getting equipped with advanced technologies that are making the job easier for bars, fine-dining restaurants, and other commercial food outlets to serve wine to their customers. The commercial wine dispensers are fitted with self-cleaning technologies, that allow the machine the clean itself automatically after a specified amount of drink or a number of glasses has been dispensed. There is a diverse range of products that include home wine dispenser, boxed wine dispenser, smart wine dispenser, and more.

It has been analyzed by experts that FMI that with the advancement of technology and the desire to reduce dependency, several automatic devices have been installed that allows users to instruct the machine to dispense the drink on their own. The commercial wine dispensers are long-lasting and may be utilized during occasions. Additionally, health awareness amongst the population owing to the consumption of red wine is a key factor bolstering the adoption of commercial wine dispensers through 2023.

Nandini Roy Choudhury

Principal Consultant

Talk to Analyst

Find your sweet spots for generating winning opportunities in this market.

Comparative Analysis of Adjacent Markets

Commercial Wine Dispenser Market:

Differentiating Aspects Commercial Wine Dispenser Market
CAGR 5.1%
Market Valuation in 2023 US$ 1,689.3 Million
Projected Market Value in 2033 US$ 2,778.0 Million
Drivers
  • A rise in discretionary income and the surge in spending for premium drinks by the urban populace are expected to drive market growth.
  • Growth number of pubs, bars, and restaurant chains to fuel growth.

Beverage Dispenser Market:

Differentiating Aspects Beverage Dispenser Market
CAGR 8.29%
Market Valuation in 2023 US$ 17,151 Million
Projected Market Value in 2033 US$ 25,540.61 Million
Drivers
  • The Proliferation of fast-food restaurants across developing regions demands the consumption of beverages, thus boosting the market growth for the product.
  • The invention of different convenient technologies is expected to influence the market size of beverage dispensers in the forthcoming years.

Sparkling Water Dispenser Market:

Differentiating Aspects Sparkling Water Dispenser Market
CAGR 3.4%
Market Valuation in 2023 US$ 136.6 Million
Projected Market Value in 2033 US$ 190.10 Million
Drivers
  • Sparkling water dispensers are rising in popularity and usage in hospitals as it helps patients in retaining hydration levels.
  • Rising awareness about the need for maintaining the minimum hydration level fuels the adoption of sparkling water dispensers across various end-use industries.

Category-wise Insights

Identifying How the Domineering Segments Upkeep with the Evolving Trends

Semi-Automatic Wine Dispenser - By Type

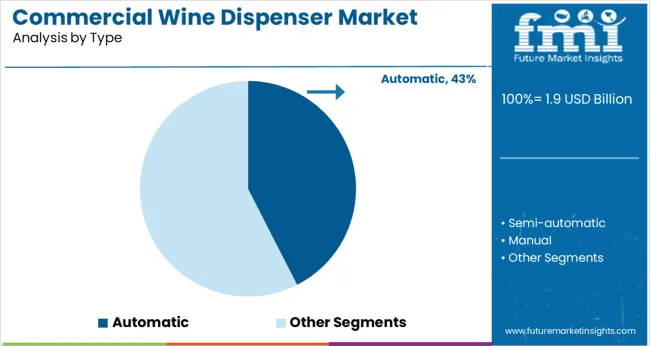
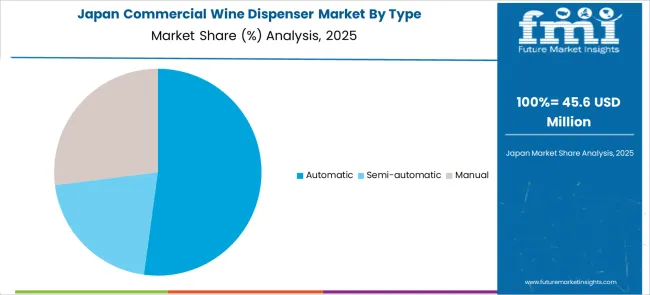
It has been analyzed by the experts at FMI that the semi-automatic commercial wine dispensers are likely to gain the most prominent during the forecast period. As per the data collected in the study, the semi-automatic segment accounted for the largest market share during the base year. It registered a CAGR of 8.57% in the year 2022. The factors attributing to the rising market shares for semi-automatic dispensers are as follows:

  • These wine dispensers do not come with a pre-set time for drinks, it allows the operators to control the process and the amount of beverage supplied.
  • It makes allowance for the customers to customize their drinks, coupled with cost-effectiveness as a major element driving the demand for semi-automatic commercial wine dispensers.

Restaurants & Bars - By End-use

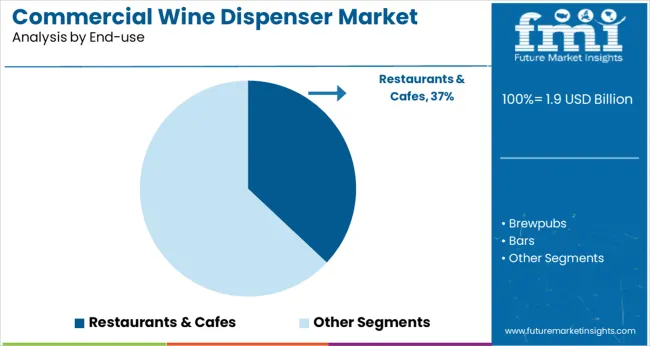
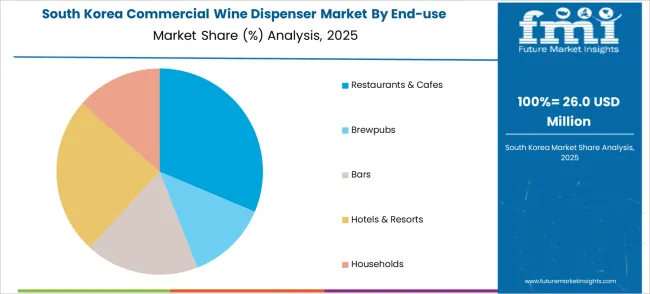
The increasing trend of dining out amongst the urban and millennial populace is expanding the market share of restaurant chains across the globe. The commercial sector is in tandem with the changing preferences of consumers. The restaurants and bars accounted for the maximum shares and are witnessed to progress at a considerable pace, registering a CAGR of 8.71% through the forecast period. The factors responsible for the propulsion of this segment are:
  • With the surge in the trend of consuming convenience food and to upkeep with the evolving schedules, a large section of the population is eating out, and their meals are coupled with the consumption of wine, thereby fueling the usage of commercial wine dispensers across this segment.
  • Discretionary income is making allowance for the urban populace to increase their spending on drinks and other unwinding activities like visiting pubs, and more, which is leading to a large number of restaurant chains across developing economies.

Get the data you need at a Fraction of the cost

Personalize your report by choosing insights you need
and save 40%!

Country-wise Insights

Regional Markets Adopt New Technologies to Revamp the Market Landscape for Commercial Wine Dispensers

Country/Region United States
Statistics

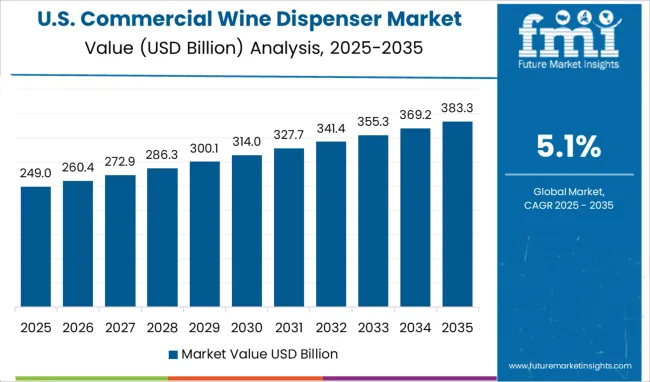
North America is projected to dominate the commercial wine dispenser market through the forecast period, advancing at a CAGR of 8.62% through 2033.

the United States has emerged as the dominating country, followed by Canada in the concerned region.

Growth Propellants

The factors responsible for the growth of the USA commercial wine dispenser market are:

  • Growing awareness regarding the health benefits imparted by wine amongst the populace.
  • Intense promotional campaigns done by various brands are expected p drive the growth of the wine industry, thereby, fueling the expansion of the commercial wine dispenser market.
Country/Region Europe
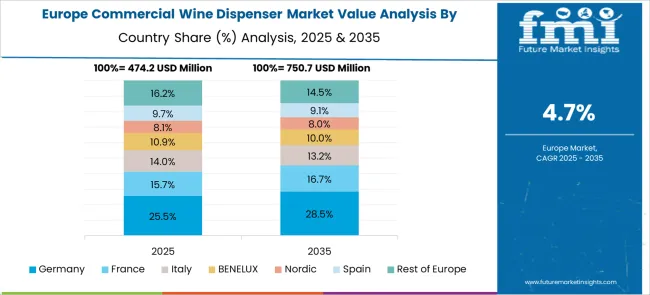
Statistics The European commercial wine dispenser market is anticipated to register staggering growth over the forecast period. The wine market in Europe is projected to advance at a moderate-paced CAGR of 7.6% through the estimated study period.
Growth Propellants

The growth in Europe is supported by:

  • A rise in awareness about the medicinal properties of wine that relieves symptoms of depression, pain, and stress is influencing the working population to go out and grab a glass of drink, which is increasing the sale of commercial wine dispensers.
  • An increased number of restaurant chains across the European region are installing commercial wine dispensers, resulting in the expansion of market size for the same.
Country/Region Japan
Statistics Japan is projected to dominate the Asia Pacific commercial wine dispenser market. The Asia Pacific wine market is expected to witness significant growth by the end of 2033, recording a CAGR of 8.5% throughout the forecast period, affecting the adoption of wine dispensers.
Growth Propellants

The aspects contributing to the growth of the market are:

  • The rise in power-conserving and technologically modern equipment that is easing the job for commercial outlets is a key reason propelling the market size of commercial wine dispensers in Japan.
  • Women in Japan consider wine as a healthy beverage that helps in the attainment of glass skin. Therefore, rising disposable income is influencing them to consume more wine, simultaneously affecting the market growth.
Country/Region Korea
Statistics As per the industry data, Korea has the most attractive market for wine, with 51.7 million consumers and a high-spending middle class.
In the base year, the sale of wine accounted for nearly 4.6% of the total alcoholic beverage sale in Korea. The market valuation is estimated to surpass US$ 3,650.73 Million by the end of 2033.
Growth Propellants

The factors responsible for the growth of the commercial wine dispenser market in Korea are:

  • Government initiatives and support to the wine manufacturing company to bring new and innovative flavors to the market.
  • Korea is one of the most lucrative markets for wine import and export, raising consumption, and boosting the demand for wine dispensers across the Korean food chains.

Start-up Ecosystem

New Entrants Cede a Silver Lining to the Commercial Wine Dispenser Market

The new entrants in the commercial wine dispenser market are leveraging advancements in technology to launch new products and gain a competitive advantage. These firms are continually investing in research and development activities to keep themselves in tandem with the changing consumer preferences and end-use industry demands. Efforts are being made to strengthen their foothold in the forum and aid the further progression of the cider brewing equipment market.

Top Start-ups to Watch for

Albi has recently launched its Albi Home M+ in its commercial wine dispenser family. It is an eco-conscious smart wine dispenser with an AI-powered energy saver, which can now optimize energy consumption b recognizing the best time to be activated by itself. There are three different cooling modes to optimize consumption and an automatic vacuum function to prevent oxidation and ensure longer preservation of wine.

Wineemotion has launched its exclusive range of wine dispensers that are designed in a way to preserve the wine for up to 30 days, transforming the waste into profits. It has a unique ISOl-PLUS system that keeps the aromas and fragrances intact of the wine.
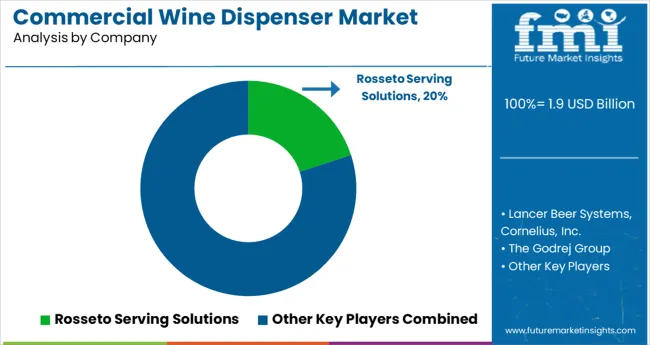
Competitive Landscape         

Key Market Players and their Attempts to Revolutionize the Market

This statistical study conducted by Future Market Insights of the concerned equipment market encompasses successful business strategies deployed by the key vendors for wine dispensing. The commercial wine dispenser market is fragmented and the vendors are deploying organic and inorganic growth strategies to compete in the market.

The manufacturers are heavily investing in research and development activities to make technological advances in the machinery for giving better quality wine to the consumers that are loaded with antioxidants and other health-beneficial properties that regulate the heart rate, metabolism, and others. The key manufacturers of the commercial wine dispenser market are entering into strategic collaborations and partnerships to further strengthen their foothold in the market.

Elanpro has designed its new wine dispenser for improved services. The product is designed to chill, dispense, and preserve a dazzling array of red and white wines making wine by the glass a profitable reality. An integral part of a profitable wine-by-the-glass program is to reduce waste, and over-pouring, and to increase convenience for maximum return on investment.

The state-of-art wine for you adds a new level of wine storage complementing functionality and style to every professional set-up. The product is available in 4-12 bottle options considering a restaurateur’s current needs and future aspirations. The new wine dispenser from Elanpro uses nitrogen to displace incoming air to avoid any change in flavor or color.

Plum is another company that has recently launched its automatic server and wine keeper. This is the first commercial wine dispenser to automatically preserve, chill, and serve any bottle, by the glass.

Recent Developments

  • Manitowoc introduces the new Indigo NXT model IT0300
  • In 2022, Celli Group has announced that it has finalized an agreement with Cornelius Beverage Technologies Ltd. for the acquisition of a package of wine dispensing products and accessories in the United Kingdom, Germany, and other European countries.
  • In February 2019, Macro Beverage Systems announced the introduction of FRIIA which is a sparkling water dispenser.

Some of the key players in the market are:

  • Rosseto Serving Solutions
  • Lancer Beer Systems, Cornelius, Inc.
  • The Godrej Group
  • Berg Company, LLC
  • Edward Don & Company
  • Pilot (Changzhou) Electronic Co., Ltd.
  • Manitowoc Foodservice Companies, Inc.
  • Frozen Beverage Dispensers
  • Follett LLC.

Key Segments in the Commercial Wine Dispenser Market

By Type:

  • Semi-automatic
  • Automatic
  • Manual

By End-use:

  • Brewpubs
  • Bars
  • Restaurants & Cafes
  • Hotels & Resorts
  • Households

By Region:

  • North America
  • Latin America
  • Asia Pacific
  • Middle East and Africa (MEA)
  • Europe

Frequently Asked Questions

What is the Growth Outlook for the Commercial Wine Dispenser Market?

The growth outlook for the commercial wine dispenser market is predicted to advance at a CAGR of 5.1% from 2023 to 2033.

Which Region Leads the Commercial Wine Dispenser Market?

The North American region is anticipated to lead the commercial wine dispenser market during the forecast period.

What is the market valuation of Commercial Wine Dispensers in 2023?

The market valuation of the commercial wine dispenser market stands at US$ 1,689.3 million in 2023.

How much Growth Potential does the Commercial Wine Dispenser hold?

The commercial wine dispenser market is likely to hold a valuation of US$ 2,778.0 million by 2033.

Which sector is the key driver in the Commercial Wine Dispenser Market?

The food & beverage sector is the key driver in the commercial wine dispenser market.

Table of Content

1. Executive Summary | Commercial Wine Dispenser Market

    1.1. Global Market Outlook

    1.2. Demand-side Trends

    1.3. Supply-side Trends

    1.4. Technology Roadmap Analysis

    1.5. Analysis and Recommendations

2. Market Overview

    2.1. Market Coverage / Taxonomy

    2.2. Market Definition / Scope / Limitations

3. Market Background

    3.1. Market Dynamics

        3.1.1. Drivers

        3.1.2. Restraints

        3.1.3. Opportunity

        3.1.4. Trends

    3.2. Scenario Forecast

        3.2.1. Demand in Optimistic Scenario

        3.2.2. Demand in Likely Scenario

        3.2.3. Demand in Conservative Scenario

    3.3. Product launches & Recent Developments

    3.4. Product Life Cycle Analysis

    3.5. Value Chain Analysis

        3.5.1. Supply Side Participants and their Roles

            3.5.1.1. Producers

            3.5.1.2. Mid-Level Participants (Traders/ Agents/ Brokers)

            3.5.1.3. Wholesalers and Distributors

        3.5.2. % of Operating Margin Analysis

        3.5.3. List of Raw Material Suppliers

        3.5.4. List of Existing and Potential Buyer’s

    3.6. Global Market - Pricing Analysis

        3.6.1. Price Point Assessment by Region

        3.6.2. Price Point Assessment by Product Type

        3.6.3. Price Forecast till 2032

        3.6.4. Factors affecting pricing

    3.7. Forecast Factors - Relevance & Impact

    3.8. PESTLE and Porter’s Analysis

    3.9. Regulatory Landscape

        3.9.1. Packaging & Labelling Regulations

        3.9.2. Certifications and Certifying Agency Overview

        3.9.3. Import/Export Policies

    3.10. Regional Parent Market Outlook

    3.11. Production and Consumption Statistics

    3.12. Import and Export Statistics

    3.13. Consumers Survey Analysis

    3.14. Macro-Economic Factors

    3.15. Product Claims & Nutritional Information Scan by Buyers

4. Global Analysis 2018 to 2022 and Forecast, 2023 to 2033

    4.1. Historical Market Size Value (US$ million) & Volume (MT) Analysis, 2018 to 2022

    4.2. Current and Future Market Size Value (US$ million) & Volume (MT) Projections, 2023 to 2033

        4.2.1. Y-o-Y Growth Trend Analysis

        4.2.2. Absolute $ Opportunity Analysis

5. Global Analysis 2018 to 2022 and Forecast 2023 to 2033, By Type

    5.1. Introduction / Key Findings

    5.2. Historical Market Size Value (US$ million) & Volume (MT) Analysis By Type, 2018 to 2022

    5.3. Current and Future Market Size Value (US$ million) & Volume (MT) Analysis and Forecast By Type, 2023 to 2033

        5.3.1. Red wine dispensers

        5.3.2. White wine dispensers

        5.3.3. Rose wine dispensers

    5.4. Y-o-Y Growth Trend Analysis By Type, 2018 to 2022

    5.5. Absolute $ Opportunity Analysis By Type, 2023 to 2033

6. Global Analysis 2018 to 2022 and Forecast 2023 to 2033, By Application

    6.1. Introduction / Key Findings

    6.2. Historical Market Size Value (US$ million) & Volume (MT) Analysis By Application, 2018 to 2022

    6.3. Current and Future Market Size Value (US$ million) & Volume (MT) Analysis and Forecast By Application, 2023 to 2033

        6.3.1. Bars & nightclubs

        6.3.2. Restaurants & cafes

        6.3.3. Hotels & resorts

        6.3.4. Households

    6.4. Y-o-Y Growth Trend Analysis By Application, 2018 to 2022

    6.5. Absolute $ Opportunity Analysis By Application, 2023 to 2033

7. Global Analysis 2018 to 2022 and Forecast 2023 to 2033, By Region

    7.1. Introduction

    7.2. Historical Market Size Value (US$ million) & Volume (MT) Analysis By Region, 2018 to 2022

    7.3. Current Market Size Value (US$ million) & Volume (MT) Analysis and Forecast By Region, 2023 to 2033

        7.3.1. North America

        7.3.2. Latin America

        7.3.3. Europe

        7.3.4. East Asia

        7.3.5. South Asia

        7.3.6. Oceania

        7.3.7. Middle East and Africa (MEA)

    7.4. Market Attractiveness Analysis By Region

8. North America Analysis 2018 to 2022 and Forecast 2023 to 2033, By Country

    8.1. Historical Market Size Value (US$ million) & Volume (MT) Trend Analysis By Market Taxonomy, 2018 to 2022

    8.2. Market Size Value (US$ million) & Volume (MT) Forecast By Market Taxonomy, 2023 to 2033

        8.2.1. By Country

            8.2.1.1. USA

            8.2.1.2. Canada

        8.2.2. By Type

        8.2.3. By Application

    8.3. Market Attractiveness Analysis

        8.3.1. By Country

        8.3.2. By Type

        8.3.3. By Application

    8.4. Key Takeaways

9. Latin America Analysis 2018 to 2022 and Forecast 2023 to 2033, By Country

    9.1. Historical Market Size Value (US$ million) & Volume (MT) Trend Analysis By Market Taxonomy, 2018 to 2022

    9.2. Market Size Value (US$ million) & Volume (MT) Forecast By Market Taxonomy, 2023 to 2033

        9.2.1. By Country

            9.2.1.1. Brazil

            9.2.1.2. Mexico

            9.2.1.3. Argentina

            9.2.1.4. Chile

            9.2.1.5. Peru

            9.2.1.6. Rest of Latin America

        9.2.2. By Type

        9.2.3. By Application

    9.3. Market Attractiveness Analysis

        9.3.1. By Country

        9.3.2. By Type

        9.3.3. By Application

    9.4. Key Takeaways

10. Europe Analysis 2018 to 2022 and Forecast 2023 to 2033, By Country

    10.1. Historical Market Size Value (US$ million) & Volume (MT) Trend Analysis By Market Taxonomy, 2018 to 2022

    10.2. Market Size Value (US$ million) & Volume (MT) Forecast By Market Taxonomy, 2023 to 2033

        10.2.1. By Country

            10.2.1.1. Germany

            10.2.1.2. Italy

            10.2.1.3. France

            10.2.1.4. United Kingdom

            10.2.1.5. Spain

            10.2.1.6. Russia

            10.2.1.7. BENELUX

            10.2.1.8. Poland

            10.2.1.9. Nordic Countries

            10.2.1.10. Rest of Europe

        10.2.2. By Type

        10.2.3. By Application

    10.3. Market Attractiveness Analysis

        10.3.1. By Country

        10.3.2. By Type

        10.3.3. By Application

    10.4. Key Takeaways

11. East Asia Analysis 2018 to 2022 and Forecast 2023 to 2033, By Country

    11.1. Historical Market Size Value (US$ million) & Volume (MT) Trend Analysis By Market Taxonomy, 2018 to 2022

    11.2. Market Size Value (US$ million) & Volume (MT) Forecast By Market Taxonomy, 2023 to 2033

        11.2.1. By Country

            11.2.1.1. China

            11.2.1.2. Japan

            11.2.1.3. South Korea

        11.2.2. By Type

        11.2.3. By Application

    11.3. Market Attractiveness Analysis

        11.3.1. By Country

        11.3.2. By Type

        11.3.3. By Application

    11.4. Key Takeaways

12. South Asia Analysis 2018 to 2022 and Forecast 2023 to 2033, By Country

    12.1. Historical Market Size Value (US$ million) & Volume (MT) Trend Analysis By Market Taxonomy, 2018 to 2022

    12.2. Market Size Value (US$ million) & Volume (MT) Forecast By Market Taxonomy, 2023 to 2033

        12.2.1. By Country

            12.2.1.1. India

            12.2.1.2. Thailand

            12.2.1.3. Malaysia

            12.2.1.4. Indonesia

            12.2.1.5. Singapore

            12.2.1.6. Rest of South Asia

        12.2.2. By Type

        12.2.3. By Application

    12.3. Market Attractiveness Analysis

        12.3.1. By Country

        12.3.2. By Type

        12.3.3. By Application

    12.4. Key Takeaways

13. Oceania Analysis 2018 to 2022 and Forecast 2023 to 2033, By Country

    13.1. Historical Market Size Value (US$ million) & Volume (MT) Trend Analysis By Market Taxonomy, 2018 to 2022

    13.2. Market Size Value (US$ million) & Volume (MT) Forecast By Market Taxonomy, 2023 to 2033

        13.2.1. By Country

            13.2.1.1. Australia

            13.2.1.2. New Zealand

        13.2.2. By Type

        13.2.3. By Application

    13.3. Market Attractiveness Analysis

        13.3.1. By Country

        13.3.2. By Type

        13.3.3. By Application

    13.4. Key Takeaways

14. MEA Analysis 2018 to 2022 and Forecast 2023 to 2033, By Country

    14.1. Historical Market Size Value (US$ million) & Volume (MT) Trend Analysis By Market Taxonomy, 2018 to 2022

    14.2. Market Size Value (US$ million) & Volume (MT) Forecast By Market Taxonomy, 2023 to 2033

        14.2.1. By Country

            14.2.1.1. GCC Countries

            14.2.1.2. South Africa

            14.2.1.3. Central Africa

            14.2.1.4. North Africa

        14.2.2. By Type

        14.2.3. By Application

    14.3. Market Attractiveness Analysis

        14.3.1. By Country

        14.3.2. By Type

        14.3.3. By Application

    14.4. Key Takeaways

15. Key Countries Analysis

    15.1. The USA

        15.1.1. Pricing Analysis

        15.1.2. Market Share Analysis, 2021

            15.1.2.1. By Type

            15.1.2.2. By Application

    15.2. Canada

        15.2.1. Pricing Analysis

        15.2.2. Market Share Analysis, 2021

            15.2.2.1. By Type

            15.2.2.2. By Application

    15.3. Brazil

        15.3.1. Pricing Analysis

        15.3.2. Market Share Analysis, 2021

            15.3.2.1. By Type

            15.3.2.2. By Application

    15.4. Mexico

        15.4.1. Pricing Analysis

        15.4.2. Market Share Analysis, 2021

            15.4.2.1. By Type

            15.4.2.2. By Application

    15.5. Argentina

        15.5.1. Pricing Analysis

        15.5.2. Market Share Analysis, 2021

            15.5.2.1. By Type

            15.5.2.2. By Application

    15.6. Chile

        15.6.1. Pricing Analysis

        15.6.2. Market Share Analysis, 2021

            15.6.2.1. By Type

            15.6.2.2. By Application

    15.7. Peru

        15.7.1. Pricing Analysis

        15.7.2. Market Share Analysis, 2021

            15.7.2.1. By Type

            15.7.2.2. By Application

    15.8. Germany

        15.8.1. Pricing Analysis

        15.8.2. Market Share Analysis, 2021

            15.8.2.1. By Type

            15.8.2.2. By Application

    15.9. Italy

        15.9.1. Pricing Analysis

        15.9.2. Market Share Analysis, 2021

            15.9.2.1. By Type

            15.9.2.2. By Application

    15.10. France

        15.10.1. Pricing Analysis

        15.10.2. Market Share Analysis, 2021

            15.10.2.1. By Type

            15.10.2.2. By Application

    15.11. Spain

        15.11.1. Pricing Analysis

        15.11.2. Market Share Analysis, 2021

            15.11.2.1. By Type

            15.11.2.2. By Application

    15.12. United Kingdom

        15.12.1. Pricing Analysis

        15.12.2. Market Share Analysis, 2021

            15.12.2.1. By Type

            15.12.2.2. By Application

    15.13. Russia

        15.13.1. Pricing Analysis

        15.13.2. Market Share Analysis, 2021

            15.13.2.1. By Type

            15.13.2.2. By Application

    15.14. Poland

        15.14.1. Pricing Analysis

        15.14.2. Market Share Analysis, 2021

            15.14.2.1. By Type

            15.14.2.2. By Application

    15.15. BENELUX

        15.15.1. Pricing Analysis

        15.15.2. Market Share Analysis, 2021

            15.15.2.1. By Type

            15.15.2.2. By Application

    15.16. Nordic Countries

        15.16.1. Pricing Analysis

        15.16.2. Market Share Analysis, 2021

            15.16.2.1. By Type

            15.16.2.2. By Application

    15.17. China

        15.17.1. Pricing Analysis

        15.17.2. Market Share Analysis, 2021

            15.17.2.1. By Type

            15.17.2.2. By Application

    15.18. Japan

        15.18.1. Pricing Analysis

        15.18.2. Market Share Analysis, 2021

            15.18.2.1. By Type

            15.18.2.2. By Application

    15.19. South Korea

        15.19.1. Pricing Analysis

        15.19.2. Market Share Analysis, 2021

            15.19.2.1. By Type

            15.19.2.2. By Application

    15.20. India

        15.20.1. Pricing Analysis

        15.20.2. Market Share Analysis, 2021

            15.20.2.1. By Type

            15.20.2.2. By Application

    15.21. Thailand

        15.21.1. Pricing Analysis

        15.21.2. Market Share Analysis, 2021

            15.21.2.1. By Type

            15.21.2.2. By Application

    15.22. Indonesia

        15.22.1. Pricing Analysis

        15.22.2. Market Share Analysis, 2021

            15.22.2.1. By Type

            15.22.2.2. By Application

    15.23. Malaysia

        15.23.1. Pricing Analysis

        15.23.2. Market Share Analysis, 2021

            15.23.2.1. By Type

            15.23.2.2. By Application

    15.24. Singapore

        15.24.1. Pricing Analysis

        15.24.2. Market Share Analysis, 2021

            15.24.2.1. By Type

            15.24.2.2. By Application

    15.25. Australia

        15.25.1. Pricing Analysis

        15.25.2. Market Share Analysis, 2021

            15.25.2.1. By Type

            15.25.2.2. By Application

    15.26. New Zealand

        15.26.1. Pricing Analysis

        15.26.2. Market Share Analysis, 2021

            15.26.2.1. By Type

            15.26.2.2. By Application

    15.27. GCC Countries

        15.27.1. Pricing Analysis

        15.27.2. Market Share Analysis, 2021

            15.27.2.1. By Type

            15.27.2.2. By Application

    15.28. South Africa

        15.28.1. Pricing Analysis

        15.28.2. Market Share Analysis, 2021

            15.28.2.1. By Type

            15.28.2.2. By Application

    15.29. North Africa

        15.29.1. Pricing Analysis

        15.29.2. Market Share Analysis, 2021

            15.29.2.1. By Type

            15.29.2.2. By Application

    15.30. Central Africa

        15.30.1. Pricing Analysis

        15.30.2. Market Share Analysis, 2021

            15.30.2.1. By Type

            15.30.2.2. By Application

16. Market Structure Analysis

    16.1. Competition Dashboard

    16.2. Competition Benchmarking

    16.3. Market Share Analysis of Top Players

        16.3.1. By Regional

        16.3.2. By Type

        16.3.3. By Application

17. Competition Analysis

    17.1. Competition Deep Dive

        17.1.1. Lancer

            17.1.1.1. Overview

            17.1.1.2. Product Portfolio

            17.1.1.3. Profitability by Market Segments (Type /Application/Region)

            17.1.1.4. Sales Footprint

            17.1.1.5. Strategy Overview

                17.1.1.5.1. Marketing Strategy

                17.1.1.5.2. Product Strategy

                17.1.1.5.3. Channel Strategy

        17.1.2. Wineemotion

            17.1.2.1. Overview

            17.1.2.2. Product Portfolio

            17.1.2.3. Profitability by Market Segments (Type /Application/Region)

            17.1.2.4. Sales Footprint

            17.1.2.5. Strategy Overview

                17.1.2.5.1. Marketing Strategy

                17.1.2.5.2. Product Strategy

                17.1.2.5.3. Channel Strategy

        17.1.3. WineKeeper

            17.1.3.1. Overview

            17.1.3.2. Product Portfolio

            17.1.3.3. Profitability by Market Segments (Type /Application/Region)

            17.1.3.4. Sales Footprint

            17.1.3.5. Strategy Overview

                17.1.3.5.1. Marketing Strategy

                17.1.3.5.2. Product Strategy

                17.1.3.5.3. Channel Strategy

        17.1.4. EdgeStar

            17.1.4.1. Overview

            17.1.4.2. Product Portfolio

            17.1.4.3. Profitability by Market Segments (Type /Application/Region)

            17.1.4.4. Sales Footprint

            17.1.4.5. Strategy Overview

                17.1.4.5.1. Marketing Strategy

                17.1.4.5.2. Product Strategy

                17.1.4.5.3. Channel Strategy

        17.1.5. Enomatic

            17.1.5.1. Overview

            17.1.5.2. Product Portfolio

            17.1.5.3. Profitability by Market Segments (Type /Application/Region)

            17.1.5.4. Sales Footprint

            17.1.5.5. Strategy Overview

                17.1.5.5.1. Marketing Strategy

                17.1.5.5.2. Product Strategy

                17.1.5.5.3. Channel Strategy

        17.1.6. PourMyBeer

            17.1.6.1. Overview

            17.1.6.2. Product Portfolio

            17.1.6.3. Profitability by Market Segments (Type /Application/Region)

            17.1.6.4. Sales Footprint

            17.1.6.5. Strategy Overview

                17.1.6.5.1. Marketing Strategy

                17.1.6.5.2. Product Strategy

                17.1.6.5.3. Channel Strategy

        17.1.7. Wine Cellar Specialists

            17.1.7.1. Overview

            17.1.7.2. Product Portfolio

            17.1.7.3. Profitability by Market Segments (Type /Application/Region)

            17.1.7.4. Sales Footprint

            17.1.7.5. Strategy Overview

                17.1.7.5.1. Marketing Strategy

                17.1.7.5.2. Product Strategy

                17.1.7.5.3. Channel Strategy

        17.1.8. The Wine Room T/A Wineroom

            17.1.8.1. Overview

            17.1.8.2. Product Portfolio

            17.1.8.3. Profitability by Market Segments (Type /Application/Region)

            17.1.8.4. Sales Footprint

            17.1.8.5. Strategy Overview

                17.1.8.5.1. Marketing Strategy

                17.1.8.5.2. Product Strategy

                17.1.8.5.3. Channel Strategy

        17.1.9. Perlick

            17.1.9.1. Overview

            17.1.9.2. Product Portfolio

            17.1.9.3. Profitability by Market Segments (Type /Application/Region)

            17.1.9.4. Sales Footprint

            17.1.9.5. Strategy Overview

                17.1.9.5.1. Marketing Strategy

                17.1.9.5.2. Product Strategy

                17.1.9.5.3. Channel Strategy

        17.1.10. Mayflower Precision Mac

            17.1.10.1. Overview

            17.1.10.2. Product Portfolio

            17.1.10.3. Profitability by Market Segments (Type /Application/Region)

            17.1.10.4. Sales Footprint

            17.1.10.5. Strategy Overview

                17.1.10.5.1. Marketing Strategy

                17.1.10.5.2. Product Strategy

                17.1.10.5.3. Channel Strategy

        17.1.11. SILEXA PourMyWine

            17.1.11.1. Overview

            17.1.11.2. Product Portfolio

            17.1.11.3. Profitability by Market Segments (Type /Application/Region)

            17.1.11.4. Sales Footprint

            17.1.11.5. Strategy Overview

                17.1.11.5.1. Marketing Strategy

                17.1.11.5.2. Product Strategy

                17.1.11.5.3. Channel Strategy

        17.1.12. Vinotemp

            17.1.12.1. Overview

            17.1.12.2. Product Portfolio

            17.1.12.3. Profitability by Market Segments (Type /Application/Region)

            17.1.12.4. Sales Footprint

            17.1.12.5. Strategy Overview

                17.1.12.5.1. Marketing Strategy

                17.1.12.5.2. Product Strategy

                17.1.12.5.3. Channel Strategy

18. Assumptions & Acronyms Used

19. Research Methodology

Explore Process Automation Insights

View Reports

Commercial Wine Dispenser Market