Reports

- Global Locations -

Headquarters

Future Market Insights, Inc.

Christiana Corporate, 200
Continental Drive, Suite 401,
Newark, Delaware - 19713,
United States

T: +1-845-579-5705

Americas

Future Market Insights, Inc.

616 Corporate Way, Suite 2-9018,
Valley Cottage, NY 10989, United States

T: +1-347-918-3531

MEA

Future Market Insights

1602-6 Jumeirah Bay X2 Tower, Plot No: JLT-PH2-X2A,
Jumeirah Lakes Towers, Dubai,
United Arab Emirates

Europe

Future Market Insights

3rd Floor, 207 Regent Street,
W1B 3HH London
United Kingdom

T: + 44 (0) 20 8123 9659
D: +44 (0) 20 3287 4268

Asia Pacific

Future Market Insights

IndiaLand Global Tech Park, Unit UG-1, Behind Grand HighStreet, Phase 1, Hinjawadi, MH, Pune – 411057, India

Commercial Hot Dog Cooker Market Outlook (2023 to 2033)

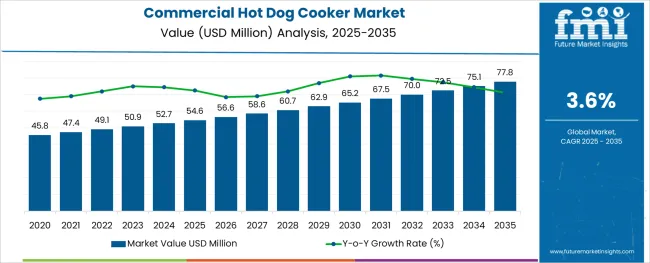
The global commercial hot dog cooker market is expected to reach at US$ 72.8 Million by 2033, from US$ 50.9 Million in 2023, registering at a CAGR of 3.6% over the forecast period. The growth in the market is attributed to the following:

  • The demand for commercial hot dog cookers is expected to rise since these units are built according to the customer’s specifications.
  • Hot dog cookers can be used to make other types of food as well, which makes them a piece of versatile equipment.
  • The equipment comes with different pieces; each of which has various purposes that keep the hot dog warm until purchase.
  • There are portable options available for vendors who wish to switch their points of sale. This is estimated to surge the adoption of commercial hot dog cookers.
Attributes Details
Commercial Hot Dog Cooker Market Size (2023) US$ 50.9 Million
Commercial Hot Dog Cooker Market Size (2033) US$ 72.8 Million
Commercial Hot Dog Cooker Market CAGR 3.6%

Don't pay for what you don't need

Customize your report by selecting specific countries or regions and save 30%!

Global Trends & Scopes Reshaping the Commercial Hot Dog Cooker Market

Easy-to-read graphics and heavy-duty knobs facilitate the operation of the cooker

Manufacturers of commercial hot dog cookers incessantly develop various features to facilitate the operation of the equipment for end users. For instance, they provide easy-to-read graphics and heavy-duty knobs on the control panel. Moreover, the Infinite Control System offered by most key players gives the operator the maximum ability to adjust temperatures to a variety of hot dogs, sausages, egg rolls, etc. Raised rollers and detachable grease collection pans on these hot dog cookers enable cleaning in confined spaces. The demand for commercial hot dog cookers is rising owing to the capability of these machines to hold from 20 to 230 hot dogs, depending on the size and features. Each of the cooker’s rollers rotates a full 360 degrees to ensure that the food item is evenly heated for customers to come back for more. Furthermore, these cookers take roughly 10-20 mins to cook hot dogs, and some of these cookers feature two independently controlled adjustable thermostats that allow the operator to warm the product on the front rollers while cooking on the back. In addition, for added convenience, the non-stick rollers and removable drip tray that help expedite end-of-day cleaning. Key players pride themselves in their commercial hot dog cookers that have a sleek stainless unit and high-torque motor combined that provide the operator with a machine that is not only built for long-lasting performance but also with easy cleanability in mind. This contributes to the commercial hot dog cooker market growth.

Tempered glass panel and merchandising graphics - attracting customers!

Considering the popularity of hot dogs, especially in countries like the USA, the UK, Germany, and Japan, key players yielded different types of hot dog cookers to cater to various hot dog preparations, according to the specific requirement of the end user. The list of this equipment and products include a doghouse hotdog cooker, hotdog roller grills, hotdog mini cart steamer, condiment stations, and hotdog supplies and accessories.

Certain market players work with their customers, to provide them with the right and most ideal equipment in accordance with their business. They have a team of experienced professionals who may guide the customers from the point of consultation to the purchase of the equipment. Meanwhile, some market players are selling their products on e-commerce platforms with a wide product portfolio that is visually appealing to customers, encouraging rapid sales. These factors are anticipated to generate lucrative market opportunities and expand the global commercial hot dog cooker market size.

Apart from hot dog vendors, restaurants are also deploying commercial hot dog cookers. This is because this equipment helps restaurants cook hot dogs quickly and easily. Moreover, they are able to serve them at a lower cost than if they were to be purchased from a grocery store. This is likely to expand the global market size.

Hotels usually prefer to host fine dining experiences in their establishments. However, certain hotels favour opening their own bakery or a small snack station. Therefore, hotels wish to offer their visitors different types of hot dogs and other quick and easy meals, and hence, play a huge role in the commercial hot dog cooker market trends.

In addition, the Infinite Control System provided by the majority of the large companies offers the operator the greatest flexibility in temperature control for a variety of hot dogs, sausages, egg rolls, etc.

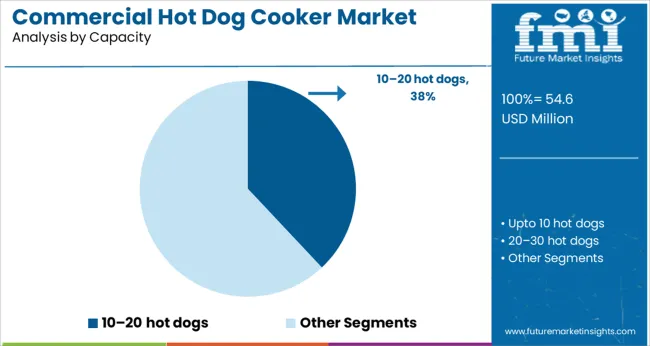
The cooking time for hot dogs in these cookers is between 10 and 20 minutes, and some of them include two independently regulated adjustable temperatures that let the user warm the food on the front rollers while cooking it on the rear.

Important manufacturers take pleasure in their commercial hot dog cookers, which feature a stylish stainless-steel unit and a powerful motor to give the operator a device that is not only made for enduring performance but also for simple cleaning. This aids in the expansion of the market for commercial hot dog cookers.

A Contrast with the Historical Market Scenario

The statistics accumulated by Future Market Insights, reveal the global forum of commercial hot dog cookers which has witnessed an unprecedented surge over the past few years. The manufacturers in the market are in conjunction with the increasing demand for commercial hot dog cookers. There has been a gradual rise from a CAGR of 2.7% registered during the period of 2018 to 2022 and is likely to expand at a steady rate of 3.6% over the forecast period.

The significant growth in the market can be attributed to the increasing need for hot dog equipment by restaurants, cafés, and individual hot dog vendors. By investing in commercial hot dog cookers, food outlets are available to serve high-quality, fresh hot dogs to their customers in a very short amount of time. This not only boosts the sales of these outlets but also generates creative recipes for hot dogs and other food items that can be prepared in these machines.

In the contemporary world, hot dogs are being sold by small to big vendors in stalls and stands in cities across the world. Its growing popularity is compelling key manufacturers to incorporate advanced technologies that further facilitate the cooking process. In addition, these technologies are likely to allow the operators to create variations in recipes and have a longer warranty period. This is anticipated to increase the adoption of commercial hot dog cookers over the forecast period.

Nandini Roy Choudhury

Principal Consultant

Talk to Analyst

Find your sweet spots for generating winning opportunities in this market.

Comparative Analysis of Adjacent Markets

Commercial Hot Dog Cooker Market:

Attributes Commercial Hot Dog Cooker Market
CAGR (2023 to 2033) 3.6%
Market Value (2033) US$ 72.8 Million
Growth Factor Growing demand for processed and convenience foods owing to the hectic lifestyles of people across the globe.
Opportunity Hot dog cookers are equipped with advanced technologies to better facilitate the cooking of fast food items.
Restraints Areas with limited electricity, and the growing diabetic population that cannot consume processed meat.

Ceramic Barbeque Grill Market:

Attributes Ceramic Barbeque Grill Market
CAGR (2023 to 2033) 4.5%
Market Value (2033) US$ 1,412.6 Million
Growth Factor An efficient mode of cooking as it consumes comparatively much lesser amount of fuel and has the ability to quickly raise the temperature of the inner surroundings.
Opportunity The introduction of touchscreen controls, temperature measurement, in-built safety control systems, and options to redirect the heat flow.
Restraints Lack of skilled employees, reducing the production capacity, changing preferences of individuals, and shortage of logistics.

Electric Rice Cooker Market:

Attributes Electric Rice Cooker Market
CAGR (2023 to 2033) 7%
Market Value (2033) US$ 8.83 Billion
Growth Factor Consumers' inclination toward the use of convenience products, owing to the busy lifestyle, in countries where rice is the staple food.
Opportunity Shifting from gas-based to electric rice cookers as it allows consumers to cook other grains, lentils, and even some recipes.
Restraints Low-quality rice cookers are unable to cook rice evenly; individuals residing in remote areas may not have sufficient electricity supply to operate these cookers.

Category-wise Insights

  • Hot Dog Steamer - By Product Type

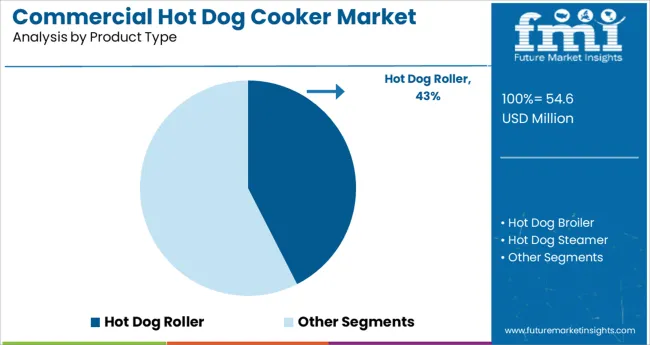
By product type, the market is segmented into hot dog roller, hot dog broiler, and hot dog steamer. It has been studied by the analysts at Future Market Insights that the segment is estimated to hold a major market share for hot dog steamer, registering a CAGR of 3.8% over the forecast period.

The pivotal elements determining the momentum of this segment are:

  • Hot dog steamers keep the sausages and the buns fresh for the longest amount of time, while inside the machine.
  • This type of hot dog cooker uses the heat from the water to cook the food items, therefore prolonging their plumpness and juiciness.
  • Food Vending Stalls - By End Use Industry Type

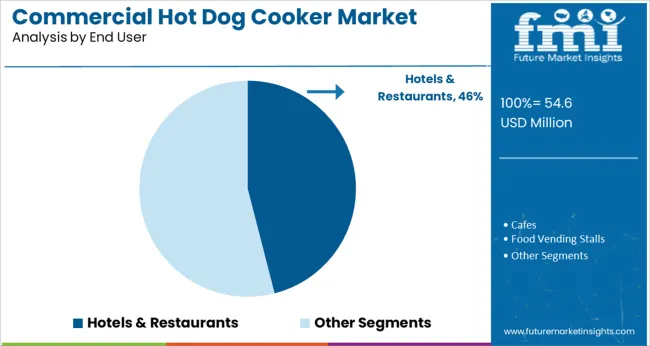
By end-use industry type, the market is segmented into hotels & restaurants, cafés, food vending stalls, and food processing units. It has been researched by the analysts at Future Market Insights that the food vending stalls segment is likely to hold a major market share, registering a CAGR of 4.2% over the forecast period.

The vital attributes determining the momentum of this segment are:

  • Food stall vendors have the ability to choose the clients they work with. They have the freedom to work with either a few clients or hundreds.
  • The vendors further have the ability to choose their selling location which makes it convenient both for them and the customers who are looking for grab-and-go foods.

Get the data you need at a Fraction of the cost

Personalize your report by choosing insights you need
and save 40%!

Hot Dogs are a Staple during Special Occasions & Other Features

It has been observed, that hot dog consumption increases especially during occasions such as Labour Day, Memorial Day, and Independence Day, particularly in developed countries. Moreover, the growing number of sports events across the world are further expected to increase the demand for commercial hot dog cooker.

Hot dog appliances are available in compact dimensions, that have high efficiency and can be cleaned easily. Furthermore, there has been a growing demand for convenience, on-the-go foods, especially amongst the millennials and Generation Z. These factors are estimated to support the global market growth.

The sales of commercial hot dog cookers are likely to boost since they are designed with polytetrafluoroethylene the seals at the edge of the rollers which restrict grease to enter the motor and chains and ensure easy cleaning of the equipment. In addition, the growing trend of street food and convenience stores has increased sales in the retail sector, evidently contributing to global market growth.

Carbon Build-up & Other Obstructions along with Market Opportunities

Carbon gets accumulated in commercial hot dog cookers due to the continuous operations throughout the day. Carbon build-up leads to uneven temperature distribution to hot dogs and in some cases, may lead to overheating and damage to the equipment. Moreover, contact with metal utensils, steel wool (used for cleaning), and abrasives can also damage the coatings.

Conversely, the influx of focus on product design by key manufacturers with improved features. For instance, the players are concentrating on developing machines that utilize aligning chains which help in ensuring noise-free and smooth functioning and further eliminate the challenge of chain slipping. Additionally, key players aim to incorporate advanced technologies such as Artificial Intelligence (AI), IoT, robotics, and so on., which is anticipated to create market opportunities.
Region-Wise Insights

Popular Working-Class Street Food in the USA

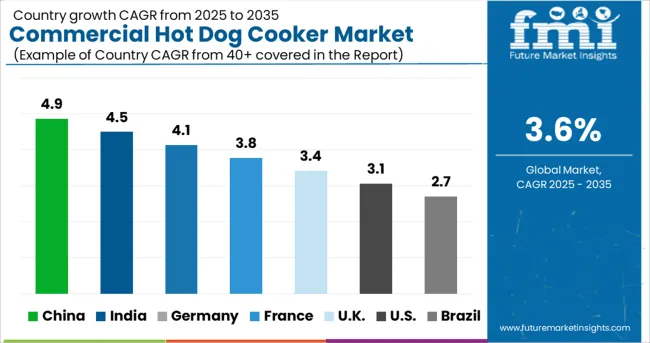
The USA commercial hot dog cooker market is expected to grow with a revenue of 2.6%. This is attributed to the extensive consumption of hot dogs in this country. Moreover, although culturally imported from Europe, the snack increased in demand in the USA since the early 1900s.

Hot dog cookers are always being improved by manufacturers in order to serve the freshest dogs and keep the buns hot and fresh so that they can always be supplied at the ideal temperature. Furthermore, certain hot dog cookers in the USA come decorated with brightly colored labels to help boost impulse sales at hot dog stands, kiosks, snack bars, food courts, or fast-food joints. This is expected to drive the sales of commercial hot dog cookers.

As a popular working-class street food, key players in the USA recognize the importance of the quality of hot dogs. Hence, both restaurant chains and individual stands that serve hot dogs, require the highest quality, industrial-strength hot dog cookers. This is because this type of equipment cooks the sausages quickly, keeping them hot and ready to serve to the hungry concession stand crowds and customers in fast-food joints.

Most of these hot dog cookers are offered with the ability to hold up to 230 hot dogs and 60 buns. In addition, these cookers prepare the dogs in less than 20 minutes and then hold them at a food-safe temperature until they are ready to serve. Moreover, some key companies offer accessory items such as hot dog wrappers and bags to their revered clients. This is likely to surge the global commercial hot dog cooker market growth.

In Germany, different types of hot dogs require different cooking methods

With a revenue of 2.2%, Germany is a significant commercial hot dog cooker market. This is because there are so many moveable street hot dog vendors in crowded areas throughout different German cities. Moreover, the country is the origin place of hot dogs and it is a cherished snack amongst the people.

Germany is known for the availability of different types of hot dogs of various sizes. Most of their sausages are longer than the standard size, with each of them having different tastes and textures. Furthermore, each hot dog requires different grilling techniques and cooking time. Hence, the demand for commercial hot dog cookers is estimated to increase in this country.

Hot dog stands in Berlin are not standard like in the USA For instance, walking hot dog stands with a makeshift special design costume including a hot dog tray, and an umbrella is a striking and appealing sight for customers. Key companies in the country are hence developing portable commercial hot dog cookers so that the vendors can easily carry the entire stand, cook hot dogs whenever needed, and change their location to reach a wider customer base across cities.

Japadog - a trendy hot dog variation from Japan!

Japan is a lucrative commercial hot dog cooker market, growing significantly at a rate of 2.8%. This is attributed to the growing popularity of hot dogs in the country. The Japanese population is increasingly adapting to the western lifestyle, which includes their eating habits, and hence, hot dogs have become a popular snack in the country, in the last few years.

Japan has grasped the concept of hot dogs but has incorporated traditional Japanese flavors and ingredients that are becoming progressively popular across the globe. For instance, Japadog is the trendy hot dog variation that is doused in teriyaki sauce and wasabi, instead of the traditional ketchup and mustard, and drizzled with bits of nori seaweed, instead of relish. This is expected to raise the adoption of commercial hot dog cookers in the country.

Apart from hot dogs, Japanese people, like Americans, enjoy grilling and barbecuing in their homes with friends and family. Additionally, there is a pit-stop food stall across different cities that serve Japanese-style barbeque (teriyaki) food, all year round. Both these instances require the deployment of some type of commercial hot dog cooker.

Hectic Lifestyles in Australia Demand grab-and-go Food Like Hot Dogs!

In Australia, hot dogs are a popular item in many fast food stands, stadiums, cafés, and restaurants. This is because the snack is an ideal grab-and-go food item, that is convenient owing to the hectic lifestyle of the major population. In addition, different regions of Australia love hot dogs prepared in various ways, such as grilling or dressing. Food outlets in Australia have secured a high adoption of commercial hot dog cookers to create these affordable, and palatable snacks for their customers with the ideal cooking levels specifically designed for juicy hot sausages. Moreover, key players ensure that the cookers come with 2-4 grills in a range of sizes to cater to different business needs.

Owing to a fast-paced lifestyle and a heavy influx of customers, food outlets require commercial equipment that is convenient and facilitates each step of cooking. Therefore, they turn to commercial hot dog cookers since they are easy to use, maintain the serving temperature of the food, require less cook time, and are very easy to clean. These factors are likely to contribute to the commercial hot dog cooker market growth.

Overview of Key Trends Paving Used Commercial Hot Dog Cooker Market Progress

Start-up companies are getting creative with the accumulation of commercial hot dog cookers and implementing various strategies to develop products that are energy-efficient and equipped with advanced technologies such as AI, IoT, robotics, and so on.

The increasing need for portable commercial hot dog cookers is accelerating the market share. This is because hot dogs are becoming popular and are savored by people across the world, and is a very convenient fast-food snack that can be prepared quickly.

Start-up companies are recognizing the high demands from restaurants that are fast-food joints and receive a rush of orders every day, which surges them to generate new and exciting trends. Through the advent of technology, and efforts by start-up companies, restaurants are able to access different kinds of used commercial kitchen equipment easily at affordable prices, which is likely to expand the global commercial hot dog cooker market size.
Top 5 Key Companies Revolutionizing the Commercial Hot Dog Cooker Market Space

Market players are coming up with different solutions for a seamless user experience in commercial hot dog cookers, for both personal use, and businesses. With the growing advent of technology, as well as sports and music events, market players are constantly coming up with newer innovations that will keep the demand for commercial hot dog cookers fastened, in the market.

TOP MARKET PLAYERS IN THE COMMERCIAL HOT DOG COOKER MARKET:

  • Benchmark USA - It specializes in concession solutions, stunning styles, and fresh ideas for food equipment such as popcorn machines, hotdog machines, food warmers, and more.
  • Nemco Food Equipment - It is a manufacturer of innovative Food Prep and Food Warming equipment offering the industry's most complete line of manually operated countertop equipment.
  • Star Manufacturing - It is a leader in commercial countertop cooking including charbroilers, griddles, toasters, panini grills, hot dog roller grills, and more. It manufactures heavy-duty commercial cooking equipment for restaurants.
  • Avantco Equipment - Together with their manufacturing partners, they produce a broad range of countertop- food preparation devices that are perfect for a variety of businesses. The products are backed by their expert service and support team.
  • Semak Australia - It has grown to be a leading manufacturer, distributor, importer, and exporter of appliances such as Commercial Hot Dog Cookers, Chicken Rotisseries, Blenders, Stick Blenders, Pie Warmers, Juicers, etc. within Australia.

OTHER MARKET PARTICIPANTS OF THE COMMERCIAL HOT DOG COOKER MARKET

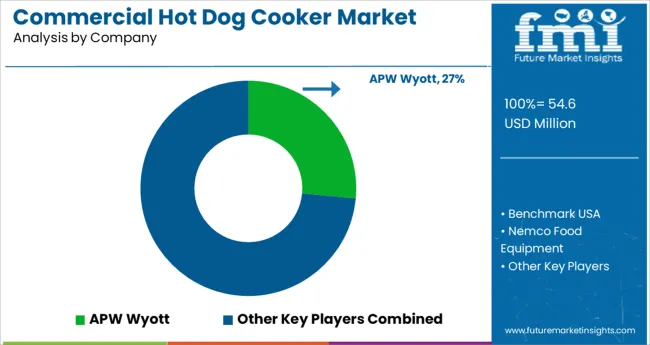
  • APW Wyott
  • The Vollrath Company
  • Admiral Craft Equipment
  • Deuster
  • Sirman
  • Pratt's Direct
  • Roller Auctions
  • Gold Medal
  • Cretors
  • Roband Australia

The Newest Developments in the Commercial Hot Dog Cooker Market are

  • In December 2021, Star Holdings Group announced Rupp’s in downtown Sheboygan, Wisconsin the winner of our Star’s Oldest Unit in Operation Contest held in honor of Star’s 100th Anniversary in 2021.
  • In November 2022, WebstaurantStore, a subsidiary of Benchmark USA, offered discount coupons and rewards such as the Visa Business Card which allows customers to start earning rewards on every WebstaurantStore purchase.
  • In May 2022, Nemco Food Equipment, a food service industry leader in food prep and other countertop applications, acquired Ft. Wayne, Indiana’s, Meister Cook, LLC, a custom food equipment designer that developed a range of proprietary solutions for large restaurant chains throughout North America.

Key Segments Profiled in the Commercial Hot Dog Cooker Market Survey

By Product Type:

  • Hot Dog Roller
  • Hot Dog Broiler
  • Hot Dog Steamer

By Capacity:

  • Up to 10 Hot Dogs
  • 10-20 Hot Dogs
  • 20-30 Hot Dogs

By End Use Industry:

  • Hotels & Restaurants
  • Cafés
  • Food Vending Stalls
  • Food Processing Units

By Region:

  • North America
  • Latin America
  • Asia Pacific
  • Middle East and Africa (MEA)
  • Europe

Frequently Asked Questions

How much CAGR can be Estimated for the Commercial Hot Dog Cooker Market?

The commercial hot dog cooker market is likely to accumulate a CAGR of 3.6%, during the forecast period.

What is the Leading Regional Market for Commercial Hot Dog Cookers?

Japan is the leading commercial hot dog cooker market with a revenue of 2.8%.

What will be the Size of the Commercial Hot Dog Cooker Market by 2033?

The commercial hot dog cooker market is likely to grow to a revenue of US$ 7,643.3 Million by 2033.

Table of Content

1. Executive Summary | Commercial Hot Dog Cooker Market

    1.1. Global Market Outlook

    1.2. Demand-side Trends

    1.3. Supply-side Trends

    1.4. Technology Roadmap Analysis

    1.5. Analysis and Recommendations

2. Market Overview

    2.1. Market Coverage / Taxonomy

    2.2. Market Definition / Scope / Limitations

3. Market Background

    3.1. Market Dynamics

        3.1.1. Drivers

        3.1.2. Restraints

        3.1.3. Opportunity

        3.1.4. Trends

    3.2. Impact of Covid-19

        3.2.1. Demand in Optimistic Scenario

        3.2.2. Demand in Likely Scenario

        3.2.3. Demand in Conservative Scenario

    3.3. Macro Factors and Forecast Factors

    3.4. Value Chain Analysis

        3.4.1. Profit Margin Analysis

        3.4.2. Raw Product Type Suppliers

        3.4.3. Manufacturers, Wholesalers, and Distributors

        3.4.4. End Users/ Customers

    3.5. Regional Parent Market Outlook

    3.6. Production and Consumption Statistics

    3.7. Global Average Pricing Analysis Benchmark

4. Global Market Analysis 2018 to 2022 and Forecast, 2023 to 2033

    4.1. Historical Market Size Value (US$ Million) & Volume (Units) Analysis, 2018 to 2022

    4.2. Current and Future Market Size Value (US$ Million) & Volume (Units) Projections, 2023 to 2033

        4.2.1. Y-o-Y Growth Trend Analysis

        4.2.2. Absolute $ Opportunity Analysis

5. Global Market Analysis 2018 to 2022 and Forecast 2023 to 2033, By Product Type 

    5.1. Introduction / Key Findings

    5.2. Historical Market Size Value (US$ Million) & Volume (Units) Analysis By Product Type, 2018 to 2022

    5.3. Current and Future Market Size Value (US$ Million) & Volume (Units) Analysis and Forecast By Product Type, 2023 to 2033

        5.3.1. Hot Dog Roller

        5.3.2. Hot Dog Broiler

        5.3.3. Hot Dog Steamer

    5.4. Y-o-Y Growth Trend Analysis By Product Type, 2018 to 2022

    5.5. Absolute $ Opportunity Analysis By Product Type, 2023 to 2033

6. Global Market Analysis 2018 to 2022 and Forecast 2023 to 2033, By Capacity

    6.1. Introduction / Key Findings

    6.2. Historical Market Size Value (US$ Million) & Volume (Units) Analysis By Capacity, 2018 to 2022

    6.3. Current and Future Market Size Value (US$ Million) & Volume (Units) Analysis and Forecast By Capacity, 2023 to 2033

        6.3.1. Upto 10 hot dogs

        6.3.2. 10-20 hot dogs

        6.3.3. 20-30 hot dogs

    6.4. Y-o-Y Growth Trend Analysis By Capacity, 2018 to 2022

    6.5. Absolute $ Opportunity Analysis By Capacity, 2023 to 2033

7. Global Market Analysis 2018 to 2022 and Forecast 2023 to 2033, By End User 

    7.1. Introduction / Key Findings

    7.2. Historical Market Size Value (US$ Million) & Volume (Units) Analysis By End User, 2018 to 2022

    7.3. Current and Future Market Size Value (US$ Million) & Volume (Units) Analysis and Forecast By End User, 2023 to 2033

        7.3.1. Hotels & Restaurants

        7.3.2. Cafes

        7.3.3. Food Vending Stalls

        7.3.4. Food Processing Units

    7.4. Y-o-Y Growth Trend Analysis By End User, 2018 to 2022

    7.5. Absolute $ Opportunity Analysis By End User, 2023 to 2033

8. Global Market Analysis 2018 to 2022 and Forecast 2023 to 2033, by Region

    8.1. Introduction / Key Findings

    8.2. Historical Market Size Value (US$ Million) & Volume (Units) Analysis By Region, 2018 to 2022

    8.3. Current and Future Market Size Value (US$ Million) & Volume (Units) Analysis and Forecast By Region, 2023 to 2033

        8.3.1. North America

        8.3.2. Latin America

        8.3.3. Europe

        8.3.4. East Asia

        8.3.5. South Asia

        8.3.6. Oceania

        8.3.7. Middle East and Africa (MEA)

    8.4. Market Attractiveness Analysis, by Region

9. North America Market Analysis 2018 to 2022 and Forecast 2023 to 2033, By Country

    9.1. Historical Market Size Value (US$ Million) & Volume (Units) Trend Analysis By Market Taxonomy, 2018 to 2022

    9.2. Market Size Value (US$ Million) & Volume (Units) Forecast By Market Taxonomy, 2023 to 2033

        9.2.1. By Country

            9.2.1.1. United States of America

            9.2.1.2. Canada

        9.2.2. By Product Type

        9.2.3. By Capacity

        9.2.4. By End User

    9.3. Market Attractiveness Analysis

        9.3.1. By Country

        9.3.2. By Product Type

        9.3.3. By Capacity

        9.3.4. By End User

    9.4. Key Takeaways

10. Latin America Market Analysis 2018 to 2022 and Forecast 2023 to 2033, By Country

    10.1. Historical Market Size Value (US$ Million) & Volume (Units) Trend Analysis By Market Taxonomy, 2018 to 2022

    10.2. Market Size Value (US$ Million) & Volume (Units) Forecast By Market Taxonomy, 2023 to 2033

        10.2.1. By Country

            10.2.1.1. Brazil

            10.2.1.2. Mexico

            10.2.1.3. Argentina

            10.2.1.4. Chile

            10.2.1.5. Peru

            10.2.1.6. Rest of Latin America

        10.2.2. By Product Type

        10.2.3. By Capacity

        10.2.4. By End User

    10.3. Market Attractiveness Analysis

        10.3.1. By Country

        10.3.2. By Product Type

        10.3.3. By Capacity

        10.3.4. By End User

    10.4. Key Takeaways

11. Europe Market Analysis 2018 to 2022 and Forecast 2023 to 2033, By Country

    11.1. Historical Market Size Value (US$ Million) & Volume (Units) Trend Analysis By Market Taxonomy, 2018 to 2022

    11.2. Market Size Value (US$ Million) & Volume (Units) Forecast By Market Taxonomy, 2023 to 2033

        11.2.1. By Country

            11.2.1.1. Germany

            11.2.1.2. Italy

            11.2.1.3. France

            11.2.1.4. United Kingdom

            11.2.1.5. Spain

            11.2.1.6. BENELUX

            11.2.1.7. Nordic

            11.2.1.8. Russia

            11.2.1.9. Poland

            11.2.1.10. Rest of Europe

        11.2.2. By Product Type

        11.2.3. By Capacity

        11.2.4. By End User

    11.3. Market Attractiveness Analysis

        11.3.1. By Country

        11.3.2. By Product Type

        11.3.3. By Capacity

        11.3.4. By End User

    11.4. Key Takeaways

12. East Asia Market Analysis 2018 to 2022 and Forecast 2023 to 2033, By Country

    12.1. Historical Market Size Value (US$ Million) & Volume (Units) Trend Analysis By Market Taxonomy, 2018 to 2022

    12.2. Market Size Value (US$ Million) & Volume (Units) Forecast By Market Taxonomy, 2023 to 2033

        12.2.1. By Country

            12.2.1.1. China

            12.2.1.2. Japan

            12.2.1.3. South Korea

        12.2.2. By Product Type

        12.2.3. By Capacity

        12.2.4. By End User

    12.3. Market Attractiveness Analysis

        12.3.1. By Country

        12.3.2. By Product Type

        12.3.3. By Capacity

        12.3.4. By End User

    12.4. Key Takeaways

13. South Asia Market Analysis 2018 to 2022 and Forecast 2023 to 2033, By Country

    13.1. Historical Market Size Value (US$ Million) & Volume (Units) Trend Analysis By Market Taxonomy, 2018 to 2022

    13.2. Market Size Value (US$ Million) & Volume (Units) Forecast By Market Taxonomy, 2023 to 2033

        13.2.1. By Country

            13.2.1.1. India

            13.2.1.2. Thailand

            13.2.1.3. Malaysia

            13.2.1.4. Indonesia

            13.2.1.5. Rest of South Asia

        13.2.2. By Product Type

        13.2.3. By Capacity

        13.2.4. By End User

    13.3. Market Attractiveness Analysis

        13.3.1. By Country

        13.3.2. By Product Type

        13.3.3. By Capacity

        13.3.4. By End User

    13.4. Key Takeaways

14. Oceania Market Analysis 2018 to 2022 and Forecast 2023 to 2033, By Country

    14.1. Historical Market Size Value (US$ Million) & Volume (Units) Trend Analysis By Market Taxonomy, 2018 to 2022

    14.2. Market Size Value (US$ Million) & Volume (Units) Forecast By Market Taxonomy, 2023 to 2033

        14.2.1. By Country

            14.2.1.1. Australia

            14.2.1.2. New Zealand

        14.2.2. By Product Type

        14.2.3. By Capacity

        14.2.4. By End User

    14.3. Market Attractiveness Analysis

        14.3.1. By Country

        14.3.2. By Product Type

        14.3.3. By Capacity

        14.3.4. By End User

    14.4. Key Takeaways

15. Middle East & Africa Market Analysis 2018 to 2022 and Forecast 2023 to 2033, By Country

    15.1. Historical Market Size Value (US$ Million) & Volume (Units) Trend Analysis By Market Taxonomy, 2018 to 2022

    15.2. Market Size Value (US$ Million) & Volume (Units) Forecast By Market Taxonomy, 2023 to 2033

        15.2.1. By Country

            15.2.1.1. GCC Countries

            15.2.1.2. Turkey

            15.2.1.3. Northern Africa

            15.2.1.4. South Africa

            15.2.1.5. Rest of MEA

        15.2.2. By Product Type

        15.2.3. By Capacity

        15.2.4. By End User

    15.3. Market Attractiveness Analysis

        15.3.1. By Country

        15.3.2. By Product Type

        15.3.3. By Capacity

        15.3.4. By End User

    15.4. Key Takeaways

16. Country-wise Market Analysis 

    16.1. United States (USA)

        16.1.1. Market Share Analysis, 2023

        16.1.2. By Product Type

        16.1.3. By Capacity

        16.1.4. By End User

    16.2. Canada

        16.2.1. Market Share Analysis, 2023

        16.2.2. By Product Type

        16.2.3. By Capacity

        16.2.4. By End User

    16.3. Brazil

        16.3.1. Market Share Analysis, 2023

        16.3.2. By Product Type

        16.3.3. By Capacity

        16.3.4. By End User

    16.4. Mexico

        16.4.1. Market Share Analysis, 2023

        16.4.2. By Product Type

        16.4.3. By Capacity

        16.4.4. By End User

    16.5. Germany

        16.5.1. Market Share Analysis, 2023

        16.5.2. By Product Type

        16.5.3. By Capacity

        16.5.4. By End User

    16.6. Italy

        16.6.1. Market Share Analysis, 2023

        16.6.2. By Product Type

        16.6.3. By Capacity

        16.6.4. By End User

    16.7. France

        16.7.1. Market Share Analysis, 2023

        16.7.2. By Product Type

        16.7.3. By Capacity

        16.7.4. By End User

    16.8. Spain

        16.8.1. Market Share Analysis, 2023

        16.8.2. By Product Type

        16.8.3. By Capacity

        16.8.4. By End User

    16.9. United Kingdom

        16.9.1. Market Share Analysis, 2023

        16.9.2. By Product Type

        16.9.3. By Capacity

        16.9.4. By End User

    16.10. Russia

        16.10.1. Market Share Analysis, 2023

        16.10.2. By Product Type

        16.10.3. By Capacity

        16.10.4. By End User

    16.11. China

        16.11.1. Market Share Analysis, 2023

        16.11.2. By Product Type

        16.11.3. By Capacity

        16.11.4. By End User

    16.12. Japan

        16.12.1. Market Share Analysis, 2023

        16.12.2. By Product Type

        16.12.3. By Capacity

        16.12.4. By End User

    16.13. India

        16.13.1. Market Share Analysis, 2023

        16.13.2. By Product Type

        16.13.3. By Capacity

        16.13.4. By End User

    16.14. GCC Countries

        16.14.1. Market Share Analysis, 2023

        16.14.2. By Product Type

        16.14.3. By Capacity

        16.14.4. By End User

    16.15. Australia

        16.15.1. Market Share Analysis, 2023

        16.15.2. By Product Type

        16.15.3. By Capacity

        16.15.4. By End User

17. Market Structure Analysis

    17.1. Competition Dashboard

    17.2. Competition Benchmarking

    17.3. Market Share Analysis of Top Players

        17.3.1. By Region

        17.3.2. By Product Portfolio

18. Competition Analysis

    18.1. Competition Deep Dive

        18.1.1. APW Wyott

            18.1.1.1. Overview

            18.1.1.2. Product Portfolio

            18.1.1.3. Profitability by Market Segments (Product/Channel/Region)

            18.1.1.4. Sales Footprint

            18.1.1.5. Strategy Overview

                18.1.1.5.1. Marketing Strategy

                18.1.1.5.2. Product Strategy

                18.1.1.5.3. Channel Strategy

        18.1.2. Benchmark USA

            18.1.2.1. Overview

            18.1.2.2. Product Portfolio

            18.1.2.3. Profitability by Market Segments (Product/Channel/Region)

            18.1.2.4. Sales Footprint

            18.1.2.5. Strategy Overview

                18.1.2.5.1. Marketing Strategy

                18.1.2.5.2. Product Strategy

                18.1.2.5.3. Channel Strategy

        18.1.3. Nemco Food Equipment

            18.1.3.1. Overview

            18.1.3.2. Product Portfolio

            18.1.3.3. Profitability by Market Segments (Product/Channel/Region)

            18.1.3.4. Sales Footprint

            18.1.3.5. Strategy Overview

                18.1.3.5.1. Marketing Strategy

                18.1.3.5.2. Product Strategy

                18.1.3.5.3. Channel Strategy

        18.1.4. Star Manufacturing

            18.1.4.1. Overview

            18.1.4.2. Product Portfolio

            18.1.4.3. Profitability by Market Segments (Product/Channel/Region)

            18.1.4.4. Sales Footprint

            18.1.4.5. Strategy Overview

                18.1.4.5.1. Marketing Strategy

                18.1.4.5.2. Product Strategy

                18.1.4.5.3. Channel Strategy

        18.1.5. The Vollrath Company

            18.1.5.1. Overview

            18.1.5.2. Product Portfolio

            18.1.5.3. Profitability by Market Segments (Product/Channel/Region)

            18.1.5.4. Sales Footprint

            18.1.5.5. Strategy Overview

                18.1.5.5.1. Marketing Strategy

                18.1.5.5.2. Product Strategy

                18.1.5.5.3. Channel Strategy

        18.1.6. Avantco Equipment

            18.1.6.1. Overview

            18.1.6.2. Product Portfolio

            18.1.6.3. Profitability by Market Segments (Product/Channel/Region)

            18.1.6.4. Sales Footprint

            18.1.6.5. Strategy Overview

                18.1.6.5.1. Marketing Strategy

                18.1.6.5.2. Product Strategy

                18.1.6.5.3. Channel Strategy

        18.1.7. Admiral Craft Equipment

            18.1.7.1. Overview

            18.1.7.2. Product Portfolio

            18.1.7.3. Profitability by Market Segments (Product/Channel/Region)

            18.1.7.4. Sales Footprint

            18.1.7.5. Strategy Overview

                18.1.7.5.1. Marketing Strategy

                18.1.7.5.2. Product Strategy

                18.1.7.5.3. Channel Strategy

        18.1.8. Deuster

            18.1.8.1. Overview

            18.1.8.2. Product Portfolio

            18.1.8.3. Profitability by Market Segments (Product/Channel/Region)

            18.1.8.4. Sales Footprint

            18.1.8.5. Strategy Overview

                18.1.8.5.1. Marketing Strategy

                18.1.8.5.2. Product Strategy

                18.1.8.5.3. Channel Strategy

        18.1.9. Semak Australia .

            18.1.9.1. Overview

            18.1.9.2. Product Portfolio

            18.1.9.3. Profitability by Market Segments (Product/Channel/Region)

            18.1.9.4. Sales Footprint

            18.1.9.5. Strategy Overview

                18.1.9.5.1. Marketing Strategy

                18.1.9.5.2. Product Strategy

                18.1.9.5.3. Channel Strategy

        18.1.10. Sirman

            18.1.10.1. Overview

            18.1.10.2. Product Portfolio

            18.1.10.3. Profitability by Market Segments (Product/Channel/Region)

            18.1.10.4. Sales Footprint

            18.1.10.5. Strategy Overview

                18.1.10.5.1. Marketing Strategy

                18.1.10.5.2. Product Strategy

                18.1.10.5.3. Channel Strategy

        18.1.11. Pratt's Direct

            18.1.11.1. Overview

            18.1.11.2. Product Portfolio

            18.1.11.3. Profitability by Market Segments (Product/Channel/Region)

            18.1.11.4. Sales Footprint

            18.1.11.5. Strategy Overview

                18.1.11.5.1. Marketing Strategy

                18.1.11.5.2. Product Strategy

                18.1.11.5.3. Channel Strategy

        18.1.12. Roller Auctions

            18.1.12.1. Overview

            18.1.12.2. Product Portfolio

            18.1.12.3. Profitability by Market Segments (Product/Channel/Region)

            18.1.12.4. Sales Footprint

            18.1.12.5. Strategy Overview

                18.1.12.5.1. Marketing Strategy

                18.1.12.5.2. Product Strategy

                18.1.12.5.3. Channel Strategy

        18.1.13. Gold Medal

            18.1.13.1. Overview

            18.1.13.2. Product Portfolio

            18.1.13.3. Profitability by Market Segments (Product/Channel/Region)

            18.1.13.4. Sales Footprint

            18.1.13.5. Strategy Overview

                18.1.13.5.1. Marketing Strategy

                18.1.13.5.2. Product Strategy

                18.1.13.5.3. Channel Strategy

        18.1.14. Cretors

            18.1.14.1. Overview

            18.1.14.2. Product Portfolio

            18.1.14.3. Profitability by Market Segments (Product/Channel/Region)

            18.1.14.4. Sales Footprint

            18.1.14.5. Strategy Overview

                18.1.14.5.1. Marketing Strategy

                18.1.14.5.2. Product Strategy

                18.1.14.5.3. Channel Strategy

        18.1.15. ANVIL WORLD

            18.1.15.1. Overview

            18.1.15.2. Product Portfolio

            18.1.15.3. Profitability by Market Segments (Product/Channel/Region)

            18.1.15.4. Sales Footprint

            18.1.15.5. Strategy Overview

                18.1.15.5.1. Marketing Strategy

                18.1.15.5.2. Product Strategy

                18.1.15.5.3. Channel Strategy

        18.1.16. Roband Australia

            18.1.16.1. Overview

            18.1.16.2. Product Portfolio

            18.1.16.3. Profitability by Market Segments (Product/Channel/Region)

            18.1.16.4. Sales Footprint

            18.1.16.5. Strategy Overview

                18.1.16.5.1. Marketing Strategy

                18.1.16.5.2. Product Strategy

                18.1.16.5.3. Channel Strategy

19. Assumptions and Acronyms Used

20. Research Methodology

List of Tables

Table 01: Global Market Value (US$ Million) Forecast by Region, 2018 to 2033

Table 02: Global Market Volume (Units) Forecast by Region, 2018 to 2033

Table 03: Global Market Value (US$ Million) Forecast by Product Type, 2018 to 2033

Table 04: Global Market Volume (Units) Forecast by Product Type, 2018 to 2033

Table 05: Global Market Value (US$ Million) Forecast by Capacity, 2018 to 2033

Table 06: Global Market Volume (Units) Forecast by Capacity, 2018 to 2033

Table 07: Global Market Value (US$ Million) Forecast by End User, 2018 to 2033

Table 08: Global Market Volume (Units) Forecast by End User, 2018 to 2033

Table 09: North America Market Value (US$ Million) Forecast by Country, 2018 to 2033

Table 10: North America Market Volume (Units) Forecast by Country, 2018 to 2033

Table 11: North America Market Value (US$ Million) Forecast by Product Type, 2018 to 2033

Table 12: North America Market Volume (Units) Forecast by Product Type, 2018 to 2033

Table 13: North America Market Value (US$ Million) Forecast by Capacity, 2018 to 2033

Table 14: North America Market Volume (Units) Forecast by Capacity, 2018 to 2033

Table 15: North America Market Value (US$ Million) Forecast by End User, 2018 to 2033

Table 16: North America Market Volume (Units) Forecast by End User, 2018 to 2033

Table 17: Latin America Market Value (US$ Million) Forecast by Country, 2018 to 2033

Table 18: Latin America Market Volume (Units) Forecast by Country, 2018 to 2033

Table 19: Latin America Market Value (US$ Million) Forecast by Product Type, 2018 to 2033

Table 20: Latin America Market Volume (Units) Forecast by Product Type, 2018 to 2033

Table 21: Latin America Market Value (US$ Million) Forecast by Capacity, 2018 to 2033

Table 22: Latin America Market Volume (Units) Forecast by Capacity, 2018 to 2033

Table 23: Latin America Market Value (US$ Million) Forecast by End User, 2018 to 2033

Table 24: Latin America Market Volume (Units) Forecast by End User, 2018 to 2033

Table 25: Europe Market Value (US$ Million) Forecast by Country, 2018 to 2033

Table 26: Europe Market Volume (Units) Forecast by Country, 2018 to 2033

Table 27: Europe Market Value (US$ Million) Forecast by Product Type, 2018 to 2033

Table 28: Europe Market Volume (Units) Forecast by Product Type, 2018 to 2033

Table 29: Europe Market Value (US$ Million) Forecast by Capacity, 2018 to 2033

Table 30: Europe Market Volume (Units) Forecast by Capacity, 2018 to 2033

Table 31: Europe Market Value (US$ Million) Forecast by End User, 2018 to 2033

Table 32: Europe Market Volume (Units) Forecast by End User, 2018 to 2033

Table 33: East Asia Market Value (US$ Million) Forecast by Country, 2018 to 2033

Table 34: East Asia Market Volume (Units) Forecast by Country, 2018 to 2033

Table 35: East Asia Market Value (US$ Million) Forecast by Product Type, 2018 to 2033

Table 36: East Asia Market Volume (Units) Forecast by Product Type, 2018 to 2033

Table 37: East Asia Market Value (US$ Million) Forecast by Capacity, 2018 to 2033

Table 38: East Asia Market Volume (Units) Forecast by Capacity, 2018 to 2033

Table 39: East Asia Market Value (US$ Million) Forecast by End User, 2018 to 2033

Table 40: East Asia Market Volume (Units) Forecast by End User, 2018 to 2033

Table 41: South Asia Market Value (US$ Million) Forecast by Country, 2018 to 2033

Table 42: South Asia Market Volume (Units) Forecast by Country, 2018 to 2033

Table 43: South Asia Market Value (US$ Million) Forecast by Product Type, 2018 to 2033

Table 44: South Asia Market Volume (Units) Forecast by Product Type, 2018 to 2033

Table 45: South Asia Market Value (US$ Million) Forecast by Capacity, 2018 to 2033

Table 46: South Asia Market Volume (Units) Forecast by Capacity, 2018 to 2033

Table 47: South Asia Market Value (US$ Million) Forecast by End User, 2018 to 2033

Table 48: South Asia Market Volume (Units) Forecast by End User, 2018 to 2033

Table 49: Oceania Market Value (US$ Million) Forecast by Country, 2018 to 2033

Table 50: Oceania Market Volume (Units) Forecast by Country, 2018 to 2033

Table 51: Oceania Market Value (US$ Million) Forecast by Product Type, 2018 to 2033

Table 52: Oceania Market Volume (Units) Forecast by Product Type, 2018 to 2033

Table 53: Oceania Market Value (US$ Million) Forecast by Capacity, 2018 to 2033

Table 54: Oceania Market Volume (Units) Forecast by Capacity, 2018 to 2033

Table 55: Oceania Market Value (US$ Million) Forecast by End User, 2018 to 2033

Table 56: Oceania Market Volume (Units) Forecast by End User, 2018 to 2033

Table 57: MEA Market Value (US$ Million) Forecast by Country, 2018 to 2033

Table 58: MEA Market Volume (Units) Forecast by Country, 2018 to 2033

Table 59: MEA Market Value (US$ Million) Forecast by Product Type, 2018 to 2033

Table 60: MEA Market Volume (Units) Forecast by Product Type, 2018 to 2033

Table 61: MEA Market Value (US$ Million) Forecast by Capacity, 2018 to 2033

Table 62: MEA Market Volume (Units) Forecast by Capacity, 2018 to 2033

Table 63: MEA Market Value (US$ Million) Forecast by End User, 2018 to 2033

Table 64: MEA Market Volume (Units) Forecast by End User, 2018 to 2033

Table 65: USA Market Value (US$ Million) Forecast by Product Type, Capacity, and End User (2023(E) & 2033(F))

Table 66: Brazil Market Value (US$ Million) Forecast by Product Type, Capacity, and End User (2023(E) & 2033(F))

Table 67: Mexico Market Value (US$ Million) Forecast by Product Type, Capacity, and End User (2023(E) & 2033(F))

Table 68: Germany Market Value (US$ Million) Forecast by Product Type, Capacity, and End User (2023(E) & 2033(F))

Table 69: Italy Market Value (US$ Million) Forecast by Product Type, Capacity, and End User (2023(E) & 2033(F))

Table 70: France Market Value (US$ Million) Forecast by Product Type, Capacity, and End User (2023(E) & 2033(F))

Table 71: Spain Market Value (US$ Million) Forecast by Product Type, Capacity, and End User (2023(E) & 2033(F))

Table 72: UK Market Value (US$ Million) Forecast by Product Type, Capacity, and End User (2023(E) & 2033(F))

Table 73: China Market Value (US$ Million) Forecast by Product Type, Capacity, and End User (2023(E) & 2033(F))

Table 74: Japan Market Value (US$ Million) Forecast by Product Type, Capacity, and End User (2023(E) & 2033(F))

Table 75: India Market Value (US$ Million) Forecast by Product Type, Capacity, and End User (2023(E) & 2033(F))

Table 76: Australia Market Value (US$ Million) Forecast by Product Type, Capacity, and End User (2023(E) & 2033(F))

List of Charts

Figure 01: Global Market Value (US$ Million) by Product Type, 2023 to 2033

Figure 02: Global Market Value (US$ Million) by Capacity, 2023 to 2033

Figure 03: Global Market Value (US$ Million) by End User, 2023 to 2033

Figure 04: Global Market Value (US$ Million) by Region, 2023 to 2033

Figure 05: Global Market Value (US$ Million) Analysis by Region, 2018 to 2022

Figure 06: Global Market Volume (Units) Analysis by Region, 2018 to 2033

Figure 07: Global Market Value Share (%) and BPS Analysis by Region, 2023 to 2033

Figure 08: Global Market Y-o-Y Growth (%) Projections by Region, 2023 to 2033

Figure 09: Global Market Value (US$ Million) Analysis by Product Type, 2018 to 2022

Figure 10: Global Market Volume (Units) Analysis by Product Type, 2018 to 2033

Figure 11: Global Market Value Share (%) and BPS Analysis by Product Type, 2023 to 2033

Figure 12: Global Market Y-o-Y Growth (%) Projections by Product Type, 2023 to 2033

Figure 13: Global Market Value (US$ Million) Analysis by Capacity, 2018 to 2022

Figure 14: Global Market Volume (Units) Analysis by Capacity, 2018 to 2033

Figure 15: Global Market Value Share (%) and BPS Analysis by Capacity, 2023 to 2033

Figure 16: Global Market Y-o-Y Growth (%) Projections by Capacity, 2023 to 2033

Figure 17: Global Market Value (US$ Million) Analysis by End User, 2018 to 2022

Figure 18: Global Market Volume (Units) Analysis by End User, 2018 to 2033

Figure 19: Global Market Value Share (%) and BPS Analysis by End User, 2023 to 2033

Figure 20: Global Market Y-o-Y Growth (%) Projections by End User, 2023 to 2033

Figure 21: Global Market Attractiveness by Product Type, 2023 to 2033

Figure 22: Global Market Attractiveness by Capacity, 2023 to 2033

Figure 23: Global Market Attractiveness by Capacity, 2023 to 2033

Figure 24: Global Market Attractiveness by End User, 2023 to 2033

Figure 25: Global Market Attractiveness by Region, 2023 to 2033

Figure 26: North America Market Value (US$ Million) by Product Type, 2023 to 2033

Figure 27: North America Market Value (US$ Million) by Capacity, 2023 to 2033

Figure 28: North America Market Value (US$ Million) by End User, 2023 to 2033

Figure 29: North America Market Value (US$ Million) by Country, 2023 to 2033

Figure 30: North America Market Value (US$ Million) Analysis by Country, 2018 to 2022

Figure 31: North America Market Volume (Units) Analysis by Country, 2018 to 2033

Figure 32: North America Market Value Share (%) and BPS Analysis by Country, 2023 to 2033

Figure 33: North America Market Y-o-Y Growth (%) Projections by Country, 2023 to 2033

Figure 34: North America Market Value (US$ Million) Analysis by Product Type, 2018 to 2022

Figure 35: North America Market Volume (Units) Analysis by Product Type, 2018 to 2033

Figure 36: North America Market Value Share (%) and BPS Analysis by Product Type, 2023 to 2033

Figure 37: North America Market Y-o-Y Growth (%) Projections by Product Type, 2023 to 2033

Figure 38: North America Market Value (US$ Million) Analysis by Capacity, 2018 to 2022

Figure 39: North America Market Volume (Units) Analysis by Capacity, 2018 to 2033

Figure 40: North America Market Value Share (%) and BPS Analysis by Capacity, 2023 to 2033

Figure 41: North America Market Y-o-Y Growth (%) Projections by Capacity, 2023 to 2033

Figure 42: North America Market Value (US$ Million) Analysis by End User, 2018 to 2022

Figure 43: North America Market Volume (Units) Analysis by End User, 2018 to 2033

Figure 44: North America Market Value Share (%) and BPS Analysis by End User, 2023 to 2033

Figure 45: North America Market Y-o-Y Growth (%) Projections by End User, 2023 to 2033

Figure 46: North America Market Attractiveness by Product Type, 2023 to 2033

Figure 47: North America Market Attractiveness by Capacity, 2023 to 2033

Figure 48: North America Market Attractiveness by End User, 2023 to 2033

Figure 49: North America Market Attractiveness by Country, 2023 to 2033

Figure 50: Latin America Market Value (US$ Million) by Product Type, 2023 to 2033

Figure 51: Latin America Market Value (US$ Million) by Capacity, 2023 to 2033

Figure 52: Latin America Market Value (US$ Million) by End User, 2023 to 2033

Figure 53: Latin America Market Value (US$ Million) by Country, 2023 to 2033

Figure 54: Latin America Market Value (US$ Million) Analysis by Country, 2018 to 2022

Figure 55: Latin America Market Volume (Units) Analysis by Country, 2018 to 2033

Figure 56: Latin America Market Value Share (%) and BPS Analysis by Country, 2023 to 2033

Figure 57: Latin America Market Y-o-Y Growth (%) Projections by Country, 2023 to 2033

Figure 58: Latin America Market Value (US$ Million) Analysis by Product Type, 2018 to 2022

Figure 59: Latin America Market Volume (Units) Analysis by Product Type, 2018 to 2033

Figure 60: Latin America Market Value Share (%) and BPS Analysis by Product Type, 2023 to 2033

Figure 61: Latin America Market Y-o-Y Growth (%) Projections by Product Type, 2023 to 2033

Figure 62: Latin America Market Value (US$ Million) Analysis by Capacity, 2018 to 2022

Figure 63: Latin America Market Volume (Units) Analysis by Capacity, 2018 to 2033

Figure 64: Latin America Market Value Share (%) and BPS Analysis by Capacity, 2023 to 2033

Figure 65: Latin America Market Y-o-Y Growth (%) Projections by Capacity, 2023 to 2033

Figure 66: Latin America Market Value (US$ Million) Analysis by End User, 2018 to 2022

Figure 67: Latin America Market Volume (Units) Analysis by End User, 2018 to 2033

Figure 68: Latin America Market Value Share (%) and BPS Analysis by End User, 2023 to 2033

Figure 69: Latin America Market Y-o-Y Growth (%) Projections by End User, 2023 to 2033

Figure 70: Latin America Market Attractiveness by Product Type, 2023 to 2033

Figure 71: Latin America Market Attractiveness by Capacity, 2023 to 2033

Figure 72: Latin America Market Attractiveness by End User, 2023 to 2033

Figure 73: Latin America Market Attractiveness by Country, 2023 to 2033

Figure 74: Europe Market Value (US$ Million) by Product Type, 2023 to 2033

Figure 75: Europe Market Value (US$ Million) by Capacity, 2023 to 2033

Figure 76: Europe Market Value (US$ Million) by End User, 2023 to 2033

Figure 77: Europe Market Value (US$ Million) by Country, 2023 to 2033

Figure 78: Europe Market Value (US$ Million) Analysis by Country, 2018 to 2022

Figure 79: Europe Market Volume (Units) Analysis by Country, 2018 to 2033

Figure 80: Europe Market Value Share (%) and BPS Analysis by Country, 2023 to 2033

Figure 81: Europe Market Y-o-Y Growth (%) Projections by Country, 2023 to 2033

Figure 82: Europe Market Value (US$ Million) Analysis by Product Type, 2018 to 2022

Figure 83: Europe Market Volume (Units) Analysis by Product Type, 2018 to 2033

Figure 84: Europe Market Value Share (%) and BPS Analysis by Product Type, 2023 to 2033

Figure 85: Europe Market Y-o-Y Growth (%) Projections by Product Type, 2023 to 2033

Figure 86: Europe Market Value (US$ Million) Analysis by Capacity, 2018 to 2022

Figure 87: Europe Market Volume (Units) Analysis by Capacity, 2018 to 2033

Figure 88: Europe Market Value Share (%) and BPS Analysis by Capacity, 2023 to 2033

Figure 89: Europe Market Y-o-Y Growth (%) Projections by Capacity, 2023 to 2033

Figure 90: Europe Market Value (US$ Million) Analysis by End User, 2018 to 2022

Figure 91: Europe Market Volume (Units) Analysis by End User, 2018 to 2033

Figure 92: Europe Market Value Share (%) and BPS Analysis by End User, 2023 to 2033

Figure 93: Europe Market Y-o-Y Growth (%) Projections by End User, 2023 to 2033

Figure 94: Europe Market Attractiveness by Product Type, 2023 to 2033

Figure 95: Europe Market Attractiveness by Capacity, 2023 to 2033

Figure 96: Europe Market Attractiveness by End User, 2023 to 2033

Figure 97: Europe Market Attractiveness by Country, 2023 to 2033

Figure 98: East Asia Market Value (US$ Million) by Product Type, 2023 to 2033

Figure 99: East Asia Market Value (US$ Million) by Capacity, 2023 to 2033

Figure 100: East Asia Market Value (US$ Million) by End User, 2023 to 2033

Figure 101: East Asia Market Value (US$ Million) by Country, 2023 to 2033

Figure 102: East Asia Market Value (US$ Million) Analysis by Country, 2018 to 2022

Figure 103: East Asia Market Volume (Units) Analysis by Country, 2018 to 2033

Figure 104: East Asia Market Value Share (%) and BPS Analysis by Country, 2023 to 2033

Figure 105: East Asia Market Y-o-Y Growth (%) Projections by Country, 2023 to 2033

Figure 106: East Asia Market Value (US$ Million) Analysis by Product Type, 2018 to 2022

Figure 107: East Asia Market Volume (Units) Analysis by Product Type, 2018 to 2033

Figure 108: East Asia Market Value Share (%) and BPS Analysis by Product Type, 2023 to 2033

Figure 109: East Asia Market Y-o-Y Growth (%) Projections by Product Type, 2023 to 2033

Figure 110: East Asia Market Value (US$ Million) Analysis by Capacity, 2018 to 2022

Figure 111: East Asia Market Volume (Units) Analysis by Capacity, 2018 to 2033

Figure 112: East Asia Market Value Share (%) and BPS Analysis by Capacity, 2023 to 2033

Figure 113: East Asia Market Y-o-Y Growth (%) Projections by Capacity, 2023 to 2033

Figure 114: East Asia Market Value (US$ Million) Analysis by End User, 2018 to 2022

Figure 115: East Asia Market Volume (Units) Analysis by End User, 2018 to 2033

Figure 116: East Asia Market Value Share (%) and BPS Analysis by End User, 2023 to 2033

Figure 117: East Asia Market Y-o-Y Growth (%) Projections by End User, 2023 to 2033

Figure 118: East Asia Market Attractiveness by Product Type, 2023 to 2033

Figure 119: East Asia Market Attractiveness by Capacity, 2023 to 2033

Figure 120: East Asia Market Attractiveness by End User, 2023 to 2033

Figure 121: East Asia Market Attractiveness by Country, 2023 to 2033

Figure 122: South Asia Market Value (US$ Million) by Product Type, 2023 to 2033

Figure 123: South Asia Market Value (US$ Million) by Capacity, 2023 to 2033

Figure 124: South Asia Market Value (US$ Million) by End User, 2023 to 2033

Figure 125: South Asia Market Value (US$ Million) by Country, 2023 to 2033

Figure 126: South Asia Market Value (US$ Million) Analysis by Country, 2018 to 2022

Figure 127: South Asia Market Volume (Units) Analysis by Country, 2018 to 2033

Figure 128: South Asia Market Value Share (%) and BPS Analysis by Country, 2023 to 2033

Figure 129: South Asia Market Y-o-Y Growth (%) Projections by Country, 2023 to 2033

Figure 130: South Asia Market Value (US$ Million) Analysis by Product Type, 2018 to 2022

Figure 131: South Asia Market Volume (Units) Analysis by Product Type, 2018 to 2033

Figure 132: South Asia Market Value Share (%) and BPS Analysis by Product Type, 2023 to 2033

Figure 133: South Asia Market Y-o-Y Growth (%) Projections by Product Type, 2023 to 2033

Figure 134: South Asia Market Value (US$ Million) Analysis by Capacity, 2018 to 2022

Figure 135: South Asia Market Volume (Units) Analysis by Capacity, 2018 to 2033

Figure 136: South Asia Market Value Share (%) and BPS Analysis by Capacity, 2023 to 2033

Figure 137: South Asia Market Y-o-Y Growth (%) Projections by Capacity, 2023 to 2033

Figure 138: South Asia Market Value (US$ Million) Analysis by End User, 2018 to 2022

Figure 139: South Asia Market Volume (Units) Analysis by End User, 2018 to 2033

Figure 140: South Asia Market Value Share (%) and BPS Analysis by End User, 2023 to 2033

Figure 141: South Asia Market Y-o-Y Growth (%) Projections by End User, 2023 to 2033

Figure 142: South Asia Market Attractiveness by Product Type, 2023 to 2033

Figure 143: South Asia Market Attractiveness by Capacity, 2023 to 2033

Figure 144: South Asia Market Attractiveness by End User, 2023 to 2033

Figure 145: South Asia Market Attractiveness by Country, 2023 to 2033

Figure 146: Oceania Market Value (US$ Million) by Product Type, 2023 to 2033

Figure 147: Oceania Market Value (US$ Million) by Capacity, 2023 to 2033

Figure 148: Oceania Market Value (US$ Million) by End User, 2023 to 2033

Figure 149: Oceania Market Value (US$ Million) by Country, 2023 to 2033

Figure 150: Oceania Market Value (US$ Million) Analysis by Country, 2018 to 2022

Figure 151: Oceania Market Volume (Units) Analysis by Country, 2018 to 2033

Figure 152: Oceania Market Value Share (%) and BPS Analysis by Country, 2023 to 2033

Figure 153: Oceania Market Y-o-Y Growth (%) Projections by Country, 2023 to 2033

Figure 154: Oceania Market Value (US$ Million) Analysis by Product Type, 2018 to 2022

Figure 155: Oceania Market Volume (Units) Analysis by Product Type, 2018 to 2033

Figure 156: Oceania Market Value Share (%) and BPS Analysis by Product Type, 2023 to 2033

Figure 157: Oceania Market Y-o-Y Growth (%) Projections by Product Type, 2023 to 2033

Figure 158: Oceania Market Value (US$ Million) Analysis by Capacity, 2018 to 2022

Figure 159: Oceania Market Volume (Units) Analysis by Capacity, 2018 to 2033

Figure 160: Oceania Market Value Share (%) and BPS Analysis by Capacity, 2023 to 2033

Figure 161: Oceania Market Y-o-Y Growth (%) Projections by Capacity, 2023 to 2033

Figure 162: Oceania Market Value (US$ Million) Analysis by End User, 2018 to 2022

Figure 163: Oceania Market Volume (Units) Analysis by End User, 2018 to 2033

Figure 164: Oceania Market Value Share (%) and BPS Analysis by End User, 2023 to 2033

Figure 165: Oceania Market Y-o-Y Growth (%) Projections by End User, 2023 to 2033

Figure 166: Oceania Market Attractiveness by Product Type, 2023 to 2033

Figure 167: Oceania Market Attractiveness by Capacity, 2023 to 2033

Figure 168: Oceania Market Attractiveness by End User, 2023 to 2033

Figure 169 Oceania Market Attractiveness by Country, 2023 to 2033

Figure 170: MEA Market Value (US$ Million) by Product Type, 2023 to 2033

Figure 171: MEA Market Value (US$ Million) by Capacity, 2023 to 2033

Figure 172: MEA Market Value (US$ Million) by End User, 2023 to 2033

Figure 173: MEA Market Value (US$ Million) by Country, 2023 to 2033

Figure 174: MEA Market Value (US$ Million) Analysis by Country, 2018 to 2022

Figure 175: MEA Market Volume (Units) Analysis by Country, 2018 to 2033

Figure 176: MEA Market Value Share (%) and BPS Analysis by Country, 2023 to 2033

Figure 177: MEA Market Y-o-Y Growth (%) Projections by Country, 2023 to 2033

Figure 178: MEA Market Value (US$ Million) Analysis by Product Type, 2018 to 2022

Figure 179: MEA Market Volume (Units) Analysis by Product Type, 2018 to 2033

Figure 180: MEA Market Value Share (%) and BPS Analysis by Product Type, 2023 to 2033

Figure 181: MEA Market Y-o-Y Growth (%) Projections by Product Type, 2023 to 2033

Figure 182: MEA Market Value (US$ Million) Analysis by Capacity, 2018 to 2022

Figure 183: MEA Market Volume (Units) Analysis by Capacity, 2018 to 2033

Figure 184: MEA Market Value Share (%) and BPS Analysis by Capacity, 2023 to 2033

Figure 185: MEA Market Y-o-Y Growth (%) Projections by Capacity, 2023 to 2033

Figure 186: MEA Market Value (US$ Million) Analysis by End User, 2018 to 2022

Figure 187: MEA Market Volume (Units) Analysis by End User, 2018 to 2033

Figure 188: MEA Market Value Share (%) and BPS Analysis by End User, 2023 to 2033

Figure 189: MEA Market Y-o-Y Growth (%) Projections by End User, 2023 to 2033

Figure 190: MEA Market Attractiveness by Product Type, 2023 to 2033

Figure 191: MEA Market Attractiveness by Capacity, 2023 to 2033

Figure 192: MEA Market Attractiveness by End User, 2023 to 2033

Figure 193 MEA Market Attractiveness by Country, 2023 to 2033

Explore Process Automation Insights

View Reports

Commercial Hot Dog Cooker Market