The Commercial Dishwasher Market is estimated to be valued at USD 1061.3 million in 2025 and is projected to reach USD 1664.0 million by 2035, registering a compound annual growth rate (CAGR) of 4.6% over the forecast period.
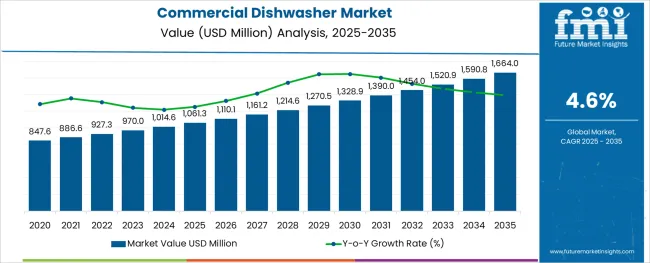
The commercial dishwasher market is witnessing sustained growth as foodservice establishments prioritize hygiene, operational efficiency, and sustainability. Rising health and safety standards, coupled with labor shortages in hospitality, have accelerated the adoption of automated dishwashing solutions.
Restaurants, hotels, and institutional kitchens are increasingly opting for machines that reduce water and energy consumption while ensuring consistent sanitation levels. Technological advancements in sensors, heat recovery, and eco-friendly detergents are making modern dishwashers more appealing, enabling lower total cost of ownership over time.
The future outlook remains positive, supported by expansion in the foodservice industry, stricter compliance with cleanliness regulations, and the push for environmentally responsible operations. Manufacturers are responding to evolving customer expectations by offering machines that blend high throughput with intuitive controls, paving the path for broader adoption across diverse end user segments.
The market is segmented by Product Type, Model, End User, and Distribution Channel and region. By Product Type, the market is divided into Rack/Conveyor, Undercounter, Door or Hood Type, and Glasswashers. In terms of Model, the market is classified into High Temperature and Low Temperature. Based on End User, the market is segmented into Restaurants, Hotels, and Others. By Distribution Channel, the market is divided into Offline and Online. Regionally, the market is classified into North America, Latin America, Western Europe, Eastern Europe, Balkan & Baltic Countries, Russia & Belarus, Central Asia, East Asia, South Asia & Pacific, and the Middle East & Africa.
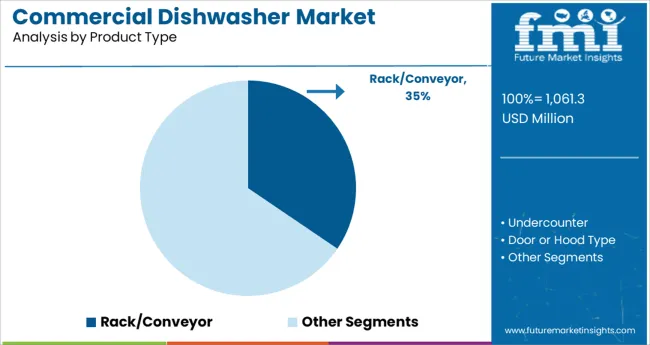
When segmented by product type, the rack conveyor segment is anticipated to account for 34∙5% of the commercial dishwasher market revenue in 2025, securing its position as the leading product type. This dominance has been shaped by its ability to handle high volumes of dishware efficiently within limited kitchen spaces, making it well suited for busy operations.
Its modular design and linear workflow have facilitated easy integration into existing kitchen layouts while supporting scalability as operational demands grow. Durability, combined with the capacity to wash multiple racks per hour with minimal manual intervention, has made it a preferred choice for large foodservice environments.
Enhanced efficiency and lower labor dependency have contributed to maintaining its leadership within product offerings, particularly where high throughput and space optimization are critical.
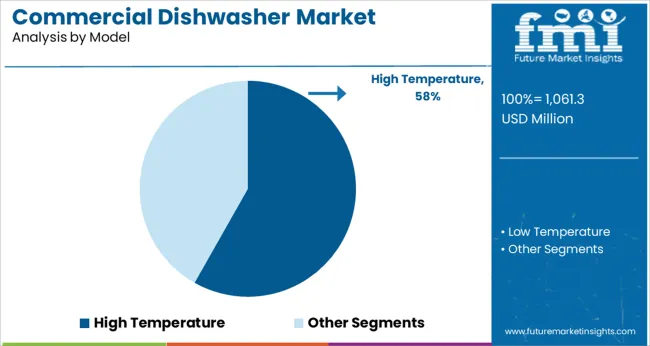
When segmented by model, the high temperature category is projected to hold 58∙2% of the commercial dishwasher market revenue in 2025, reinforcing its leadership. This position has been strengthened by its proven effectiveness in achieving superior sanitization without relying heavily on chemical agents.
High temperature models have been favored in environments where stringent hygiene standards are mandatory, as they ensure rapid removal of grease and pathogens through elevated water temperatures. Enhanced drying capabilities and faster cycle times, enabled by built in booster heaters, have added to their appeal by increasing turnaround speed and improving overall kitchen productivity.
Operational reliability and compliance with health codes have further contributed to the segment’s sustained prominence in professional settings that demand uncompromising cleanliness.
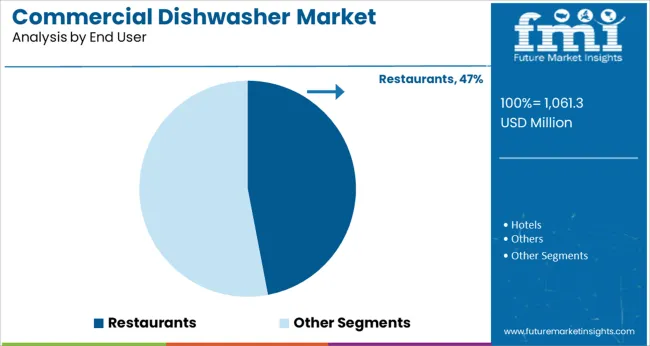
When segmented by end user, the restaurant segment is expected to command 47% of the commercial dishwasher market revenue in 2025, maintaining its top rank. This leadership has been driven by the restaurant industry’s scale and its acute need for fast, hygienic dishwashing solutions in high traffic environments.
The increasing focus on customer satisfaction and food safety has encouraged operators to adopt machines that ensure spotless results while reducing reliance on manual labor. Restaurants have also benefited from compact and energy efficient models that fit seamlessly into limited back of house spaces while meeting peak demand efficiently.
Competitive pressures to maintain high standards and comply with health regulations have reinforced the restaurant sector’s role as the largest contributor to the commercial dishwasher market, underlining its critical need for reliable and high performing dishwashing equipment.
The global Commercial dishwasher market was thriving at a CAGR of 1.8% between 2020 and 2025. The comparatively lower CAGR was attributed to the complete shutdown of the restaurant and other eateries. The lockdowns implemented by the government did damage a wide range of markets including FMCG equipment and tools-related market such as the commercial dishwasher market.
Since there were no people outside, the spread of human touch also made people avoid outside food. Almost no social gatherings affected the growth of the commercial dishwasher market. However, the restored travel and hospitality industry has pushed the commercial dishwasher market up and increased the CAGR to 4.6% from 2025 to 2035. The market holds multiple opportunities for the market as new vendors enter the market loop with unique and efficient cleaning technology. The high cost associated with these dishwashers might affect the sales prospects of the commercial dishwashers market.
The rising demand for Commercial dishwashers is attributed to three major factors: restoration of the travel and hospitality sector, advanced and efficient technology penetrating, and the improved lifestyle with the rise in per capita income. As new hotels, restaurants, and eateries open their chains in emerging regions, the demand for quick dishwashing becomes important. Thus, the commercial dishwasher market rises with the utmost future possibilities.
People with increased incomes look for a comforting lifestyle so they adopt different tools that ease their daily chores such as dishwashing, laundry, etc. This expands the commercial dishwasher market size. Furthermore, the expanding small-scale food businesses such as small cafes are adopting this technology to reduce manpower and overall capital investment. Small and easily fitted commercial dishwashers are in high demand as they occupy less space while washing the same number of dishes in a limited amount of time.
The major restraints for the market are the highly-priced dishwashers along with the costly maintenance and repair cost of commercial dishwashers. The conventional way of dishwashing also restricts the expansion of commercial dishwashers while the extremely high price is the major roadblock for the market.
The product type category is divided into segments like under-counter, door or hood type, rack/conveyor and glasswasher, etc. The rack/conveyor segment is expected to hold the biggest market share at 46.3% during the forecast period. The factors due to its higher traction are the higher applications in restaurants and hotels. The higher efficiency, dish-holding capacity, and speed provided. The rack conveyor dishwasher generally has more than 1000 dish capacities in it.
The end user category is divided into segments like hotels and restaurants. The restaurant segment is expected to hold the biggest market share at 53.9% during the forecast period. Mid and big-sized restaurants have high footfall that consumes a huge number of dishes. Thus, restaurants require machines to work on the pile of dishes.
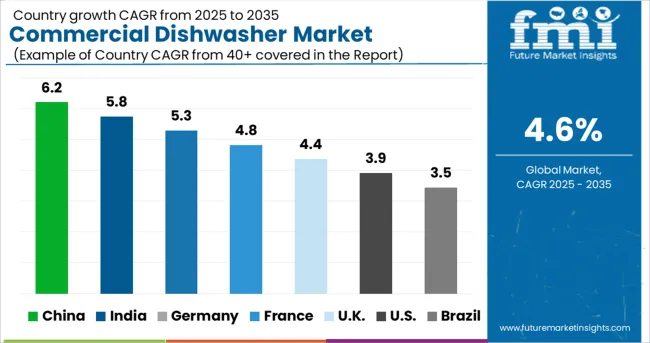
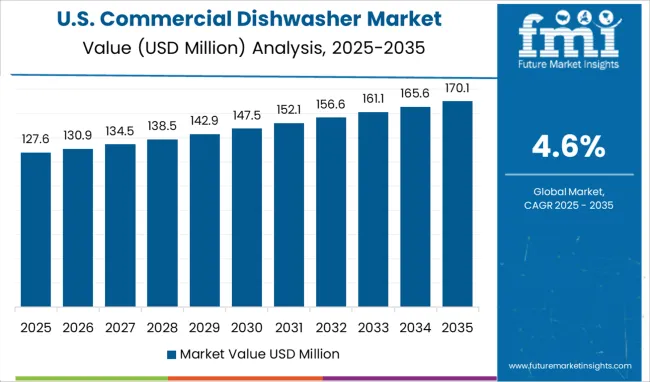
The USA is expected to hold a share of the market share of 15.3% during the forecast period. The higher market share is attributed to the restoration of the food and beverage industry along with small businesses expanding their food outlet chains. Furthermore, the US government’s support of small businesses with tax cuts provided them the edge to adopt the latest technologies that help them gain more business.
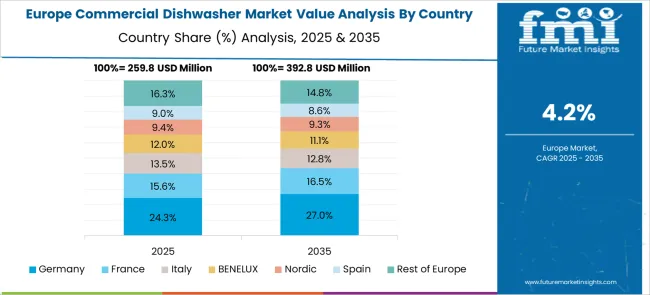
Germany with its world-famous tourist spots related to post-cold war-themed restaurants and cafes is following a steady growth rate while holding a market share of 4.6%. Europe is known for its hospitality with culturally enriched cafes, hotels, and restaurants. Thus, the highly dense food outlets require automated machines for on-touch dishwashing, expanding the global commercial dishwasher market.
India and China both have built their hospitality infrastructure and modernized their kitchens. While China’s food industry blooms with globalization and its world-famous dishes, India transforms and replaces the FMCG industry with huge investments of business giants and the government supporting small businesses for the preservation of culturally rich cuisines. While India at expected to flourish at a CAGR of 8.0% during the forecast period, China thrives at a CAGR of 6.7% between 2025 and 2035.
The UK focuses on replacing conventional dishwashers with advanced and efficient commercial dishwashers. The country expects a huge number of tourists along with the proliferating restaurants and cafes in different parts of the nation. The UK is anticipated to thrive at a CAGR of 4.2% during the forecast.
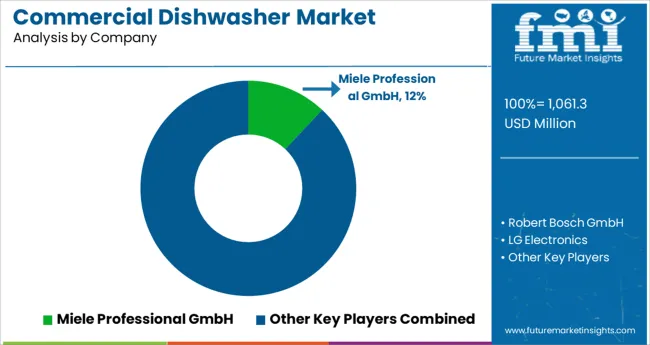
The competitors focus on creating efficient and high-capacity dishwashers that fit the pocket of small and mid-sized food businesses. Companies also make these generators reliable so that they can work for long hours and have a higher shelf-life. Furthermore, the key players adopt the strategy of acquisition, merger, and other expansionist tricks to strengthen their supply chain.
Recent Market Developments
| Attribute | Details |
|---|---|
| Forecast Period | 2025 to 2035 |
| Historical Data Available for | 2020 to 2025 |
| Market Analysis | million for Value and Units for Volume |
| Key Regions Covered | North America; Latin America; Europe; Asia Pacific; Oceania; and Middle East; and Africa |
| Key Countries Covered | USA, Canada, Mexico, Germany, UK, France, Italy, Spain, China, Japan, India, South Korea, Australia, Brazil, Argentina, South Africa, and UAE |
| Key Segments Covered | Product Type, Category, Distribution Channel, Applications, and Region |
| Key Companies Profiled | Robert Bosch GmbH; Huangshan Xingwei Reflectorized Material Co., Ltd.; HJ CORP; Reflectionight; Magna Colours; Champion Industries; insinger machine company; FAGOR Professional; Veetsan; LG Electronics; JLA, Electrolux Professional; Blakeslee Inc; COMENDA-ALI GROUP; ASKO APPLIANCES AB; Whirlpool Corporation; MVP Group Corp; Washtech Limited; Winterhalter Gastronom GmbH; Haier Group; AGA Rangemaster Limited; KAFF Appliances; Miele; SAMSUNG |
| Report Coverage | Market Forecast, Company Share Analysis, Competition Intelligence, Drivers, Restraints, Opportunities and Threats Analysis, Market Dynamics and Challenges, and Strategic Growth Initiatives |
| Customization & Pricing | Available upon Request |
The global commercial dishwasher market is estimated to be valued at USD 1,061.3 million in 2025.
It is projected to reach USD 1,664.0 million by 2035.
The market is expected to grow at a 4.6% CAGR between 2025 and 2035.
The key product types are rack/conveyor, undercounter, door or hood type and glasswashers.
high temperature segment is expected to dominate with a 58.2% industry share in 2025.


Full Research Suite comprises of:
Market outlook & trends analysis
Interviews & case studies
Strategic recommendations
Vendor profiles & capabilities analysis
5-year forecasts
8 regions and 60+ country-level data splits
Market segment data splits
12 months of continuous data updates
DELIVERED AS:
PDF EXCEL ONLINE
Commercial Blast Freezer Market Size and Share Forecast Outlook 2025 to 2035
Commercial Water Heater Market Size and Share Forecast Outlook 2025 to 2035
Commercial High-Speed Oven Market Size and Share Forecast Outlook 2025 to 2035
Commercial Turboprop Aircrafts Market Size and Share Forecast Outlook 2025 to 2035
Commercial Vehicle Foundation Brakes Market Size and Share Forecast Outlook 2025 to 2035
Commercial Vehicle Brake Chambers Market Size and Share Forecast Outlook 2025 to 2035
Commercial Vehicles LED Bar Lights Market Size and Share Forecast Outlook 2025 to 2035
Commercial Vehicle AMT Transmission Market Size and Share Forecast Outlook 2025 to 2035
Commercial Greenhouse Market Size and Share Forecast Outlook 2025 to 2035
Commercial Vessel Market Size and Share Forecast Outlook 2025 to 2035
Commercial Slush Machine Market Size and Share Forecast Outlook 2025 to 2035
Commercial Medium Voltage Distribution Panel Market Size and Share Forecast Outlook 2025 to 2035
Commercial Earth Observation (CEO) Market Size and Share Forecast Outlook 2025 to 2035
Commercial Ozone Generator Market Size and Share Forecast Outlook 2025 to 2035
Commercial Gas-Fired Boiler Market Size and Share Forecast Outlook 2025 to 2035
Commercial Deep Fryer Parts & Accessories Market Size and Share Forecast Outlook 2025 to 2035
Commercial Gas Restaurant Ranges Market Size and Share Forecast Outlook 2025 to 2035
Commercial Heat Pump Market Size and Share Forecast Outlook 2025 to 2035
Commercial Countertop Ranges Market Size and Share Forecast Outlook 2025 to 2035
Commercial Electric Restaurant Ranges Market Size and Share Forecast Outlook 2025 to 2035

Thank you!
You will receive an email from our Business Development Manager. Please be sure to check your SPAM/JUNK folder too.
Chat With
MaRIA