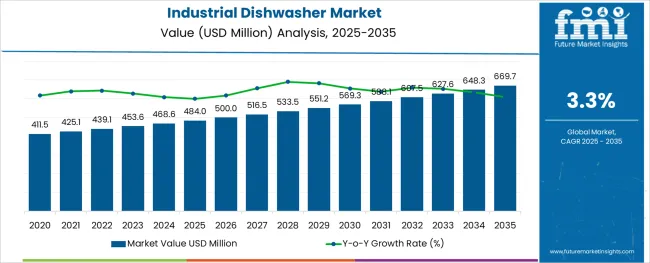
The Industrial Dishwasher Market is estimated to be valued at USD 484.0 million in 2025 and is projected to reach USD 669.7 million by 2035, registering a compound annual growth rate (CAGR) of 3.3% over the forecast period.
Insights into the Fully Automatic Technology Mechanism Segment
When segmented by technology mechanism, the fully automatic segment is projected to hold 58.70% of the total market revenue in 2025, making it the leading category. This leadership is attributed to the growing preference for hands-free, programmable, and high-throughput dishwashing solutions in commercial kitchens.
Fully automatic machines have been observed to reduce labor dependency and improve consistency in cleaning outcomes, addressing critical hygiene standards in food service and healthcare sectors. Their ability to integrate advanced features such as multi-cycle programs, energy recovery systems, and automated chemical dosing has enhanced their operational appeal.
The market is segmented by Technology/Mechanism, Type, Capacity, and Sales Channel and region. By Technology/Mechanism, the market is divided into Fully-automatic and Semi-automatic. In terms of Type, the market is classified into Conveyor, Undercounter, Hood, and Flight. Based on Capacity, the market is segmented into 50-200, <50, 200-500, and >500.
By Sales Channel, the market is divided into Offline and Online. Regionally, the market is classified into North America, Latin America, Western Europe, Eastern Europe, Balkan & Baltic Countries, Russia & Belarus, Central Asia, East Asia, South Asia & Pacific, and the Middle East & Africa.
When segmented by technology mechanism, the fully automatic segment is projected to hold 58.70% of the total market revenue in 2025, establishing itself as the dominant segment. This leadership is being attributed to the ability of fully automatic systems to streamline operations, reduce manual intervention, and ensure consistent sanitation outcomes.
Businesses have been increasingly relying on these systems to improve throughput while maintaining compliance with hygiene standards. Fully automatic machines are being preferred for their programmability, reduced water and energy consumption, and enhanced safety features that protect both workers and utensils. Operational efficiency and the ability to handle high volumes with minimal supervision have reinforced the appeal of this segment.
Advancements in control interfaces and integration with kitchen management systems have further strengthened its position as the preferred choice for industrial users seeking productivity and compliance.
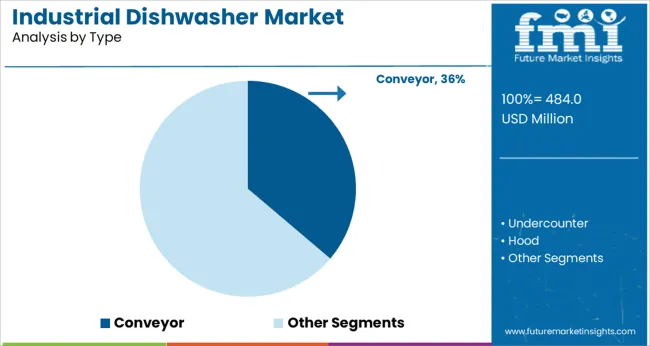
In terms of type, the conveyor segment is expected to capture 36.20% of the total market revenue in 2025, making it the leading type segment. This dominance is being supported by its suitability for high volume operations where continuous cleaning is essential.
Conveyor dishwashers are being valued for their ability to process large quantities of dishes quickly and uniformly, which aligns with the needs of large kitchens and institutional facilities. Their modular design, scalability, and durability have made them a practical choice for businesses looking to optimize space and improve workflow efficiency.
The consistent performance, combined with the ability to integrate with automated loading and unloading systems, has reinforced the conveyor segment’s prominence in settings where speed and reliability are critical.
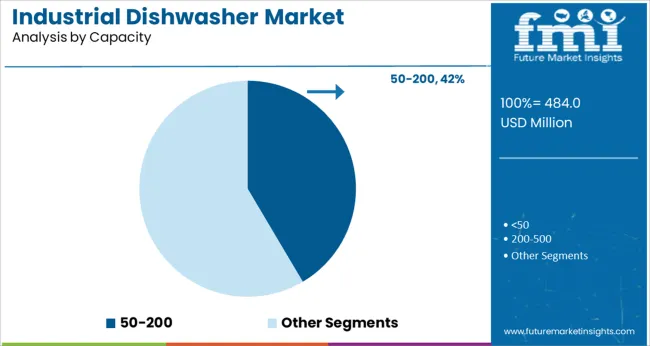
When segmented by capacity, the 50 to 200 segment is forecast to account for 41.50% of the market revenue in 2025, positioning it as the top capacity category.
This leadership is being driven by its alignment with the operational needs of medium to large facilities that require high output without excessive footprint. The 50 to 200 capacity range is being recognized for balancing efficiency, cost, and space utilization, making it attractive to a wide range of commercial kitchens and service providers.
Businesses have been adopting this capacity range as it offers flexibility to handle peak volumes while maintaining energy and water efficiency. Its versatility and suitability for diverse applications have solidified its role as the most demanded capacity category in the industrial dishwasher market.
The industrial dishwasher market expanded at a 2.9% CAGR from 2020 to 2025. According to FMI, by 2035, demand for industrial dishwasher would rise by 3.3%. The approximate market growth is expected to be USD 175.9 million.
The need for industrial spaces to install effective dish-cleaning systems in their facilities has grown over the years due to the development of health consciousness and hygiene awareness. It is also anticipated that the industrial dishwasher market would expand in the near future due to the quick uptake of bars, cafes, and bakeries in growing economies like China, India, and Brazil.
Moreover, the pandemic had a detrimental effect on the industrial dishwasher market's expansion in 2024. Restaurants and hotels had to close for an extended length of time as a result of the government's lockdown and travel ban.
Furthermore, the manufacturing facilities were either closed completely or partially, which hindered the production of industrial dishwashers. However, as a result of new construction and developments following the market's ease of lockdown, it reached USD 484 million in 2025.
Lengthier replacement cycles, high maintenance, and purchase costs are some of the factors limiting the growth of the global industrial dishwasher market.
Additionally, a significant factor that slows the expansion of the target market globally is the growing awareness of consumers regarding the negative effects of electronic appliances on the environment, such as the release of toxic waste that damages the land, waste, and atmosphere and affects both land and sea animals.
To overcome this problem, industrial dishwasher market players are concentrating on new technologies that have led to completely automatic dishwashers and a combination of dishwashers and dryers, which is a significant development in the market. The growth of the environment presents significant prospects for firms working in this sector.
| Segment | By Type |
|---|---|
| Leading Segment | Conveyor |
| CAGR | The conveyor segment historically expanded at a steady CAGR of 3.4% and is expected to develop at a CAGR of 3.6% by 2035. |
| Factors | Dishwashers with conveyors are made to swiftly and effectively clean lots of dishes. They are frequently employed in crowded eateries, lodging facilities, and other industrial kitchens. This is the primary reason for the growth of the conveyor segment. |
| Segment | By Capacity |
|---|---|
| Leading Segment | 200-500 |
| CAGR | Industrial dishwasher with 200-500 capacity historically expanded at a steady CAGR of 2.7% and are expected to develop at a CAGR of 3.1% by 2035. |
| Factors | This market category predominates as industrial dishwashers with capacities of 200-500 work well in operations with moderate volume. Additionally, it is a perfect fit for big restaurants, bustling eateries, and canteens in manufacturing facilities. |
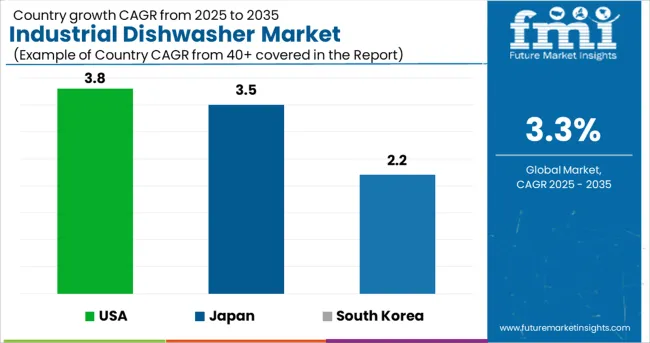
Japan is expected to have a market worth USD 39.5 million in 2035 and a steady CAGR of 3.5%. The market for industrial dishwashers has grown by a staggering USD 411.5 million. The industrial dishwasher market in Japan expanded at a CAGR of 2.9% between 2020 and 2025.
In order to increase the value of their products and improve their usefulness, manufacturers are also concentrating on ongoing technological advancements in the field of electronics and kitchen appliances. This allows them to increase consumer convenience.
In Japan's home appliances market, the number of automatic dishwashers and dryers sold increased by 71.7 thousand units (+9.43%) in 2024 compared to the previous year. As a result, the number of units sold in Japan peaked in 2024 at 832,13,000.
The newest high-tech invention from MEIKO highlights the company's commitment to creating environmentally friendly cleaning solutions. Future dishwasher technology is changing due to the M-iQ rack-type dishwasher generation.
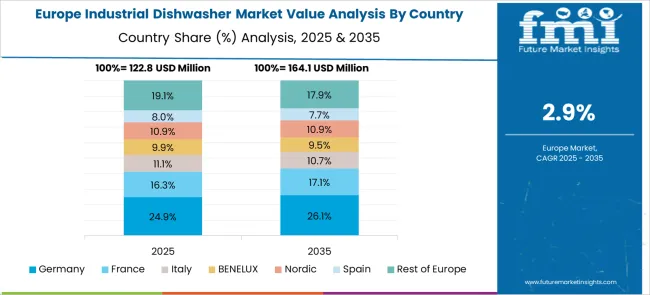
In 2035, the United Kingdom is predicted to have a market value of USD 44 million and a consistent CAGR of 4.9%. There has been a startling USD 16.6 million increase in the market for industrial dishwashers. Between 2020 and 2025, the United Kingdom's industrial dishwasher market had a CAGR of 2.9%.
The abundance of small- and medium-sized, family-run hotels and restaurants has a huge impact on the European economy. Germany is currently the market leader for industrial dishwashers, due to the region's growing interest in smart kitchen technologies. In June 2024, BSH Home Appliances, the biggest appliance maker in Europe, reported a threefold increase in demand for dishwashers.
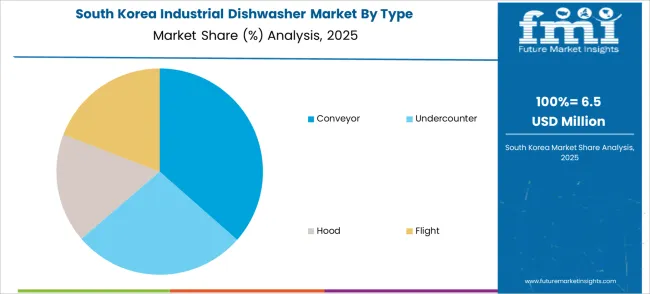
In 2035, South Korea is predicted to have a market value of USD 15.7 million and a sluggish CAGR of 1.8%. Between 2020 and 2025, South Korea’s industrial dishwasher market was growing at a slightly high CAGR of 2.2%.
One of the main drivers of Korean industrial dishwasher growth is the existence of a sizable consumer base and rising cleanliness consciousness. It is anticipated that rising urbanization and significant improvements in living standards would boost sales of freestanding and built-in dishwashers in developing nations.
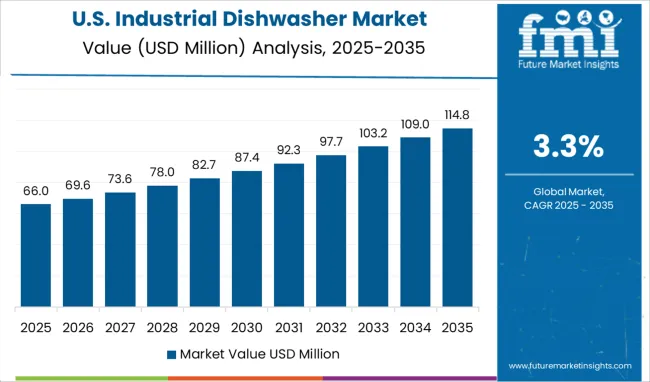
With a steady CAGR of 3.8% and a market value of USD 669.7 million in 2035, the USA continues to lead the industry. Market growth for industrial dishwashers is up by a whopping USD 48.5 million.
There are more than a million restaurants in the United States, and the number is steadily rising. Due to their excellent efficiency and low labor costs, industrial dishwasher are increasingly in demand among large restaurant and hotel chains.
Due to a sizable customer base for their well-known brands, many hotels and restaurants favor highly modern industrial dishwashers. A business's efficiency can be increased by using industrial dishwashers, which provide you the opportunity to clean lots of dishes at once.
Major producers of industrial dishwashers are eager to compete in the market by offering more sophisticated and energy-efficient dishwashers.
For instance, GE Appliances invested USD 468.6 million in December 2024 to increase the size of its dishwasher production facility in Ohio, United States. The region's market is also growing as energy-efficient kitchen appliances are increasingly adopted.
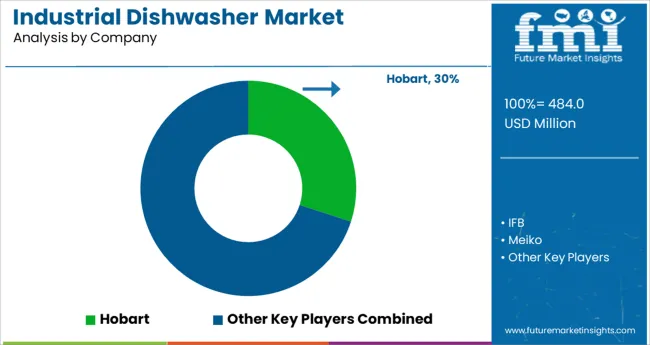
Organizations like Whirlpool and Bosch's Zeolite Technology have improved the mechanism of industrial dishwashers to acquire an adequate share of the market
Industrial dishwasher market key players may now market their goods and services while taking into account regional needs due to technical advancements and product innovations, which are expected to alter market dynamics during the projected period.
The improvements being made to dishwashers include better mechanisms for washing dishes, the creation of quieter machines, the incorporation of developed sensors and features that allow them to connect to smartphones, and the creation of a system that aids in keeping track of the detergent level and sending out alerts when the dishwasher cycle is about to start.
Industrial dishwasher sales are being impacted by the growing importance of printed or online documentation, websites, advertising efforts, and other marketing communication tools.
For instance, Bosch's Zeolite technology heats the interior of the dishwasher using Zeolite crystals rather than electricity. To maintain market competitiveness and to grow their business in other areas, large corporations are also acquiring their rivals.
In 2014, the American producer of electric appliances Whirlpool purchased the bulk of the shares of the Chinese company Hefei Rongshida Sanyo. Even though Whirlpool has been present in China's top cities for 20 years, after the acquisition, its reach was extended to the country's rural markets as well.
Additionally, Whirlpool purchased a 60% ownership position in the Italian appliance manufacturer Indesit Company. Whirlpool's presence in Europe grew as a result of this acquisition, as Indesit is a significant participant in the Western European electric appliance industry.
Moreover, major players in the industrial dishwasher market are concentrating on product innovation for dishwashers, which is projected to boost the market share. These innovations include pre-soak cycles, removable trays, fold-down tines, adjustable racks, better spray arms, and improved wash and dry systems in the finished product.
Demand for industrial dishwasher is expected to increase in developed nations due to rising customer propensity to upgrade an outdated dishwasher or remodel their kitchen. The manufacturers are profiting from the growing significance of water conservation since they are providing solutions that use less water than what is needed for hand washing.
Operators in the industrial dishwasher manufacturing sector mostly create cleaning and sanitizing kitchenware and dishware appliances. Industrial dishwashing equipment suppliers sell these units primarily to hotels, restaurants, food producers, and other enterprises. These industries must follow severe cleaning and sanitizing regulations since their processes generate more waste on the equipment.
Manufacturers have been spending money on product development over the last few years to give customers more advantages. To track the detergent level and receive warnings regarding the wash cycles, they have built sensors and features into the product that can be connected to cell phones. Additionally, producers are launching regionally or nationally specific items in response to consumer demand.
Manufacturers have been spending money on product development over the last few years to give customers more advantages. To track the detergent level and receive warnings regarding the wash cycles, they have built sensors and features into the product that can be connected to cell phones. Additionally, producers are launching regionally or nationally specific items in response to consumer demand.
Recent Propositions in the Industrial Dishwasher Market
The global industrial dishwasher market is estimated to be valued at USD 484.0 million in 2025.
It is projected to reach USD 669.7 million by 2035.
The market is expected to grow at a 3.3% CAGR between 2025 and 2035.
The key product types are fully-automatic and semi-automatic.
conveyor segment is expected to dominate with a 36.2% industry share in 2025.


Our Research Products

The "Full Research Suite" delivers actionable market intel, deep dives on markets or technologies, so clients act faster, cut risk, and unlock growth.

The Leaderboard benchmarks and ranks top vendors, classifying them as Established Leaders, Leading Challengers, or Disruptors & Challengers.

Locates where complements amplify value and substitutes erode it, forecasting net impact by horizon

We deliver granular, decision-grade intel: market sizing, 5-year forecasts, pricing, adoption, usage, revenue, and operational KPIs—plus competitor tracking, regulation, and value chains—across 60 countries broadly.

Spot the shifts before they hit your P&L. We track inflection points, adoption curves, pricing moves, and ecosystem plays to show where demand is heading, why it is changing, and what to do next across high-growth markets and disruptive tech

Real-time reads of user behavior. We track shifting priorities, perceptions of today’s and next-gen services, and provider experience, then pace how fast tech moves from trial to adoption, blending buyer, consumer, and channel inputs with social signals (#WhySwitch, #UX).

Partner with our analyst team to build a custom report designed around your business priorities. From analysing market trends to assessing competitors or crafting bespoke datasets, we tailor insights to your needs.
Supplier Intelligence
Discovery & Profiling
Capacity & Footprint
Performance & Risk
Compliance & Governance
Commercial Readiness
Who Supplies Whom
Scorecards & Shortlists
Playbooks & Docs
Category Intelligence
Definition & Scope
Demand & Use Cases
Cost Drivers
Market Structure
Supply Chain Map
Trade & Policy
Operating Norms
Deliverables
Buyer Intelligence
Account Basics
Spend & Scope
Procurement Model
Vendor Requirements
Terms & Policies
Entry Strategy
Pain Points & Triggers
Outputs
Pricing Analysis
Benchmarks
Trends
Should-Cost
Indexation
Landed Cost
Commercial Terms
Deliverables
Brand Analysis
Positioning & Value Prop
Share & Presence
Customer Evidence
Go-to-Market
Digital & Reputation
Compliance & Trust
KPIs & Gaps
Outputs
Full Research Suite comprises of:
Market outlook & trends analysis
Interviews & case studies
Strategic recommendations
Vendor profiles & capabilities analysis
5-year forecasts
8 regions and 60+ country-level data splits
Market segment data splits
12 months of continuous data updates
DELIVERED AS:
PDF EXCEL ONLINE
Industrial Bench Scale Market Size and Share Forecast Outlook 2025 to 2035
Industrial Low Profile Floor Scale Market Size and Share Forecast Outlook 2025 to 2035
Industrial Sand Mill Market Size and Share Forecast Outlook 2025 to 2035
Industrial Control Network Modules Market Size and Share Forecast Outlook 2025 to 2035
Industrial Precision Oven Market Size and Share Forecast Outlook 2025 to 2035
Industrial Water Chiller for PCB Market Size and Share Forecast Outlook 2025 to 2035
Industrial & Commercial HVLS Fans Market Size and Share Forecast Outlook 2025 to 2035
Industrial Robot Controller Market Size and Share Forecast Outlook 2025 to 2035
Industrial Wired Routers Market Size and Share Forecast Outlook 2025 to 2035
Industrial Evaporative Condensers Market Size and Share Forecast Outlook 2025 to 2035
Industrial Energy Management System Market Size and Share Forecast Outlook 2025 to 2035
Industrial Insulation Market Size and Share Forecast Outlook 2025 to 2035
Industrial Safety Gloves Market Size and Share Forecast Outlook 2025 to 2035
Industrial Cleaner Market Size and Share Forecast Outlook 2025 to 2035
Industrial Dust Treatment System Market Size and Share Forecast Outlook 2025 to 2035
Industrial Vertical Washing Tower Market Size and Share Forecast Outlook 2025 to 2035
Industrial Pepper Market Size and Share Forecast Outlook 2025 to 2035
Industrial Electronics Packaging Market Forecast and Outlook 2025 to 2035
Industrial Absorbent Market Forecast and Outlook 2025 to 2035
Industrial Furnace Industry Analysis in Europe Forecast and Outlook 2025 to 2035

Thank you!
You will receive an email from our Business Development Manager. Please be sure to check your SPAM/JUNK folder too.
Chat With
MaRIA