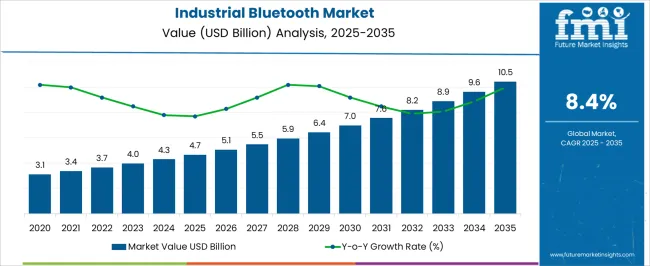
The Industrial Bluetooth Market is estimated to be valued at USD 4.7 billion in 2025 and is projected to reach USD 10.5 billion by 2035, registering a compound annual growth rate (CAGR) of 8.4% over the forecast period.

| Metric | Value |
|---|---|
| Industrial Bluetooth Market Estimated Value in (2025 E) | USD 4.7 billion |
| Industrial Bluetooth Market Forecast Value in (2035 F) | USD 10.5 billion |
| Forecast CAGR (2025 to 2035) | 8.4% |
The industrial Bluetooth market is advancing steadily, driven by the growing need for low-power, short-range communication in industrial automation, monitoring, and control systems. As industries transition toward wireless operations, Bluetooth technology is being leveraged for its reliability, scalability, and energy efficiency. The shift toward Industry 4.0 and the rapid proliferation of IIoT-enabled ecosystems have intensified demand for robust and interference-resilient connectivity solutions.
Manufacturers are focusing on Bluetooth Low Energy variants to support sensor-to-gateway communication, predictive maintenance, and asset tracking with minimal energy overhead. Additionally, increasing deployment of ruggedized modules capable of withstanding vibration, electromagnetic interference, and extreme temperatures is supporting its adoption in complex industrial environments.
Integration with programmable logic controllers, condition monitoring systems, and field devices is being prioritized to enable seamless data acquisition and control. As industries move toward real-time, data-driven operations, the market is expected to benefit from ongoing innovation in chipsets, mesh networking, and secure data transmission capabilities.
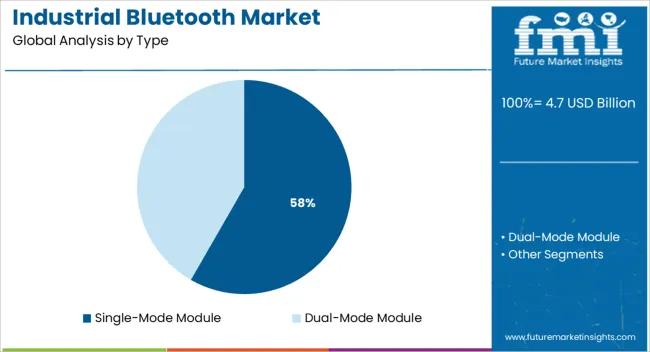
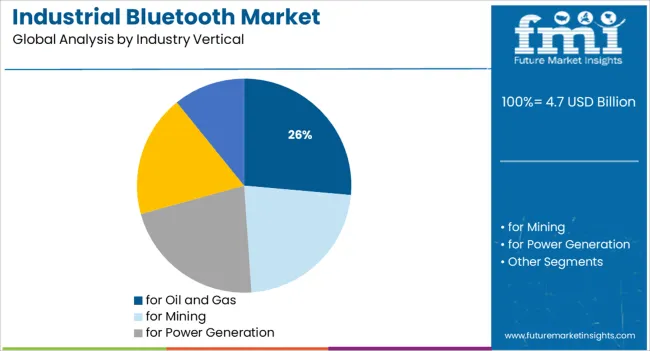
The market is segmented by Type and Industry Vertical and region. By Type, the market is divided into Single-Mode Module and Dual-Mode Module. In terms of Industry Vertical, the market is classified into for Oil and Gas, for Mining, for Power Generation, or Water and Wastewater Treatment, and for Other Industry Verticals. Regionally, the market is classified into North America, Latin America, Western Europe, Eastern Europe, Balkan & Baltic Countries, Russia & Belarus, Central Asia, East Asia, South Asia & Pacific, and the Middle East & Africa.

The single mode module segment is projected to contribute 58.3% of the total revenue in the type category by 2025, making it the leading segment. This dominance is supported by its low power consumption and dedicated support for Bluetooth Low Energy which is essential for industrial sensor networks and control systems.
The ability of single mode modules to operate reliably with minimal latency and their compact design has made them a preferred choice in embedded applications where energy efficiency and space are critical. Manufacturers are incorporating these modules into battery-powered devices such as data loggers, asset trackers, and sensor beacons that require extended operating life without frequent maintenance.
The simplicity of integration into custom industrial boards and compatibility with a wide range of microcontrollers has further driven adoption. Moreover the growth of smart factories and remote diagnostics infrastructure has reinforced the demand for lightweight and energy optimized wireless modules, ensuring continued leadership of the single mode module segment.

The oil and gas industry is anticipated to account for 26.4% of the total revenue in the industrial vertical segment by 2025, positioning it as a significant adopter of industrial Bluetooth technology. This is driven by the need for real-time data acquisition and remote monitoring in hazardous and geographically dispersed environments. Bluetooth modules are being integrated into pressure sensors, flow meters, and safety systems to enable wireless diagnostics and condition-based maintenance.
The reduction of cabling requirements has proven advantageous in explosive zones where wired installations pose significant risks and regulatory challenges. The ability of Bluetooth systems to operate reliably in high-temperature, high-vibration, and electromagnetically noisy settings is further contributing to their use in upstream and midstream operations.
With increasing investments in digital oilfields and predictive maintenance platforms, the sector is leveraging Bluetooth-enabled communication for enhanced asset visibility, safety compliance, and operational efficiency. This has solidified oil and gas as a high-growth vertical in the industrial Bluetooth market.
The primary key factor propelling the growth of the Industrial Bluetooth Market is the increasing global demand for a wireless network to eliminate the complexities and expenses associated with cables.
Furthermore, the benefits of Bluetooth technology, such as enhanced reliability and robustness, enhanced integration with devices, wider mobility and flexibility, easy installation, efficient communication, reduced wiring costs, labor costs, and limited interference, are expected to augment the regional of the Industrial Bluetooth Market. Furthermore, the low cost of Bluetooth devices is a significant driving force in the global Industrial Bluetooth market.
The technology is widely used by wireless device users and developers, and it is one of the most widely used low-power wireless technologies on the market. Bluetooth technology has progressed over the last two decades to Bluetooth 5. All Bluetooth-enabled nodes act as transmitters for other nodes, resulting in improved node connectivity. As a result, the growth of Bluetooth integrated circuits (ICs) in wireless devices has increased.
Customers' expanded use of smart wearable electronic devices is a significant driver of market expansion. Increasing financial investments in IoT-based device technology, as well as increased demand for smart wireless sensors and better wireless connectivity in wireless devices.
The primary impediment to the growth of Industrial Bluetooth is Bluetooth technology's limited range. The range eliminates the technology's adoption in industries that exceed the Bluetooth technology's threshold range and have comparatively long-range applications. This is expected to be the most significant restraint for the global Industrial Bluetooth market.
Over the forecast period of 2025 to 2035, the North American market is projected to expand the fastest. The widespread use of wireless devices, combined with the implementation of smart buildings, has fueled North America's industrial Bluetooth market share.
Due to technological advancements by the populace, North America is the primary revenue contributor to the global wireless connectivity market. Consumer behavior and spending in the region are both key aspects of market growth. Wireless connectivity in diverse fields that are growing in the region, such as energy, agriculture, and others, is expected to propel the industrial Bluetooth market.
The emergence of 5G technology is projected to augment the industrial Bluetooth market demand in North America. The majority of countries are competing and advancing strategies to be the leader in 5G technology. In the USA, for example, the private sector is cruising the deployment of 5G technology.
As per Future Market Insights, North America is expected to account for 29.2% of the industrial Bluetooth market in 2025, owing to the presence of a large number of industries and the region's increasing adoption of wireless technologies.

Owing to the increasing adoption of Wi-Fi solutions and industrialization, wireless technology accounted for more than 30.1% of the market in 2024. Businesses in the region are focusing on implementing advanced technological applications to attract customers in a more innovative manner, which is raising the demand for high-quality wireless network connectivity across verticals.
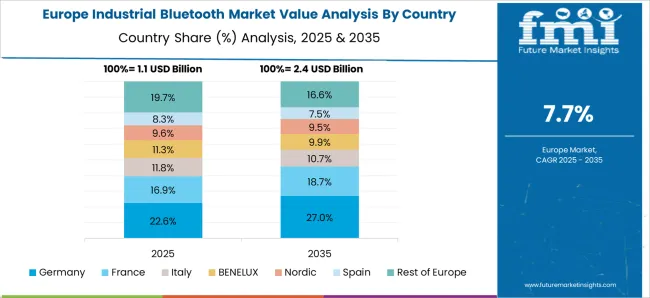
The popularisation of cloud computing is driving up the consumption of wireless access points. Many businesses are turning to cloud computing because of its efficiencies and advanced features. As a consequence, the industrial Bluetooth market in Europe is expected to grow. In 2025, Europe is expected to account for 21.9% of the Industrial Bluetooth market, and is expected to maintain the governing growth over the forecast period, states Future Market Insights.
The growing demand for high-speed internet and wireless technologies is also contributing to Europe's market growth. The implementation of new wireless technology - Wi-Fi 6, also known as 802.11ax - is projected to boost industrial Bluetooth in Europe. Also, owing to the presence of a large number of industries propelling the market growth.
The swelling dispersion of start-ups in the Industrial Bluetooth market has improved product quality and enhanced global sales. Besides, to gain a competitive edge, new start-ups are working on novel developments and launching the latest equipment such as:
Some key players in the Industrial Bluetooth market are Intel Corporation, Texas Instruments Incorporated, Cypress Semiconductor Corporation, NORDIC SEMICONDUCTOR, Dialog Semiconductor, Microchip Technology Inc., Microchip, STMicroelectronics, and Advantech Co., Ltd. Key development in the Industrial Bluetooth market is as follows:
| Report Attribute | Details |
|---|---|
| Growth Rate | CAGR of 8.4% from 2025 to 2035 |
| Market Value in 2025 | USD 4.7 billion |
| Market Value in 2035 | USD 10.5 billion |
| Base Year for Estimation | 2024 |
| Historical Period | 2020 to 2024 |
| Forecast Period | 2025 to 2035 |
| Quantitative Units | Revenue in USD Million and CAGR from 2025 to 2035 |
| Report Coverage | Revenue Forecast, Volume Forecast, Company Ranking, Competitive Landscape, Growth Factors, Trends, and Pricing Analysis |
| Segments Covered | Type, Industry Vertical, Region |
| Regions Covered | North America; Latin America; Europe; Asia Pacific; Middle East and Africa |
| Key Countries Profiled | United States of America, Canada, Brazil, Mexico, Germany, United Kingdom, France, Spain, Italy, China, Japan, South Korea, Malaysia, Singapore, Australia, New Zealand, GCC Countries, South Africa, Israel |
| Key Companies Profiled | Intel Corporation; Texas Instruments Incorporated; Cypress Semiconductor Corporation; NORDIC SEMICONDUCTOR; Dialog Semiconductor; Microchip Technology Inc.; STMicroelectronics; Advantech Co. Ltd. |
| Customization | Available Upon Request |
The global industrial bluetooth market is estimated to be valued at USD 4.7 billion in 2025.
The market size for the industrial bluetooth market is projected to reach USD 10.5 billion by 2035.
The industrial bluetooth market is expected to grow at a 8.4% CAGR between 2025 and 2035.
The key product types in industrial bluetooth market are single-mode module and dual-mode module.
In terms of industry vertical, for oil and gas segment to command 26.4% share in the industrial bluetooth market in 2025.


Full Research Suite comprises of:
Market outlook & trends analysis
Interviews & case studies
Strategic recommendations
Vendor profiles & capabilities analysis
5-year forecasts
8 regions and 60+ country-level data splits
Market segment data splits
12 months of continuous data updates
DELIVERED AS:
PDF EXCEL ONLINE
Industrial Precision Oven Market Size and Share Forecast Outlook 2025 to 2035
Industrial Water Chiller for PCB Market Size and Share Forecast Outlook 2025 to 2035
Industrial & Commercial HVLS Fans Market Size and Share Forecast Outlook 2025 to 2035
Industrial Robot Controller Market Size and Share Forecast Outlook 2025 to 2035
Industrial Wired Routers Market Size and Share Forecast Outlook 2025 to 2035
Industrial Evaporative Condensers Market Size and Share Forecast Outlook 2025 to 2035
Industrial Energy Management System Market Size and Share Forecast Outlook 2025 to 2035
Industrial Insulation Market Size and Share Forecast Outlook 2025 to 2035
Industrial Safety Gloves Market Size and Share Forecast Outlook 2025 to 2035
Industrial Cleaner Market Size and Share Forecast Outlook 2025 to 2035
Industrial Dust Treatment System Market Size and Share Forecast Outlook 2025 to 2035
Industrial Vertical Washing Tower Market Size and Share Forecast Outlook 2025 to 2035
Industrial Pepper Market Size and Share Forecast Outlook 2025 to 2035
Industrial Electronics Packaging Market Forecast and Outlook 2025 to 2035
Industrial Absorbent Market Forecast and Outlook 2025 to 2035
Industrial Furnace Industry Analysis in Europe Forecast and Outlook 2025 to 2035
Industrial Denox System Market Size and Share Forecast Outlook 2025 to 2035
Industrial Electronic Pressure Switch Market Size and Share Forecast Outlook 2025 to 2035
Industrial WiFi Module Market Size and Share Forecast Outlook 2025 to 2035
Industrial Security System Market Forecast Outlook 2025 to 2035

Thank you!
You will receive an email from our Business Development Manager. Please be sure to check your SPAM/JUNK folder too.
Chat With
MaRIA