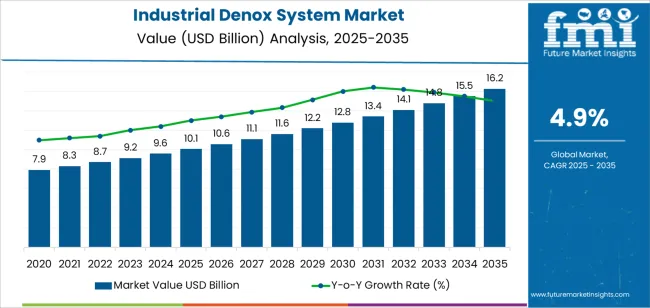
The industrial DeNOx system market is experiencing notable growth driven by stringent environmental regulations, rising industrial emissions, and increasing adoption of clean air technologies. The current market landscape is marked by extensive implementation of nitrogen oxide reduction systems across power generation, cement, and chemical industries. Government initiatives promoting air quality improvement and the growing transition toward sustainable industrial operations are supporting widespread system deployment.
The market outlook remains optimistic as industries continue to modernize existing facilities and invest in emission control retrofits. Technological advancements enhancing system efficiency, durability, and catalytic performance are expected to drive long-term adoption.
Growth rationale is centered on the necessity for regulatory compliance, operational optimization, and sustainability commitments across heavy industrial sectors The increasing emphasis on energy-efficient solutions and integration of digital monitoring for performance optimization is anticipated to further strengthen market growth and support broader utilization across global industrial infrastructures.


| Metric | Value |
|---|---|
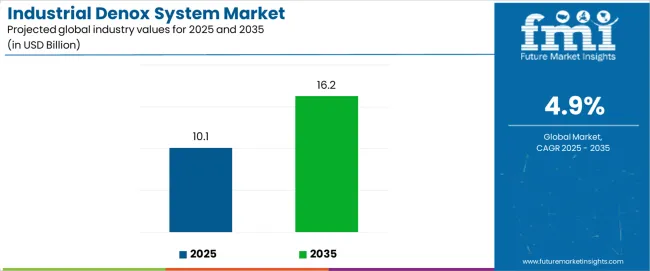
| Industrial Denox System Market Estimated Value in (2025 E) | USD 10.1 billion |
| Industrial Denox System Market Forecast Value in (2035 F) | USD 16.2 billion |
| Forecast CAGR (2025 to 2035) | 4.9% |
The market is segmented by Type and Application and region. By Type, the market is divided into Selective Catalytic Reduction and Selective Non-Catalytic Reduction. In terms of Application, the market is classified into Utilities, Industries, and Others. Regionally, the market is classified into North America, Latin America, Western Europe, Eastern Europe, Balkan & Baltic Countries, Russia & Belarus, Central Asia, East Asia, South Asia & Pacific, and the Middle East & Africa.

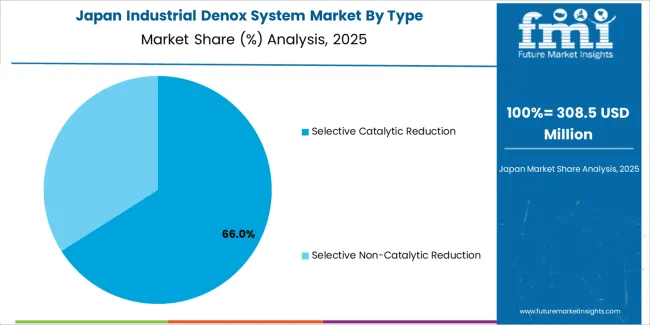
The selective catalytic reduction segment, accounting for 63.40% of the type category, has emerged as the leading technology due to its superior efficiency in converting nitrogen oxides into harmless nitrogen and water. Adoption has been driven by its proven reliability, adaptability across varied industrial processes, and compliance with stringent emission norms.
The system’s ability to achieve high removal efficiencies under fluctuating operating conditions has reinforced its dominance across power and process industries. Manufacturers have focused on improving catalyst formulations and reactor designs to enhance conversion rates and reduce maintenance requirements.
Increasing deployment in retrofit applications, particularly in aging industrial plants, is supporting sustained demand Continuous research into catalyst longevity and temperature optimization is expected to further improve performance and cost-effectiveness, ensuring the segment’s leading position in emission control applications over the coming years.

The utilities segment, representing 58.70% of the application category, has maintained its dominance owing to extensive usage in power generation and large-scale energy facilities where stringent emission standards are enforced. The segment’s growth has been underpinned by the need to minimize environmental impact from fossil fuel combustion and to meet national and international air quality targets.
Installation of DeNOx systems in thermal power plants and combined heat and power stations has been accelerating as operators modernize their equipment to align with evolving compliance frameworks. Technological upgrades improving system responsiveness, operational flexibility, and efficiency have strengthened adoption rates.
The ongoing global transition toward cleaner energy generation, along with the gradual integration of DeNOx systems into hybrid and renewable-linked plants, is expected to sustain the utilities segment’s market leadership and drive consistent growth over the forecast horizon.
In the period from 2020 to 2025, the historical analysis indicates CAGR of 6.2% for the market under consideration. This growth rate reflects the market performance and expansion over those five years, driven by various factors such as technological advancements, changing consumer preferences, and economic conditions.
During this period, the market likely experienced steady growth and development, with companies adapting to emerging trends and market dynamics to capitalize on opportunities and overcome challenges.
Looking ahead to the forecasted period from 2025 to 2035, market projections suggest a lower CAGR of 4.9%. This forecasted growth rate indicates a moderation in the pace of expansion compared to the historical period.
Several factors may contribute to this slowdown in growth, including market saturation, regulatory changes, economic uncertainties, and shifting consumer behaviors. Technological innovations and disruptions may alter the competitive landscape and impact market dynamics, influencing growth trajectory in the forecasted period.
Despite the lower forecasted CAGR, the market is expected to continue growing steadily over the forecast period, albeit slightly slower than the historical period. Companies operating in the market must adapt to changing market conditions, innovate to meet evolving consumer demands, and navigate regulatory challenges to maintain competitiveness and drive growth.
Strategic initiatives such as product diversification, expansion into new markets, and investment in research and development will be essential for companies to seize opportunities and sustain growth in the forecasted period.
| Historical CAGR from 2020 to 2025 | 6.2% |
|---|---|
| Forecast CAGR from 2025 to 2035 | 4.9% |
The provided table illustrates the top five countries in terms of revenue, with Japan holding a prominent position in the market.
Japan leads the industrial denox system market by focusing on technological innovation and environmental stewardship. With advanced research and development efforts, the companies offer cutting-edge denox solutions that meet stringent emissions regulations and drive sustainable industrial practices globally.
| Countries | Forecast CAGRs from 2025 to 2035 |
|---|---|
| The United States | 4.9% |
| The United Kingdom | 5.7% |
| China | 5.6% |
| Japan | 6.2% |
| South Korea | 6% |

In the United States, the industrial denox system market is primarily utilized in power generation, manufacturing, and refining industries.
With stringent emissions regulations, denox systems are essential for reducing nitrogen oxide (NOx) emissions from industrial processes, ensuring compliance with environmental standards and improving air quality.
The United Kingdom relies on industrial denox systems across various sectors, including energy production, automotive manufacturing, and chemical processing.
With a focus on sustainability and environmental protection, denox systems play a critical role in minimizing NOx emissions and mitigating the impact of air pollution on public health and the environment.
The market in China is crucial for addressing air quality concerns in rapidly industrializing regions. Industries such as power generation, steel production, and cement manufacturing utilize denox systems to comply with emissions regulations and reduce pollution.
The government emphasises on environmental protection drives the widespread adoption of denox technology.

The market is integral to combat air pollution and meet emissions targets. Energy, manufacturing, and transportation industries rely on denox systems to control NOx emissions and ensure regulatory compliance.
With a focus on technological innovation and environmental stewardship, Japan leads in developing and deploying advanced denox technologies.

South Korea utilizes Industrial DeNOx Systems in key sectors such as power generation, petrochemicals, and semiconductor manufacturing.
With a growing emphasis on environmental sustainability and clean energy initiatives, denox systems are vital in reducing NOx emissions and improving air quality.
South Korean industries prioritize adopting advanced DeNOx technologies to enhance environmental performance and compliance.
The below section shows the leading segment. Based on type, the selective catalytic reduction segment is registered to hold at 4.7% CAGR in 2035. Based on the application, the industries are projected to rise at 4.5% CAGR in 2035.
Stringent emissions regulations worldwide drive industries to adopt selective catalytic reduction (SCR) systems to reduce nitrogen oxide (NOx) emissions and comply with environmental standards.
Increasing awareness of the adverse effects of air pollution motivates industries to invest in emissions control technologies to minimize their environmental footprint and demonstrate corporate social responsibility.
| Category | CAGR from 2025 to 2035 |
|---|---|
| Selective Catalytic Reduction | 4.7% |
| Industries | 4.5% |
By type, the selective catalytic reduction (SCR) segment is anticipated to maintain a steady growth trajectory, with a CAGR) of 4.7% by 2035. SCR systems are crucial in reducing nitrogen oxide (NOx) emissions from industrial processes, particularly in the power generation, manufacturing, and transportation sectors. Stringent emissions regulations and the need for efficient NOx reduction solutions drive the steady adoption of SCR technology.
In terms of application, industries across various sectors are projected to experience a moderate growth rate of 4.5% CAGR by 2035. This growth reflects the continued demand for emissions control solutions and environmental compliance measures across power generation, automotive manufacturing, chemical processing, and petrochemicals.
As governments worldwide implement stricter emissions standards and regulations, industries increasingly invest in technologies like SCR systems to minimize their environmental impact and ensure regulatory compliance.

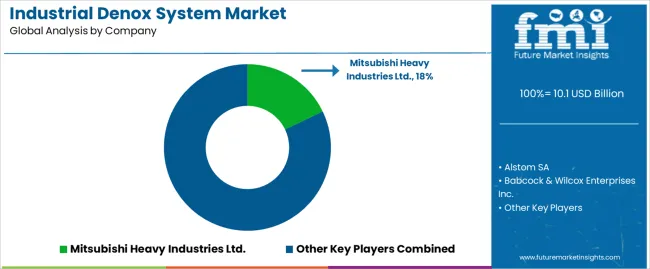
The competitive landscape of the industrial denox system market is characterized by established players and emerging companies competing for market share. These companies focus on continuous innovation, technological advancements, and strategic partnerships to maintain their competitive edge.
New entrants and smaller players are also entering the market, offering niche solutions and challenging established players. Intense competition drives market players to enhance product offerings and service quality to meet evolving customer demands and regulatory requirements.
Some of the key developments
| Attributes | Details |
|---|---|
| Estimated Market Size in 2025 | USD 10.1 billion |
| Projected Market Valuation in 2035 | USD 16.2 billion |
| Value-based CAGR 2025 to 2035 | 4.9% |
| Forecast Period | 2025 to 2035 |
| Historical Data Available for | 2020 to 2025 |
| Market Analysis | Value in USD billion |
| Key Regions Covered | North America; Latin America; Western Europe; Eastern Europe; South Asia and Pacific; East Asia; Middle East and Africa |
| Key Market Segments Covered | Type, Application, Region |
| Key Countries Profiled | The United States, Canada, Brazil, Mexico, Germany, The United Kingdom, France, Spain, Italy, Russia, Poland, Czech Republic, Romania, India, Bangladesh, Australia, New Zealand, China, Japan, South Korea, GCC countries, South Africa, Israel |
| Key Companies Profiled | Alstom SA; Babcock & Wilcox Enterprises Inc.; Babcock Noell GmbH; Burns & Mcdonnell, Inc.; Doosan Power Systems; FLSmidth & Co. A/S; Fuel Tech Inc.; Haldor Topsoe A/S; Mitsubishi Heavy Industries Ltd.; Others |
The global industrial denox system market is estimated to be valued at USD 10.1 billion in 2025.
The market size for the industrial denox system market is projected to reach USD 16.2 billion by 2035.
The industrial denox system market is expected to grow at a 4.9% CAGR between 2025 and 2035.
The key product types in industrial denox system market are selective catalytic reduction and selective non-catalytic reduction.
In terms of application, utilities segment to command 58.7% share in the industrial denox system market in 2025.


Full Research Suite comprises of:
Market outlook & trends analysis
Interviews & case studies
Strategic recommendations
Vendor profiles & capabilities analysis
5-year forecasts
8 regions and 60+ country-level data splits
Market segment data splits
12 months of continuous data updates
DELIVERED AS:
PDF EXCEL ONLINE
Industrial Wired Routers Market Size and Share Forecast Outlook 2025 to 2035
Industrial Robot Controller Market Size and Share Forecast Outlook 2025 to 2035
Industrial Evaporative Condensers Market Size and Share Forecast Outlook 2025 to 2035
Industrial Insulation Market Size and Share Forecast Outlook 2025 to 2035
Industrial Safety Gloves Market Size and Share Forecast Outlook 2025 to 2035
Industrial Cleaner Market Size and Share Forecast Outlook 2025 to 2035
Industrial Vertical Washing Tower Market Size and Share Forecast Outlook 2025 to 2035
Industrial Pepper Market Size and Share Forecast Outlook 2025 to 2035
Industrial Electronics Packaging Market Forecast and Outlook 2025 to 2035
Industrial Absorbent Market Forecast and Outlook 2025 to 2035
Industrial Furnace Industry Analysis in Europe Forecast and Outlook 2025 to 2035
Industrial Electronic Pressure Switch Market Size and Share Forecast Outlook 2025 to 2035
Industrial WiFi Module Market Size and Share Forecast Outlook 2025 to 2035
Industrial Film Market Forecast Outlook 2025 to 2035
Industrial Floor Mat Market Forecast Outlook 2025 to 2035
Industrial Process Water Coolers Market Forecast and Outlook 2025 to 2035
Industrial Grade Ammonium Hydrogen Fluoride Market Forecast and Outlook 2025 to 2035
Industrial Grade Sodium Bifluoride Market Forecast and Outlook 2025 to 2035
Industrial Evaporative Condenser Market Size and Share Forecast Outlook 2025 to 2035
Industrial Power Supply Market Size and Share Forecast Outlook 2025 to 2035

Thank you!
You will receive an email from our Business Development Manager. Please be sure to check your SPAM/JUNK folder too.
Chat With
MaRIA