Reports

- Global Locations -

Headquarters

Future Market Insights, Inc.

Christiana Corporate, 200
Continental Drive, Suite 401,
Newark, Delaware - 19713,
United States

T: +1-347-918-3531

Americas

Future Market Insights, Inc.

616 Corporate Way, Suite 2-9018,
Valley Cottage, NY 10989, United States

MEA

Future Market Insights

1602-6 Jumeirah Bay X2 Tower, Plot No: JLT-PH2-X2A,
Jumeirah Lakes Towers, Dubai,
United Arab Emirates

Europe

Future Market Insights

3rd Floor, 207 Regent Street,
W1B 3HH London
United Kingdom

T: + 44 (0) 20 8123 9659

Asia Pacific

Future Market Insights

IndiaLand Global Tech Park, Unit UG-1, Behind Grand HighStreet, Phase 1, Hinjawadi, MH, Pune – 411057, India

Europe Industrial Furnace Growth Outlook for (2023 to 2033)

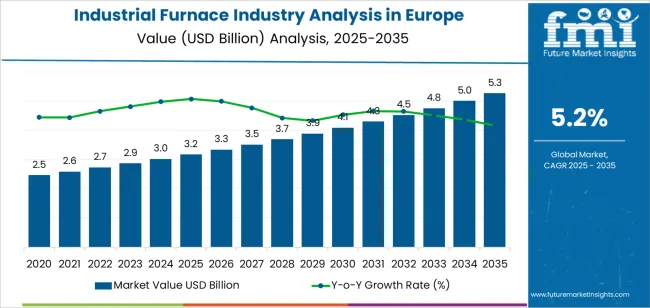
The demand for industrial furnace in Europe is expected to total US$ 2,789.7 million by 2023. It is anticipated to showcase a steady CAGR of 4.9% between 2023 and 2033.

Growth of industrial furnace in Europe will likely reach a valuation of around US$ 4,514.5 million by 2033. Revenue stood at US$ 2,674.2 million in 2022.

Technological advancements and the integration of Industry 4.0 principles have significantly transformed the demand for industrial furnace in Europe. Furnaces can be remotely controlled and monitored with the help of artificial intelligence, reducing the need for constant on-site supervision. This enhances safety and allows for efficient operation, as temperature and process parameters can be adjusted in real-time, making it highly popular among heat-intensive industrial applications.

Integrating sensors and data analytics tools into industrial furnaces enables predictive maintenance. These smart furnaces reduce unplanned downtime and costly repairs, driving their demand in the automotive and aerospace industries. Maintenance can be scheduled during planned downtime periods, optimizing furnace performance.

Advanced sensors and monitoring systems enable precise temperature and atmosphere control within furnaces. Manufacturers can track and record temperature profiles for quality assurance and compliance. This will aid in providing benefits to industrial furnace in Europe.

Attributes Key Insights
Europe Industrial Furnace Demand Analysis (2022A) US$ 2,674.2 million
Europe Industrial Furnace Demand Analysis Estimated Year Value (2023E) US$ 2,789.7 million
Europe Industrial Furnace Demand Analysis Projected Year Value (2033F) US$ 4,514.5 million
Value-based CAGR (2023 to 2033) 4.9%

Don't pay for what you don't need

Customize your report by selecting specific countries or regions and save 30%!

2018 to 2022 Europe Industrial Furnace Growth Analysis vs. Demand Forecast from 2023 to 2033

Growth of industrial furnace in Europe showcased a decent CAGR of 4.8% in the historical period between 2018 and 2022. It is anticipated to witness a CAGR of 4.9% during the forecast period. Revenue generated from industrial furnace in Europe stood at US$ 2,674.2 million in 2022.

Attributes Details
Historical Europe Industrial Furnace Demand (2018 to 2022) 4.8%
Historical Europe Industrial Furnace Estimated Value (2022) US$ 2,674.2 million

The demand for industrial furnace in Europe is projected to benefit from growing demand for energy-efficient solutions during the projection period. As businesses seek to reduce operational costs and meet sustainability goals, there will be a growing demand for furnaces that offer improved energy efficiency and reduced carbon emissions. This has led to increased adoption of advanced combustion technologies, heat recovery systems, and process optimization techniques.

Innovations in furnace design and control systems will likely drive the ecosystem forward. Smart and automated furnaces with advanced sensors and data analytics capabilities are anticipated to become more common since it allows for real-time monitoring, remote operation, and predictive maintenance. These technologies are in high demand since they improve productivity and reduce downtime.

Industries with specific heat treatment and materials processing requirements, such as aerospace, automotive, and electronics, will drive demand for specialized industrial furnaces. Customization and flexibility in furnace design will be essential to meet the unique needs of different sectors.

The digitalization of manufacturing processes leads to high levels of automation. Industrial furnaces integrated with digital control systems can optimize temperature and process parameters, improving efficiency and reducing human intervention.

Digitalization enables better monitoring and control of energy consumption. Industrial furnaces with smart sensors and data analytics can optimize fuel usage and reduce energy costs. This helps in making them attractive to industries looking to improve sustainability.

Digitalization allows for precise temperature and process control. This is critical in industries such as aerospace and electronics, where the quality and consistency of heat treatment are paramount.

Trends Driving Industrial Furnace Growth in Europe

  • Energy-efficiency:

There is a growing emphasis on energy-efficient industrial furnaces to reduce operational costs and meet environmental regulations across industries like electronics and automotive.

  • Digitalization:

The adoption of Industry 4.0 technologies, such as IoT sensors and data analytics, is driving better control and monitoring of furnace operations.

  • Electric Furnaces:

A shift towards electric furnaces due to their lower emissions, improved efficiency, and versatility is emerging as a trend across Europe.

  • Advanced Materials:

The demand for high-performance materials, such as advanced ceramics and composites, is influencing furnace designs to accommodate specialized heat treatment processes.

  • Hydrogen-based Heat:

Growing interest in using hydrogen as a clean energy source for industrial heating applications is driving sales of industrial furnaces in the region.

Nikhil Kaitwade
Nikhil Kaitwade

Principal Consultant

Talk to Analyst

Find your sweet spots for generating winning opportunities in this market.

Challenges Hindering Demand for Europe Industrial Furnace in Euorpe

  • Energy Consumption:

Industrial furnaces often require significant amounts of energy, leading to high operational costs and environmental impact.

  • Emissions:

Furnaces can emit pollutants, including greenhouse gases and particulate matter, which can contribute to environmental pollution and regulatory compliance challenges.

  • Safety Hazards:

Operating industrial furnaces poses safety risks, such as fires, explosions, and exposure to high temperatures and toxic fumes.

  • Limited Versatility:

Furnaces are designed for specific purposes, so they may not be easily adaptable to different manufacturing processes.

  • Downtime:

Furnace downtime for maintenance or repairs can disrupt production schedules and lead to financial losses.

  • Environmental Regulations:

Compliance with environmental regulations, such as emissions controls and pollution abatement can be challenging and costly for industrial furnace operators.

Comparative View of Adjacent Businesses

The demand for industrial furnace in Europe is likely to be impacted by the peer and the tangential ecosystems in the industrial automation domain. These include other spaces such as industrial air filtration and industrial radiography. Out of the three, demand for industrial radiography is expected to dominate growth, at 8.3% CAGR through 2033. The industrial air filtration sales are projected to lead in value, at US$ 56.1 billion. Both industries are likely to expand due to growing process optimization by integrating automation and Industry 4.0.

Europe Industrial Furnace Space:

Attributes Europe Industrial Furnace Sales
Value-based CAGR (2023 to 2033) 4.9%
Projected Value (2033) US$ 4,514.5 million
Key Trends
  • Increasing technological advancement
  • Integration of Industry 4.0
Growth Factors
  • Rising demand for automation and robotics

Industrial Air Filtration Space:

Attributes Industrial Air Filtration Sales
Value-based CAGR (2023 to 2033) 5.7%
Projected Value (2033) US$ 56.1 billion
Key Trends
  • Increasing demand for efficient and advanced air filtration
  • Growing industrialization
Growth Factors
  • Rising demand for automation and robotics

Industrial Radiography Space:

Attributes Industrial Radiography Sales
Value-based CAGR (2023 to 2033) 8.3%
Projected Value (2033) US$ 1,446.0 million
Key Trends
  • Increasing demand for reliable, non-destructive testing
  • Shift towards advanced energy solutions
Growth Factors
  • Rising demand for automation and robotics

Get the data you need at a Fraction of the cost

Personalize your report by choosing insights you need
and save 40%!

Country-wise Insights

The below table explains the revenue generated by the sales of industrial furnace in Europe by the top 3 countries. Impact analysis of the demand for industrial furnace in Europe by countries reveals that Germany and Spain are anticipated to remain at the top by exhibiting CAGRs of 5.0% and 4.6%, respectively, between 2023 and 2033. The United Kingdom is expected to propel at 4.6% CAGR from 2023 to 2033.

Countries Value-based CAGR (2023 to 2033)
Germany 5.0%
United Kingdom 4.6%
Spain 4.9%

Precision Engineering Companies in Germany Driving Innovation

Sales of industrial furnace in Germany will likely total US$ 679.4 million in worth by 2033. It is expected to expand at a considerable CAGR of 5.0% during the forecast period. Revenue stood at US$ 398.0 million in 2022.

Germany has a robust and diversified industrial base, including automotive, machinery, chemicals, steel, and electronics sectors. These industries use industrial furnaces for heat treatment, metal smelting, and materials processing. The country's strong industrial presence drives consistent demand for such durable furnace solutions.

Germany is renowned for its manufacturing excellence and precision engineering. The country's reputation for producing high-quality and technologically advanced products underscores the booming business in this sector. This necessitates using state-of-the-art industrial furnaces to meet stringent quality and performance standards. This demand for precision manufacturing drives the need for advanced furnace technologies.

Germany is a leader in technological innovation, which extends to the industrial furnace space. German companies are at the forefront of developing energy-efficient and environmentally friendly furnace technologies. These innovations reduce operating costs and align with global sustainability goals. This makes them attractive to both domestic and international landscapes.

Demand for Customized Furnace Solutions to Augment Sales in the United Kingdom

The United Kingdom is expected to create a regional demand for industrial furnace worth US$ 565.1 million by 2033. It is likely to soar at 4.6% CAGR between 2023 and 2033.

Industrial furnaces in the United Kingdom are used across various industries, including metallurgy, automotive, aerospace, and manufacturing, for heat treatment, melting, and forging.

The adoption of automation and digitalization in industrial furnace operations is increasing to enhance process control, safety, and productivity. Stringent environmental regulations in the United Kingdom require furnaces to meet emissions standards, leading to the development of cleaner technologies.

There's a demand for customized furnace solutions to meet specific application needs and optimize production processes. Companies need to explore the integration of renewable energy sources, such as solar and wind power, into their furnace operations to reduce carbon footprint.

Growing Emphasis on Energy-efficient Furnaces in Spain to Uplift Revenue

Spain is set to generate a steady CAGR of 4.9% between 2023 and 2033. The country is projected to reach US$ 532.4 million by 2033. There is a growing emphasis on energy-efficient industrial furnaces to reduce operating costs and meet environmental regulations.

Advancements in furnace technology, including automation, control systems, and sensors, have improved the efficiency and precision of industrial processes. Stringent environmental regulations will likely drive the adoption of clean and more sustainable furnace technologies, such as electric furnaces and those using renewable energy sources.

The metallurgical business is a key consumer of industrial furnaces in Spain, particularly for smelting and heat treatment processes. The ceramics and glass industries also rely heavily on industrial furnaces for strategies, including kiln firing and glass melting.

Category-wise Insights

The table below highlights the European industrial furnace demand based on different categories. Under material type, the brick-lined segment will reach 4.7% CAGR between 2023 and 2033. It is expected to be followed by ceramic-lined and metal lined.

Category Product
Sub-category Brick Lined
Value-based CAGR (2023 to 2033) 4.7%

Brick Lined Industrial Furnace to Gain Traction Globally through 2033

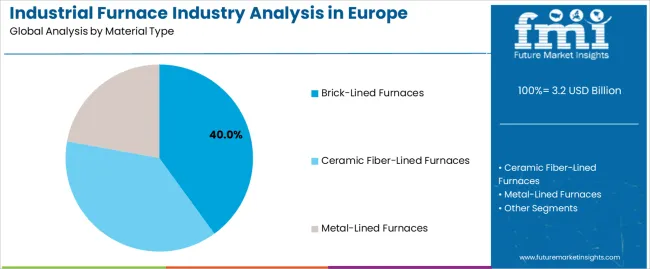
By material type, brick lined segment accounts for a prominent share of 44.5% by 2033. It is predicted to showcase a CAGR of 4.7% in the forecast period. It is expected to capture revenue of US$ 1,837.5 million by 2033 end.

Brick linings are popular since they provide excellent thermal insulation, helping to maintain high temperatures within the furnace while conserving energy. Bricks are known for their durability and resistance to high temperatures, making them a reliable choice for long-term furnace operation.

Brick linings are less susceptible to corrosion, which is essential for industries involving aggressive materials or harsh environments. Brick linings can be customized to suit various industrial applications, from metal smelting to ceramics production, offering versatility in design and function. In the long run, brick-lined furnaces can be cost-effective due to their durability and low maintenance requirements.

Flourishing Demand from Automotive Manufacturing to Fuel Growth

The table below highlights the sales outlook of industrial furnace in Europe based on application. Under application, the automotive manufacturing segment is set to showcase a significant CAGR of 4.7% between 2023 and 2033. It is expected to be followed by the aerospace and metalworking segments.

Category Product
Sub-category Automotive Manufacturing
Value-based CAGR (2023 to 2033) 4.7%

By application type, the automotive manufacturing segment expanded at a CAGR of 2.6% in the historical period. It will likely showcase a steady CAGR of 4.7% during the evaluation period.

Europe has a robust automotive landscape, with high demand for industrial furnaces for processes such as heat treatment, casting, and forging of automotive components. Automotive manufacturing requires precise and high-quality heat treatment processes to ensure the durability and performance of vehicle components, making industrial furnaces essential.

The automotive space is constantly evolving, leading to the adoption of advanced manufacturing technologies that rely on specialized industrial furnaces for precise temperature control and material processing. Strict environmental regulations in Europe necessitate cleaner and more efficient manufacturing processes, driving the need for modern, energy-efficient industrial furnaces.

Automotive manufacturers invest heavily in research and development to improve their products, leading to increased demand for specialized furnaces for prototyping and testing. Collaboration between automotive and furnace manufacturers can lead to the development of customized furnace solutions that cater to specific automotive production needs.

Competitive Landscape of Europe Industrial Furnace Ecosystem

Key manufacturers invest in research and development to develop energy-efficient and eco-friendly furnace technologies. They are diversifying their product portfolios to cater to various industries. It includes metallurgy, ceramics, glass, and aerospace, reducing dependency on a single industrial ecosystem.

Recent developments in the Europe Industrial Furnace Space:

  • In January 2023, Verallia, the top European and third-leading maker of glass food and beverage containers worldwide. It announces the building of two more furnaces to boost output and meet consumer demands.
  • In December 2022, Encirc, a top glass producer and the world's leading producer of premium alcoholic beverages. It announced their collaboration to develop its initial net zero glass containers at scale by 2030.
  • In November 2021, Isecam revealed intentions to invest in a new glass manufacturing furnace in Eskisehir for US$ 84 million. Isecam's new furnace investment, with a 155,000-ton yearly capacity. This is anticipated for Eskisehir, where four furnaces are already being used to produce glass packaging.

Scope of Report

Attribute Details
Estimated Size (2023) US$ 2,789.7 million
Projected Valuation (2033) US$ 4,514.5 million
Value-based CAGR (2023 to 2033) 4.9%
Forecast Period 2023 to 2033
Historical Data Available for 2018 to 2022
Sales Analysis US$ Million for Value and Units for Volume
Key Regions Covered Germany, Italy, France, United Kingdom, Spain, Belgium, Netherland, Luxembourg, Russia, Rest of Europe
Key Segments Covered
  • Material Type
  • Maximum Temperature,
  • Operation Type
  • Process Type
  • End use
  • Control System
  • Countries
Key Companies Profiled
  • Nabertherm
  • Ispen
  • Despatch Industries
  • Ebner Industrieofenbau GmbH
  • CM Furnaces Inc.
  • Grieve Corporation
  • Lindberg/MPH
  • BTU International
  • BOREL Swiss
  • Nutec Bickley
  • SECO/WARWICK Group
  • Wellman Furnaces
  • BMI Fours Industriels
  • Heatmasters Group
  • Furnace Engineering Pty Ltd.
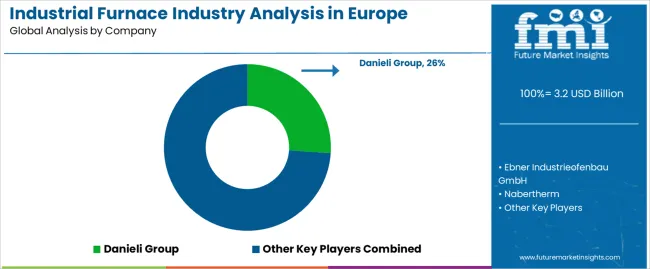
  • Danieli Group
  • ECM Technologies

Segmentation by Category

By Material Type:

  • Brick Lined
  • Metal Lined
  • Ceramic Lined

By Maximum Temperature:

  • 800 to 999
  • 1000 to 1200

By Operation Type:

  • Gas Burner Operated
  • Electrically Operated

By Process Type:

  • Batch Furnaces
  • Continuous Furnaces

By End-use:

  • Automotive Manufacturing
    • Heat Treatment
    • Brazing
    • Glass Bending
  • Aerospace
    • Heat Treatment
    • Brazing
    • Sintering
  • Metalworking
    • Heat Treatment
    • Brazing
    • Sintering
  • Steel and Iron Production
    • Tempering
    • Annealing
    • Acid regeneration
    • Others
  • Glass Manufacturing
    • Heat Treatment
    • Glass Bending
  • Chemicals
    • Heat Treatment
    • Sintering
    • Specialized process
  • Electronics
    • Heat Treatment
    • Brazing
    • Sintering
  • Others

By Control System:

  • Manual
  • Programmable

By Countries:

  • Germany
  • Italy
  • France
  • United Kingdom
  • Spain
  • Belgium
  • Netherland
  • Luxembourg
  • Russia
  • Rest of Europe

Frequently Asked Questions

What is the estimated value of industrial furnace demand in Europe by 2033?

The demand for industrial furnace in Europe is expected to hit US$ 4,514.5 million by 2023.

What is the growth rate Of industrial furnace in Europe?

The growth rate of industrial furnace is projected to expand by 4.9% CAGR between 2023 and 2033.

What will be the value industrial furnace in Europe in 2023?

The value industrial furnace in Europe is set to total US$ 2,789.7 million in 2023.

What is the best band in the of industrial furnace across Europe?

Nabertherm, Ispen, and Despatch Industries are few leading brand across Europe.

What is the CAGR value of industrial furnace sales in Germany?

Germany is set to exhibit a 5.0% CAGR in the Europe from 2023 to 2033.

Table of Content

1. Executive Summary

    1.1. Europe Market Outlook

    1.2. Demand Side Trends

    1.3. Supply Side Trends

    1.4. Technology Roadmap

    1.5. Analysis and Recommendations

2. Market Overview

    2.1. Market Coverage / Taxonomy

    2.2. Market Definition / Scope / Limitations

3. Key Market Trends

    3.1. Key Trends Impacting the Market

    3.2. Product Innovation / Development Trends

4. Key Success Factors

    4.1. Product Adoption / Usage Analysis

    4.2. Product USPs / Features

    4.3. Strategic Promotional Strategies

5. Europe Market Demand Analysis 2018 to 2022 and Forecast, 2023 to 2033

    5.1. Historical Market Volume (Tons) Analysis, 2018 to 2022

    5.2. Current and Future Market Volume (Tons) Projections, 2023 to 2033

    5.3. Y-o-Y Growth Trend Analysis

6. Europe Market - Pricing Analysis

    6.1. Regional Pricing Analysis By Material Type

    6.2. Europe Average Pricing Analysis Benchmark

7. Europe Market Demand (in Value or Size in US$ Million) Analysis 2018 to 2022 and Forecast, 2023 to 2033

    7.1. Historical Market Value (US$ Million) Analysis, 2018 to 2022

    7.2. Current and Future Market Value (US$ Million) Projections, 2023 to 2033

        7.2.1. Y-o-Y Growth Trend Analysis

        7.2.2. Absolute $ Opportunity Analysis

8. Market Background

    8.1. Macro-Economic Factors

        8.1.1. Europe GDP Growth Outlook

        8.1.2. Europe Construction industry Overview

        8.1.3. Manufacturing Value-Added

        8.1.4. Industry Value Added

        8.1.5. Parent Market Outlook

        8.1.6. Other Macro-Economic Factors

    8.2. Forecast Factors - Relevance & Impact

        8.2.1. Top Companies Historical Growth

        8.2.2. GDP Growth forecast

        8.2.3. Manufacturing Industry forecast

        8.2.4. Europe Urbanization Growth Outlook

        8.2.5. Business Climate

        8.2.6. Covid-19 Impact Assessment

        8.2.7. End-use Industry Growth Outlook

    8.3. Value Chain

        8.3.1. Product Manufacturers

        8.3.2. End Users

        8.3.3. Avg. Profitability Margins

    8.4. COVID-19 Crisis - Impact Assessment

        8.4.1. Current Statistics

        8.4.2. Short-Mid-Long Term Outlook

        8.4.3. Likely Rebound

    8.5. Market Dynamics

        8.5.1. Drivers

        8.5.2. Restraints

        8.5.3. Opportunity Analysis

9. Europe Market Analysis 2018 to 2022 and Forecast 2023 to 2033, By Material Type 

    9.1. Introduction / Key Findings

    9.2. Historical Market Size (US$ Million) and Volume Analysis By Material Type, 2018 to 2022

    9.3. Current and Future Market Size (US$ Million) and Volume Analysis and Forecast By Material Type, 2023 to 2033

        9.3.1. Brick-Lined Furnaces

        9.3.2. Ceramic Fiber-Lined Furnaces

        9.3.3. Metal-Lined Furnaces

    9.4. Market Attractiveness Analysis By Material Type

10. Europe Market Analysis 2018 to 2022 and Forecast 2023 to 2033, By Maximum Temperature

    10.1. Introduction / Key Findings

    10.2. Historical Market Size (US$ Million) and Volume Analysis By Maximum Temperature, 2018 to 2022

    10.3. Current and Future Market Size (US$ Million) and Volume Analysis and Forecast By Maximum Temperature, 2023 to 2033

        10.3.1. 800 to 999

        10.3.2. 1000 to 1200

    10.4. Market Attractiveness Analysis By Maximum Temperature

11. Europe Market Analysis 2018 to 2022 and Forecast 2023 to 2033, By Operation

    11.1. Introduction / Key Findings

    11.2. Historical Market Size (US$ Million) and Volume Analysis By Operation, 2018 to 2022

    11.3. Current and Future Market Size (US$ Million) and Volume Analysis and Forecast By Operation, 2023 to 2033

        11.3.1. Gas Burner Operated

        11.3.2. Electrically Operated

    11.4. Market Attractiveness Analysis By Operation

12. Europe Market Analysis 2018 to 2022 and Forecast 2023 to 2033, By Process

    12.1. Introduction / Key Findings

    12.2. Historical Market Size (US$ Million) and Volume Analysis By Process, 2018 to 2022

    12.3. Current and Future Market Size (US$ Million) and Volume Analysis and Forecast By Process, 2023 to 2033

        12.3.1. Batch Furnaces

        12.3.2. Continuous Furnaces

    12.4. Market Attractiveness Analysis By Process

13. Europe Market Analysis 2018 to 2022 and Forecast 2023 to 2033, By Control System

    13.1. Introduction / Key Findings

    13.2. Historical Market Size (US$ Million) and Volume Analysis By Control System, 2018 to 2022

    13.3. Current and Future Market Size (US$ Million) and Volume Analysis and Forecast By Control System, 2023 to 2033

        13.3.1. Manual Control Furnaces

        13.3.2. Programmable Control Furnaces

    13.4. Market Attractiveness Analysis By Control System

14. Europe Market Analysis 2018 to 2022 and Forecast 2023 to 2033, By End Use

    14.1. Introduction / Key Findings

    14.2. Historical Market Size (US$ Million) and Volume Analysis By End Use, 2018 to 2022

    14.3. Current and Future Market Size (US$ Million) and Volume Analysis and Forecast By End Use, 2023 to 2033

        14.3.1. Automotive Manufacturing

            14.3.1.1. Heat Treatment

            14.3.1.2. Brazing

            14.3.1.3. Glass Bending

        14.3.2. Aerospace

            14.3.2.1. Heat Treatment

            14.3.2.2. Brazing

            14.3.2.3. Sintering

        14.3.3. Metalworking

            14.3.3.1. Heat Treatment

            14.3.3.2. Brazing

            14.3.3.3. Sintering

        14.3.4. Steel and Iron Production

            14.3.4.1. Tempering

            14.3.4.2. Annealing

            14.3.4.3. Acid regeneration

            14.3.4.4. Others

        14.3.5. Glass Manufacturing

            14.3.5.1. Heat Treatment

            14.3.5.2. Glass Bending

        14.3.6. Chemicals

            14.3.6.1. Heat Treatment

            14.3.6.2. Sintering

            14.3.6.3. Specialized process

        14.3.7. Electronics

            14.3.7.1. Heat Treatment

            14.3.7.2. Brazing

            14.3.7.3. Sintering

        14.3.8. Others

    14.4. Market Attractiveness Analysis By End Use

15. Europe Market Analysis 2018 to 2022 and Forecast 2023 to 2033, by Region

    15.1. Introduction

    15.2. Historical Market Size (US$ Million) and Volume Analysis By Region, 2018 to 2022

    15.3. Current Market Size (US$ Million) and Volume Analysis and Forecast By Region, 2023 to 2033

        15.3.1. Germany

        15.3.2. Italy

        15.3.3. France

        15.3.4. UK

        15.3.5. Spain

        15.3.6. Belgium

        15.3.7. Netherland

        15.3.8. Luxembourg

        15.3.9. Russia

        15.3.10. Rest of Europe

    15.4. Market Attractiveness Analysis By Region

16. Germany Market Analysis 2018 to 2022 and Forecast 2023 to 2033

    16.1. Introduction

    16.2. Pricing Analysis

    16.3. Historical Market Size (US$ Million) and Volume Trend Analysis By Market Taxonomy, 2018 to 2022

    16.4. Market Size (US$ Million) and Volume Forecast By Market Taxonomy, 2023 to 2033

        16.4.1. By Country

            16.4.1.1. Northern Germany

            16.4.1.2. Western Germany

            16.4.1.3. Eastern Germany

            16.4.1.4. Southern Germany

        16.4.2. By Material Type

        16.4.3. By Maximum Temperature

        16.4.4. By Operation

        16.4.5. By Process

        16.4.6. By Control System

        16.4.7. By End Use

    16.5. Market Attractiveness Analysis

        16.5.1. By Country

        16.5.2. By Material Type

        16.5.3. By Maximum Temperature

        16.5.4. By Operation

        16.5.5. By Process

        16.5.6. By Control System

        16.5.7. By End Use

17. Italy Market Analysis 2018 to 2022 and Forecast 2023 to 2033

    17.1. Introduction

    17.2. Pricing Analysis

    17.3. Historical Market Size (US$ Million) and Volume Trend Analysis By Market Taxonomy, 2018 to 2022

    17.4. Market Size (US$ Million) and Volume Forecast By Market Taxonomy, 2023 to 2033

        17.4.1. By Country

            17.4.1.1. Northern

            17.4.1.2. Eastern

            17.4.1.3. Southern

        17.4.2. By Material Type

        17.4.3. By Maximum Temperature

        17.4.4. By Operation

        17.4.5. By Process

        17.4.6. By Control System

        17.4.7. By End Use

    17.5. Market Attractiveness Analysis

        17.5.1. By Country

        17.5.2. By Material Type

        17.5.3. By Maximum Temperature

        17.5.4. By Operation

        17.5.5. By Process

        17.5.6. By Control System

        17.5.7. By End Use

18. France Market Analysis 2018 to 2022 and Forecast 2023 to 2033

    18.1. Introduction

    18.2. Pricing Analysis

    18.3. Historical Market Size (US$ Million) and Volume Trend Analysis By Market Taxonomy, 2018 to 2022

    18.4. Market Size (US$ Million) and Volume Forecast By Market Taxonomy, 2023 to 2033

        18.4.1. By Country

            18.4.1.1. Northern

            18.4.1.2. Southern

            18.4.1.3. Central

            18.4.1.4. Eastern

        18.4.2. By Material Type

        18.4.3. By Maximum Temperature

        18.4.4. By Operation

        18.4.5. By Process

        18.4.6. By Control System

        18.4.7. By End Use

    18.5. Market Attractiveness Analysis

        18.5.1. By Country

        18.5.2. By Material Type

        18.5.3. By Maximum Temperature

        18.5.4. By Operation

        18.5.5. By Process

        18.5.6. By Control System

        18.5.7. By End Use

19. UK Market Analysis 2018 to 2022 and Forecast 2023 to 2033

    19.1. Introduction

    19.2. Pricing Analysis

    19.3. Historical Market Size (US$ Million) and Volume Trend Analysis By Market Taxonomy, 2018 to 2022

    19.4. Market Size (US$ Million) and Volume Forecast By Market Taxonomy, 2023 to 2033

        19.4.1. By Country

            19.4.1.1. England

            19.4.1.2. Scotland

            19.4.1.3. Whales

            19.4.1.4. Northern Island

        19.4.2. By Material Type

        19.4.3. By Maximum Temperature

        19.4.4. By Operation

        19.4.5. By Process

        19.4.6. By Control System

        19.4.7. By End Use

    19.5. Market Attractiveness Analysis

        19.5.1. By Country

        19.5.2. By Material Type

        19.5.3. By Maximum Temperature

        19.5.4. By Operation

        19.5.5. By Process

        19.5.6. By Control System

        19.5.7. By End Use

20. Spain Market Analysis 2018 to 2022 and Forecast 2023 to 2033

    20.1. Introduction

    20.2. Pricing Analysis

    20.3. Historical Market Size (US$ Million) and Volume Trend Analysis By Market Taxonomy, 2018 to 2022

    20.4. Market Size (US$ Million) and Volume Forecast By Market Taxonomy, 2023 to 2033

        20.4.1. By Country

            20.4.1.1. Northern Spain

            20.4.1.2. Eastern Spain

            20.4.1.3. Central Spain

            20.4.1.4. Southern Spain

        20.4.2. By Material Type

        20.4.3. By Maximum Temperature

        20.4.4. By Operation

        20.4.5. By Process

        20.4.6. By Control System

        20.4.7. By End Use

    20.5. Market Size (US$ Million) and Volume Forecast By Market Taxonomy, 2023 to 2033

        20.5.1. By Material Type

        20.5.2. By Maximum Temperature

        20.5.3. By Operation

        20.5.4. By Process

        20.5.5. By Control System

        20.5.6. By End Use

    20.6. Market Attractiveness Analysis

        20.6.1. By Material Type

        20.6.2. By Maximum Temperature

        20.6.3. By Operation

        20.6.4. By Process

        20.6.5. By Control System

        20.6.6. By End Use

21. Belgium Market Analysis 2018 to 2022 and Forecast 2023 to 2033

    21.1. Introduction

    21.2. Pricing Analysis

    21.3. Historical Market Size (US$ Million) and Volume Trend Analysis By Market Taxonomy, 2018 to 2022

    21.4. Market Size (US$ Million) and Volume Forecast By Market Taxonomy, 2023 to 2033

        21.4.1. By Country

            21.4.1.1. Flanders

            21.4.1.2. Wallonia

            21.4.1.3. Brussels-Capital Region

        21.4.2. By Material Type

        21.4.3. By Maximum Temperature

        21.4.4. By Operation

        21.4.5. By Process

        21.4.6. By Control System

        21.4.7. By End Use

    21.5. Market Size (US$ Million) and Volume Forecast By Market Taxonomy, 2023 to 2033

        21.5.1. By Material Type

        21.5.2. By Maximum Temperature

        21.5.3. By Operation

        21.5.4. By Process

        21.5.5. By Control System

        21.5.6. By End Use

    21.6. Market Attractiveness Analysis

        21.6.1. By Material Type

        21.6.2. By Maximum Temperature

        21.6.3. By Operation

        21.6.4. By Process

        21.6.5. By Control System

        21.6.6. By End Use

22. Netherland Market Analysis 2018 to 2022 and Forecast 2023 to 2033

    22.1. Introduction

    22.2. Pricing Analysis

    22.3. Historical Market Size (US$ Million) and Volume Trend Analysis By Market Taxonomy, 2018 to 2022

    22.4. Market Size (US$ Million) and Volume Forecast By Market Taxonomy, 2023 to 2033

        22.4.1. By Country

            22.4.1.1. North Netherlands

            22.4.1.2. West Netherlands

            22.4.1.3. East Netherlands

            22.4.1.4. South Netherlands

        22.4.2. By Material Type

        22.4.3. By Maximum Temperature

        22.4.4. By Operation

        22.4.5. By Process

        22.4.6. By Control System

        22.4.7. By End Use

    22.5. Market Size (US$ Million) and Volume Forecast By Market Taxonomy, 2023 to 2033

        22.5.1. By Material Type

        22.5.2. By Maximum Temperature

        22.5.3. By Operation

        22.5.4. By Process

        22.5.5. By Control System

        22.5.6. By End Use

    22.6. Market Attractiveness Analysis

        22.6.1. By Material Type

        22.6.2. By Maximum Temperature

        22.6.3. By Operation

        22.6.4. By Process

        22.6.5. By Control System

        22.6.6. By End Use

23. Luxembourg Market Analysis 2018 to 2022 and Forecast 2023 to 2033

    23.1. Introduction

    23.2. Pricing Analysis

    23.3. Historical Market Size (US$ Million) and Volume Trend Analysis By Market Taxonomy, 2018 to 2022

    23.4. Market Attractiveness Analysis

        23.4.1. By Country

        23.4.2. By Material Type

        23.4.3. By Maximum Temperature

        23.4.4. By Operation

        23.4.5. By Process

        23.4.6. By Control System

        23.4.7. By End Use

    23.5. Market Size (US$ Million) and Volume Forecast By Market Taxonomy, 2023 to 2033

        23.5.1. By Material Type

        23.5.2. By Maximum Temperature

        23.5.3. By Operation

        23.5.4. By Process

        23.5.5. By Control System

        23.5.6. By End Use

    23.6. Market Attractiveness Analysis

        23.6.1. By Material Type

        23.6.2. By Maximum Temperature

        23.6.3. By Operation

        23.6.4. By Process

        23.6.5. By Control System

        23.6.6. By End Use

24. Russia Market Analysis 2018 to 2022 and Forecast 2023 to 2033

    24.1. Introduction

    24.2. Pricing Analysis

    24.3. Historical Market Size (US$ Million) and Volume Trend Analysis By Market Taxonomy, 2018 to 2022

    24.4. Market Size (US$ Million) and Volume Forecast By Market Taxonomy, 2023 to 2033

        24.4.1. By Country

            24.4.1.1. European Russia

            24.4.1.2. Siberia

            24.4.1.3. Far East

        24.4.2. By Material Type

        24.4.3. By Maximum Temperature

        24.4.4. By Operation

        24.4.5. By Process

        24.4.6. By Control System

        24.4.7. By End Use

    24.5. Market Attractiveness Analysis

        24.5.1. By Country

        24.5.2. By Material Type

        24.5.3. By Maximum Temperature

        24.5.4. By Operation

        24.5.5. By Process

        24.5.6. By Control System

        24.5.7. By End Use

    24.6. Market Trends

    24.7. Key Market Participants - Intensity Mapping

    24.8. Drivers and Restraints - Impact Analysis

25. Rest of Europe Market Analysis 2018 to 2022 and Forecast 2023 to 2033

    25.1. Introduction

    25.2. Pricing Analysis

    25.3. Historical Market Size (US$ Million) and Volume Trend Analysis By Market Taxonomy, 2018 to 2022

    25.4. Market Size (US$ Million) and Volume Forecast By Market Taxonomy, 2023 to 2033

        25.4.1. By Material Type

        25.4.2. By Maximum Temperature

        25.4.3. By Operation

        25.4.4. By Process

        25.4.5. By Control System

        25.4.6. By End Use

    25.5. Market Attractiveness Analysis

        25.5.1. By Material Type

        25.5.2. By Maximum Temperature

        25.5.3. By Operation

        25.5.4. By Process

        25.5.5. By Control System

        25.5.6. By End Use

26. Market Structure Analysis

    26.1. Market Analysis by Tier of Companies (Industrial Furnace)

    26.2. Market Concentration

    26.3. Market Share Analysis of Top Players

    26.4. Production Capacity Analysis

    26.5. Market Presence Analysis

        26.5.1. By Operation Footprint of Players

        26.5.2. By Regional Footprint of Players

        26.5.3. By Channel Footprint of Players

27. Competition Analysis

    27.1. Competition Dashboard

    27.2. Competition Benchmarking

    27.3. Competition Deep Dive

        27.3.1. Nabertherm

            27.3.1.1. Overview

            27.3.1.2. Product Portfolio

            27.3.1.3. Profitability by Market Segments (Product/Channel/Region)

            27.3.1.4. Sales Footprint

            27.3.1.5. Strategy Overview

        27.3.2. Ispen

            27.3.2.1. Overview

            27.3.2.2. Product Portfolio

            27.3.2.3. Profitability by Market Segments (Product/Channel/Region)

            27.3.2.4. Sales Footprint

            27.3.2.5. Strategy Overview

        27.3.3. Despatch Industries

            27.3.3.1. Overview

            27.3.3.2. Product Portfolio

            27.3.3.3. Profitability by Market Segments (Product/Channel/Region)

            27.3.3.4. Sales Footprint

            27.3.3.5. Strategy Overview

        27.3.4. Ebner Industrieofenbau GmbH

            27.3.4.1. Overview

            27.3.4.2. Product Portfolio

            27.3.4.3. Profitability by Market Segments (Product/Channel/Region)

            27.3.4.4. Sales Footprint

            27.3.4.5. Strategy Overview

        27.3.5. CM Furnaces Inc.

            27.3.5.1. Overview

            27.3.5.2. Product Portfolio

            27.3.5.3. Profitability by Market Segments (Product/Channel/Region)

            27.3.5.4. Sales Footprint

            27.3.5.5. Strategy Overview

        27.3.6. Grieve Corporation

            27.3.6.1. Overview

            27.3.6.2. Product Portfolio

            27.3.6.3. Profitability by Market Segments (Product/Channel/Region)

            27.3.6.4. Sales Footprint

            27.3.6.5. Strategy Overview

        27.3.7. Lindberg/MPH

            27.3.7.1. Overview

            27.3.7.2. Product Portfolio

            27.3.7.3. Profitability by Market Segments (Product/Channel/Region)

            27.3.7.4. Sales Footprint

            27.3.7.5. Strategy Overview

        27.3.8. BTU International

            27.3.8.1. Overview

            27.3.8.2. Product Portfolio

            27.3.8.3. Profitability by Market Segments (Product/Channel/Region)

            27.3.8.4. Sales Footprint

            27.3.8.5. Strategy Overview

        27.3.9. BOREL Swiss

            27.3.9.1. Overview

            27.3.9.2. Product Portfolio

            27.3.9.3. Profitability by Market Segments (Product/Channel/Region)

            27.3.9.4. Sales Footprint

            27.3.9.5. Strategy Overview

        27.3.10. Nutec Bickley

            27.3.10.1. Overview

            27.3.10.2. Product Portfolio

            27.3.10.3. Profitability by Market Segments (Product/Channel/Region)

            27.3.10.4. Sales Footprint

            27.3.10.5. Strategy Overview

        27.3.11. SECO/WARWICK Group

            27.3.11.1. Overview

            27.3.11.2. Product Portfolio

            27.3.11.3. Profitability by Market Segments (Product/Channel/Region)

            27.3.11.4. Sales Footprint

            27.3.11.5. Strategy Overview

        27.3.12. Wellman Furnaces

            27.3.12.1. Overview

            27.3.12.2. Product Portfolio

            27.3.12.3. Profitability by Market Segments (Product/Channel/Region)

            27.3.12.4. Sales Footprint

            27.3.12.5. Strategy Overview

        27.3.13. BMI Fours Industriels

            27.3.13.1. Overview

            27.3.13.2. Product Portfolio

            27.3.13.3. Profitability by Market Segments (Product/Channel/Region)

            27.3.13.4. Sales Footprint

            27.3.13.5. Strategy Overview

        27.3.14. Heatmasters Group

            27.3.14.1. Overview

            27.3.14.2. Product Portfolio

            27.3.14.3. Profitability by Market Segments (Product/Channel/Region)

            27.3.14.4. Sales Footprint

            27.3.14.5. Strategy Overview

        27.3.15. Furnace Engineering Pty Ltd.

            27.3.15.1. Overview

            27.3.15.2. Product Portfolio

            27.3.15.3. Profitability by Market Segments (Product/Channel/Region)

            27.3.15.4. Sales Footprint

            27.3.15.5. Strategy Overview

        27.3.16. Danieli Group

            27.3.16.1. Overview

            27.3.16.2. Product Portfolio

            27.3.16.3. Profitability by Market Segments (Product/Channel/Region)

            27.3.16.4. Sales Footprint

            27.3.16.5. Strategy Overview

        27.3.17. ECM Technologies

            27.3.17.1. Overview

            27.3.17.2. Product Portfolio

            27.3.17.3. Profitability by Market Segments (Product/Channel/Region)

            27.3.17.4. Sales Footprint

            27.3.17.5. Strategy Overview

28. Assumptions and Acronyms Used

29. Research Methodology

List of Tables

Table 01: Europe Market Value (US$ Million) and Volume (Units) Historical Data 2018 to 2022 and Forecast 2023 to 2033 By Material

Table 02: Europe Market Value (US$ Million) and Volume (Units) Historical Data 2018 to 2022 and Forecast 2023 to 2033 By Process Type

Table 03: Europe Market Value (US$ Million) and Volume (Units) Historical Data 2018 to 2022 and Forecast 2023 to 2033 By Operation Type

Table 04: Europe Market Value (US$ Million) and Volume (Units) Historical Data 2018 to 2022 and Forecast 2023 to 2033 By Maximum Temp

Table 5: Europe Market Value (US$ Million) and Volume (Units) Historical Data 2018 to 2022 and Forecast 2023 to 2033 By Application

Table 5: Europe Market Value (US$ Million) and Volume (Units) Historical Data 2018 to 2022 and Forecast 2023 to 2033 By Application

Table 06: Europe Market Volume (Units) Historical Data 2018 to 2022 and Forecast 2023 to 2033 By Application

Table 08: Europe Market Value (US$ Million) Historical Data 2018 to 2022 and Forecast 2023 to 2033 By Application

Table 09: Europe Market Value (US$ Million) and Volume (Units) Historical Data 2018 to 2022 and Forecast 2023 to 2033 By Control System

Table 10: Europe Market Value (US$ Million) and Volume (Units) Historical Data 2018 to 2022 and Forecast 2023 to 2033 By Regions

Table 11: Europe Market Value (US$ Million) and Volume (Units) Historical Data 2018 to 2022 and Forecast 2023 to 2033 By Regions

Table 12: Germany Market Value (US$ Million) and Volume (Units) Historical Data 2018 to 2022 and Forecast 2023 to 2033 By Country

Table 13: Germany Market Value (US$ Million) and Volume (Units) Historical Data 2018 to 2022 and Forecast 2023 to 2033 By Material Type

Table 14: Germany Market Value (US$ Million) and Volume (Units) Historical Data 2018 to 2022 and Forecast 2023 to 2033 By Process Type

Table 15: Germany Market Value (US$ Million) and Volume (Units) Historical Data 2018 to 2022 and Forecast 2023 to 2033 By Operation Type

Table 16: Germany Market Value (US$ Million) and Volume (Units) Historical Data 2018 to 2022 and Forecast 2023 to 2033 By Maximum Temp

Table 17: Germany Market Value (US$ Million) and Volume (Units) Historical Data 2018 to 2022 and Forecast 2023 to 2033 By Application

Table 18: Germany Market Volume (Units) Historical Data 2018 to 2022 and Forecast 2023 to 2033 By Application

Table 19: Germany Market Value (US$ Million) Historical Data 2018 to 2022 and Forecast 2023 to 2033 By Application

Table 20: Germany Market Value (US$ Million) Historical Data 2018 to 2022 and Forecast 2023 to 2033 By Application

Table 21: Germany Market Value (US$ Million) and Volume (Units) Historical Data 2018 to 2022 and Forecast 2023 to 2033 By Control System

Table 22: Italy Market Value (US$ Million) and Volume (Units) Historical Data 2018 to 2022 and Forecast 2023 to 2033 By Country

Table 23: Italy Market Value (US$ Million) and Volume (Units) Historical Data 2018 to 2022 and Forecast 2023 to 2033 By Material Type

Table 24: Italy Market Value (US$ Million) and Volume (Units) Historical Data 2018 to 2022 and Forecast 2023 to 2033 By Process Type

Table 25: Italy Market Value (US$ Million) and Volume (Units) Historical Data 2018 to 2022 and Forecast 2023 to 2033 By Operation Type

Table 26: Italy Market Value (US$ Million) and Volume (Units) Historical Data 2018 to 2022 and Forecast 2023 to 2033 By Maximum Temp

Table 27: Italy Market Value (US$ Million) and Volume (Units) Historical Data 2018 to 2022 and Forecast 2023 to 2033 By Application

Table 28: Italy Market Volume (Units) Historical Data 2018 to 2022 and Forecast 2023 to 2033 By Application

Table 29: Italy Market Value (US$ Million) Historical Data 2018 to 2022 and Forecast 2023 to 2033 By Application

Table 30: Italy Market Value (US$ Million) Historical Data 2018 to 2022 and Forecast 2023 to 2033 By Application

Table 31: Italy Market Value (US$ Million) and Volume (Units) Historical Data 2018 to 2022 and Forecast 2023 to 2033 By Control System

Table 32: France Market Value (US$ Million) and Volume (Units) Historical Data 2018 to 2022 and Forecast 2023 to 2033 By Country

Table 33: France Market Value (US$ Million) and Volume (Units) Historical Data 2018 to 2022 and Forecast 2023 to 2033 By Material Type

Table 34: France Market Value (US$ Million) and Volume (Units) Historical Data 2018 to 2022 and Forecast 2023 to 2033 By Process Type

Table 35: France Market Value (US$ Million) and Volume (Units) Historical Data 2018 to 2022 and Forecast 2023 to 2033 By Operation Type

Table 36: France Market Value (US$ Million) and Volume (Units) Historical Data 2018 to 2022 and Forecast 2023 to 2033 By Maximum Temp

Table 37: France Market Value (US$ Million) and Volume (Units) Historical Data 2018 to 2022 and Forecast 2023 to 2033 By Application

Table 38: France Market Volume (Units) Historical Data 2018 to 2022 and Forecast 2023 to 2033 By Application

Table 39: France Market Value (US$ Million) Historical Data 2018 to 2022 and Forecast 2023 to 2033 By Application

Table 40: France Market Value (US$ Million) Historical Data 2018 to 2022 and Forecast 2023 to 2033 By Application

Table 41: France Market Value (US$ Million) and Volume (Units) Historical Data 2018 to 2022 and Forecast 2023 to 2033 By Control System

Table 42: UK Market Value (US$ Million) and Volume (Units) Historical Data 2018 to 2022 and Forecast 2023 to 2033 By Country

Table 43: UK Market Value (US$ Million) and Volume (Units) Historical Data 2018 to 2022 and Forecast 2023 to 2033 By Material Type

Table 44: UK Market Value (US$ Million) and Volume (Units) Historical Data 2018 to 2022 and Forecast 2023 to 2033 By Process Type

Table 45: UK Market Value (US$ Million) and Volume (Units) Historical Data 2018 to 2022 and Forecast 2023 to 2033 By Operation Type

Table 46: UK Market Value (US$ Million) and Volume (Units) Historical Data 2018 to 2022 and Forecast 2023 to 2033 By Maximum Temp

Table 47: UK Market Value (US$ Million) and Volume (Units) Historical Data 2018 to 2022 and Forecast 2023 to 2033 By Application

Table 48: UK Market Volume (Units) Historical Data 2018 to 2022 and Forecast 2023 to 2033 By Application

Table 49: UK Market Value (US$ Million) Historical Data 2018 to 2022 and Forecast 2023 to 2033 By Application

Table 50: UK Market Value (US$ Million) Historical Data 2018 to 2022 and Forecast 2023 to 2033 By Application

Table 51: UK Market Value (US$ Million) and Volume (Units) Historical Data 2018 to 2022 and Forecast 2023 to 2033 By Control System

Table 52: Spain Market Value (US$ Million) and Volume (Units) Historical Data 2018 to 2022 and Forecast 2023 to 2033 By Country

Table 53: Spain Market Value (US$ Million) and Volume (Units) Historical Data 2018 to 2022 and Forecast 2023 to 2033 By Material Type

Table 54: Spain Market Value (US$ Million) and Volume (Units) Historical Data 2018 to 2022 and Forecast 2023 to 2033 By Process Type

Table 55: Spain Market Value (US$ Million) and Volume (Units) Historical Data 2018 to 2022 and Forecast 2023 to 2033 By Operation Type

Table 56: Spain Market Value (US$ Million) and Volume (Units) Historical Data 2018 to 2022 and Forecast 2023 to 2033 By Maximum Temp

Table 57: Spain Market Value (US$ Million) and Volume (Units) Historical Data 2018 to 2022 and Forecast 2023 to 2033 By Application

Table 58: Spain Market Volume (Units) Historical Data 2018 to 2022 and Forecast 2023 to 2033 By Application

Table 59: Spain Market Value (US$ Million) Historical Data 2018 to 2022 and Forecast 2023 to 2033 By Application

Table 60: Spain Market Value (US$ Million) Historical Data 2018 to 2022 and Forecast 2023 to 2033 By Application

Table 61: Spain Market Value (US$ Million) and Volume (Units) Historical Data 2018 to 2022 and Forecast 2023 to 2033 By Control System

Table 62: Netherlands Market Value (US$ Million) and Volume (Units) Historical Data 2018 to 2022 and Forecast 2023 to 2033 By Process Type

Table 63: Netherland Market Value (US$ Million) and Volume (Units) Historical Data 2018 to 2022 and Forecast 2023 to 2033 By Material Type

Table 64: Netherland Market Value (US$ Million) and Volume (Units) Historical Data 2018 to 2022 and Forecast 2023 to 2033 By Process Type

Table 65: Netherland Market Value (US$ Million) and Volume (Units) Historical Data 2018 to 2022 and Forecast 2023 to 2033 By Operation Type

Table 66: Netherland Market Value (US$ Million) and Volume (Units) Historical Data 2018 to 2022 and Forecast 2023 to 2033 By Maximum Temp

Table 67: Netherland Market Volume (Units) Historical Data 2018 to 2022 and Forecast 2023 to 2033 By Application

Table 67: Netherland Market Value (US$ Million) Historical Data 2018 to 2022 and Forecast 2023 to 2033 By Application

Table 68: Netherland Market Volume (Units) Historical Data 2018 to 2022 and Forecast 2023 to 2033 By Application

Table 70: Netherland Market Value (US$ Million) Historical Data 2018 to 2022 and Forecast 2023 to 2033 By Application

Table 71: Netherland Market Value (US$ Million) and Volume (Units) Historical Data 2018 to 2022 and Forecast 2023 to 2033 By Control System

Table 72: Luxembourg Market Value (US$ Million) and Volume (Units) Historical Data 2018 to 2022 and Forecast 2023 to 2033 By Material Type

Table 73: Luxembourg Market Value (US$ Million) and Volume (Units) Historical Data 2018 to 2022 and Forecast 2023 to 2033 By Process Type

Table 74: Luxembourg Market Value (US$ Million) and Volume (Units) Historical Data 2018 to 2022 and Forecast 2023 to 2033 By Operation Type

Table 75: Luxembourg Market Value (US$ Million) and Volume (Units) Historical Data 2018 to 2022 and Forecast 2023 to 2033 By Maximum Temp

Table 76: Luxembourg Market Value (US$ Million) and Volume (Units) Historical Data 2018 to 2022 and Forecast 2023 to 2033 By Application

Table 76: Luxembourg Market Value (US$ Million) and Volume (Units) Historical Data 2018 to 2022 and Forecast 2023 to 2033 By Application

Table 77: Luxembourg Market Volume (Units) Historical Data 2018 to 2022 and Forecast 2023 to 2033 By Application

Table 79: Luxembourg Market Value (US$ Million) Historical Data 2018 to 2022 and Forecast 2023 to 2033 By Application

Table 80: Luxembourg Market Value (US$ Million) and Volume (Units) Historical Data 2018 to 2022 and Forecast 2023 to 2033 By Control System

Table 81: Belgium Market Value (US$ Million) and Volume (Units) Historical Data 2018 to 2022 and Forecast 2023 to 2033 By Country

Table 82: Belgium Market Value (US$ Million) and Volume (Units) Historical Data 2018 to 2022 and Forecast 2023 to 2033 By Material Type

Table 83: Belgium Market Value (US$ Million) and Volume (Units) Historical Data 2018 to 2022 and Forecast 2023 to 2033 By Process Type

Table 84: Belgium Market Value (US$ Million) and Volume (Units) Historical Data 2018 to 2022 and Forecast 2023 to 2033 By Operation Type

Table 85: Belgium Market Value (US$ Million) and Volume (Units) Historical Data 2018 to 2022 and Forecast 2023 to 2033 By Maximum Temp

Table 86: Belgium Market Value (US$ Million) and Volume (Units) Historical Data 2018 to 2022 and Forecast 2023 to 2033 By Application

Table 86: Belgium Market Value (US$ Million) Historical Data 2018 to 2022 and Forecast 2023 to 2033 By Application

Table 87: Belgium Market Volume (Units) Historical Data 2018 to 2022 and Forecast 2023 to 2033 By Application

Table 89: Belgium Market Value (US$ Million) Historical Data 2018 to 2022 and Forecast 2023 to 2033 By Application

Table 90: Belgium Market Value (US$ Million) and Volume (Units) Historical Data 2018 to 2022 and Forecast 2023 to 2033 By Control System

Table 91: Russia Germany Market Value (US$ Million) and Volume (Units) Historical Data 2018 to 2022 and Forecast 2023 to 2033 By Country

Table 92: Russia Market Value (US$ Million) and Volume (Units) Historical Data 2018 to 2022 and Forecast 2023 to 2033 By Material Type

Table 93: Russia Market Value (US$ Million) and Volume (Units) Historical Data 2018 to 2022 and Forecast 2023 to 2033 By Process Type

Table 94: Russia Market Value (US$ Million) and Volume (Units) Historical Data 2018 to 2022 and Forecast 2023 to 2033 By Operation Type

Table 95: Russia Market Value (US$ Million) and Volume (Units) Historical Data 2018 to 2022 and Forecast 2023 to 2033 By Maximum Temp

Table 96: Russia Market Value (US$ Million) and Volume (Units) Historical Data 2018 to 2022 and Forecast 2023 to 2033 By Application

Table 96: Russia Market Value (US$ Million) and Volume (Units) Historical Data 2018 to 2022 and Forecast 2023 to 2033 By Application

Table 97: Russia Market Volume (Units) Historical Data 2018 to 2022 and Forecast 2023 to 2033 By Application

Table 99: Russia Market Value (US$ Million) Historical Data 2018 to 2022 and Forecast 2023 to 2033 By Application

Table 100: Russia Market Value (US$ Million) and Volume (Units) Historical Data 2018 to 2022 and Forecast 2023 to 2033 By Control System

Table 101: Rest of Europe Market Value (US$ Million) and Volume (Units) Historical Data 2018 to 2022 and Forecast 2023 to 2033 By Material Type

Table 102: Rest of Europe Market Value (US$ Million) and Volume (Units) Historical Data 2018 to 2022 and Forecast 2023 to 2033 By Process Type

Table 103: Rest of Europe Market Value (US$ Million) and Volume (Units) Historical Data 2018 to 2022 and Forecast 2023 to 2033 By Operation Type

Table 104: Rest of Europe Market Value (US$ Million) and Volume (Units) Historical Data 2018 to 2022 and Forecast 2023 to 2033 By Maximum Temp

Table 105: Rest of Europe Market Value (US$ Million) and Volume (Units) Historical Data 2018 to 2022 and Forecast 2023 to 2033 By Application

Table 105: Rest of Europe Market Value (US$ Million) Historical Data 2018 to 2022 and Forecast 2023 to 2033 By Application

Table 106: Rest of Europe Market Volume ( Units) Historical Data 2018 to 2022 and Forecast 2023 to 2033 By Applications

Table 108: Rest of Europe Market Value (US$ Million) Historical Data 2018 to 2022 and Forecast 2023 to 2033 By Application

Table 109: Rest of Europe Market Value (US$ Million) and Volume (Units) Historical Data 2018 to 2022 and Forecast 2023 to 2033 By Control System

List of Charts

Figure 01: Europe Market Historical Volume (Units), 2018 to 2022

Figure 02: Europe Market Current and Forecast Volume (Units), 2023 to 2033

Figure 03: Europe Historical Market Size (US$ Million) (2018 to 2022)

Figure 04: Europe Market Absolute $ Opportunity Analysis (2018 to 2033)

Figure 05: Europe Market Size (US$ Million) & YOY Growth (%) (2023 to 2033)

Figure 06: Europe Market Share and BPS Analysis By Maximum Temp,2023 & 2033

Figure 07: Europe Market Y-o-Y Growth Projections By Maximum Temp, 2022 to 2033

Figure 08: Europe Market Attractiveness By Maximum Temp, 2023 to 2033

Figure 09: Global Market Incremental $ Opportunity by Maximum Temp,

Figure 10: Europe Market Share and BPS Analysis by Material Type- 2023 & 2033

Figure 11: Europe Market Y-o-Y Growth Projections by Material Type, 2022 to 2033

Figure 12: Europe Market Attractiveness by Material Type, 2023 to 2033

Figure 13: Global Market Incremental $ Opportunity by Material Type,

Figure 14: Europe Market Share and BPS Analysis by Process Type - 2023 & 2033

Figure 15: Europe Market Y-o-Y Growth Projections by Process Type 2022 to 2033

Figure 16: Europe Market Attractiveness by Process Type, 2023 to 2033

Figure 17: Global Market Incremental $ Opportunity by Process Type,

Figure 18: Europe Market Share and BPS Analysis By Operation Type- 2023 & 2033

Figure 19: Europe Market Y-o-Y Growth Projections By Operation Type, 2022 to 2033

Figure 20: Europe Market Attractiveness By Operation Type, 2023 to 2033

Figure 21: Global Market Incremental $ Opportunity by Technology,

Figure 22: Europe Market Share and BPS Analysis by Application - 2023 & 2033

Figure 23: Europe Market Y-o-Y Growth Projections by Application, 2022 to 2033

Figure 24: Europe Market Attractiveness by Application, 2023 to 2033

Figure 25: Global Market Incremental $ Opportunity by Application,

Figure 26: Europe Market Share and BPS Analysis By Control System,2023 & 2033

Figure 27: Europe Market Y-o-Y Growth Projections By Control System, 2022 to 2033

Figure 28: Europe Market Attractiveness By Control System, 2023 to 2033

Figure 29: Global Market Incremental $ Opportunity by Control System,

Figure 30: Europe Market Share and BPS Analysis by Regions - 2023 & 2033

Figure 31: Europe Market Y-o-Y Growth Projections by Regions, 2022 to 2033

Figure 32: Europe Market Attractiveness by Regions, 2023 to 2033

Figure 33: Global Market Incremental $ Opportunity by Region,

Figure 34: Germany Market Share and BPS Analysis by Country - 2023 & 2033

Figure 35: Germany Market Y-o-Y Growth Projections by Country, 2022 to 2033

Figure 36: Germany Market Attractiveness by Country, 2023 to 2033

Figure 37: Germany Market Share and BPS Analysis by Material Type- 2023 & 2033

Figure 38: Germany Market Y-o-Y Growth Projections Material Type, 2022 to 2033

Figure 39: Germany Market Attractiveness by Material Type, 2023 to 2033

Figure 40: Germany Market Share and BPS Analysis by Process Type - 2023 & 2033

Figure 41: Germany Market Y-o-Y Growth Projections by Process Type 2022 to 2033

Figure 42: Germany Market Attractiveness by Process Type, 2023 to 2033

Figure 43: Germany Market Share and BPS Analysis By Operation Type- 2023 & 2033

Figure 44: Germany Market Y-o-Y Growth Projections By Operation Type, 2022 to 2033

Figure 45: Germany Market Attractiveness By Operation Type, 2023 to 2033

Figure 46: Germany Market Share and BPS Analysis By Maximum Temp,2023 & 2033

Figure 47: Germany Market Y-o-Y Growth Projections By Maximum Temp, 2022 to 2033

Figure 48: Germany Market Attractiveness By Maximum Temp, 2023 to 2033

Figure 49: Germany Market Share and BPS Analysis by Application - 2023 & 2033

Figure 50: Germany Market Y-o-Y Growth Projections by Application, 2022 to 2033

Figure 51: Germany Market Attractiveness by Application, 2023 to 2033

Figure 52: Germany Market Share and BPS Analysis By Control System,2023 & 2033

Figure 53: Germany Market Y-o-Y Growth Projections By Control System, 2022 to 2033

Figure 54: Germany Market Attractiveness By Control System, 2023 to 2033

Figure 55: Italy Market Share and BPS Analysis by Country - 2023 & 2033

Figure 56: Italy Market Y-o-Y Growth Projections by Country, 2022 to 2033

Figure 57: Italy Market Attractiveness by Country, 2023 to 2033

Figure 58: Italy Market Share and BPS Analysis by Material Type- 2023 & 2033

Figure 59: Italy Market Y-o-Y Growth Projections by Material Type, 2022 to 2033

Figure 60: Italy Market Attractiveness by Material Type, 2023 to 2033

Figure 61: Italy Market Share and BPS Analysis by Process Type - 2023 & 2033

Figure 62: Italy Market Y-o-Y Growth Projections by Process Type 2022 to 2033

Figure 63: Italy Market Attractiveness by Process Type, 2023 to 2033

Figure 64: Italy Market Share and BPS Analysis By Operation Type- 2023 & 2033

Figure 65: Italy Market Y-o-Y Growth Projections By Operation Type, 2022 to 2033

Figure 66: Italy Market Attractiveness By Operation Type, 2023 to 2033

Figure 67: Italy Market Share and BPS Analysis By Maximum Temp,2023 & 2033

Figure 68: Italy Market Y-o-Y Growth Projections By Maximum Temp, 2022 to 2033

Figure 69: Italy Market Attractiveness By Maximum Temp, 2023 to 2033

Figure 70: Italy Market Share and BPS Analysis by Application - 2023 & 2033

Figure 71: Italy Market Y-o-Y Growth Projections by Application, 2022 to 2033

Figure 72: Italy Market Attractiveness by Application, 2023 to 2033

Figure 73: Italy Market Share and BPS Analysis By Control System,2023 & 2033

Figure 74: Italy Market Y-o-Y Growth Projections By Control System, 2022 to 2033

Figure 75: Italy Market Attractiveness By Control System, 2023 to 2033

Figure 76: France Market Share and BPS Analysis by Country - 2023 & 2033

Figure 77: France Market Y-o-Y Growth Projections by Country, 2022 to 2033

Figure 78: France Market Attractiveness by Country, 2023 to 2033

Figure 79: France Market Share and BPS Analysis by Material Type - 2023 & 2033

Figure 80: France Market Y-o-Y Growth Projections by Material Type, 2022 to 2033

Figure 81: France Market Attractiveness by Material Type, 2023 to 2033

Figure 82: France Market Share and BPS Analysis by Process Type - 2023 & 2033

Figure 83: France Market Y-o-Y Growth Projections by Process Type 2022 to 2033

Figure 84: France Market Attractiveness by Process Type, 2023 to 2033

Figure 85: France Market Share and BPS Analysis By Operation Type- 2023 & 2033

Figure 86: France Market Y-o-Y Growth Projections By Operation Type, 2022 to 2033

Figure 87: France Market Attractiveness By Operation Type, 2023 to 2033

Figure 88: France Market Share and BPS Analysis By Maximum Temp,2023 & 2033

Figure 89: France Market Y-o-Y Growth Projections By Maximum Temp, 2022 to 2033

Figure 90: France Market Attractiveness By Maximum Temp, 2023 to 2033

Figure 91: France Market Share and BPS Analysis by Application - 2023 & 2033

Figure 92: France Market Y-o-Y Growth Projections by Application, 2022 to 2033

Figure 93: France Market Attractiveness by Application, 2023 to 2033

Figure 94: France Market Share and BPS Analysis By Control System,2023 & 2033

Figure 95: France Market Y-o-Y Growth Projections By Control System, 2022 to 2033

Figure 96: France Market Attractiveness By Control System, 2023 to 2033

Figure 97: UK Market Share and BPS Analysis by Country - 2023 & 2033

Figure 98: UK Market Y-o-Y Growth Projections by Country, 2022 to 2033

Figure 99: UK Market Attractiveness by Country, 2023 to 2033

Figure 100: UK Market Share and BPS Analysis by Material Type - 2023 & 2033

Figure 101: UK Market Y-o-Y Growth Projections by Material Type, 2022 to 2033

Figure 102: UK Market Attractiveness by Material Type, 2023 to 2033

Figure 103: UK Market Share and BPS Analysis by Process Type - 2023 & 2033

Figure 104: UK Market Y-o-Y Growth Projections by Process Type 2022 to 2033

Figure 105: UK Market Attractiveness by Process Type, 2023 to 2033

Figure 106: UK Market Share and BPS Analysis By Operation Type- 2023 & 2033

Figure 107: UK Market Y-o-Y Growth Projections By Operation Type, 2022 to 2033

Figure 108: UK Market Attractiveness By Operation Type, 2023 to 2033

Figure 109: UK Market Share and BPS Analysis By Maximum Temp,2023 & 2033

Figure 110: UK Market Y-o-Y Growth Projections By Maximum Temp, 2022 to 2033

Figure 111: UK Market Attractiveness By Maximum Temp, 2023 to 2033

Figure 112: UK Market Share and BPS Analysis by Application - 2023 & 2033

Figure 113: UK Market Y-o-Y Growth Projections by Application, 2022 to 2033

Figure 114: UK Market Attractiveness by Application, 2023 to 2033

Figure 115: UK Market Share and BPS Analysis By Control System,2023 & 2033

Figure 116: UK Market Y-o-Y Growth Projections By Control System, 2022 to 2033

Figure 117: UK Market Attractiveness By Control System, 2023 to 2033

Figure 118: Spain Market Share and BPS Analysis by Country, 2023 & 2033

Figure 119: Spain Market Y-o-Y Growth Projections by Country, 2022 to 2033

Figure 120: Spain Market Attractiveness by Country, 2023 to 2033

Figure 121: Spain Market Share and BPS Analysis by Material Type - 2023 & 2033

Figure 122: Spain Market Y-o-Y Growth Projections by Material Type, 2022 to 2033

Figure 123: Spain Market Attractiveness by Material Type, 2023 to 2033

Figure 124: Spain Market Share and BPS Analysis by Process Type - 2023 & 2033

Figure 125: Spain Market Y-o-Y Growth Projections by Process Type 2022 to 2033

Figure 126: Spain Market Attractiveness by Process Type, 2023 to 2033

Figure 127: Spain Market Share and BPS Analysis By Operation Type- 2023 & 2033

Figure 128: Spain Market Y-o-Y Growth Projections By Operation Type, 2022 to 2033

Figure 129: Spain Market Attractiveness By Operation Type, 2023 to 2033

Figure 130: Spain Market Share and BPS Analysis By Maximum Temp,2023 & 2033

Figure 131: Spain Market Y-o-Y Growth Projections By Maximum Temp, 2022 to 2033

Figure 132: Spain Market Attractiveness By Maximum Temp, 2023 to 2033

Figure 133: Spain Market Share and BPS Analysis by Application - 2023 & 2033

Figure 134: Spain Market Y-o-Y Growth Projections by Application, 2022 to 2033

Figure 135: Spain Market Attractiveness by Application, 2023 to 2033

Figure 136: Spain Market Share and BPS Analysis By Control System,2023 & 2033

Figure 137: Spain Market Y-o-Y Growth Projections By Control System, 2022 to 2033

Figure 138: Spain Market Attractiveness By Control System, 2023 to 2033

Figure 139: Netherlands Market Share and BPS Analysis by Country- 2023 & 2033

Figure 140: Netherlands Market Y-o-Y Growth Projections by Country 2022 to 2033

Figure 141: Netherlands Market Attractiveness by Country, 2023 to 2033

Figure 142: Netherland Market Share and BPS Analysis by Material Type - 2023 & 2033

Figure 143: Netherland Market Y-o-Y Growth Projections by Material Type, 2022 to 2033

Figure 144: Netherland Market Attractiveness by Material Type, 2023 to 2033

Figure 145: Netherland Market Share and BPS Analysis by Process Type - 2023 & 2033

Figure 146: Netherland Market Y-o-Y Growth Projections by Process Type 2022 to 2033

Figure 147: Netherland Market Attractiveness by Process Type, 2023 to 2033

Figure 148: Netherland Market Share and BPS Analysis By Operation Type- 2023 & 2033

Figure 149: Netherland Market Y-o-Y Growth Projections By Operation Type, 2022 to 2033

Figure 150: Netherland Market Attractiveness By Operation Type, 2023 to 2033

Figure 151: Netherland Market Share and BPS Analysis By Maximum Temp,2023 & 2033

Figure 152: Netherland Market Y-o-Y Growth Projections By Maximum Temp, 2022 to 2033

Figure 153: Netherland Market Attractiveness By Maximum Temp, 2023 to 2033

Figure 154: Netherland Market Share and BPS Analysis by Application - 2023 & 2033

Figure 155: Netherland Market Y-o-Y Growth Projections by Application, 2022 to 2033

Figure 156: Netherland Market Attractiveness by Application, 2023 to 2033

Figure 157: Netherland Market Share and BPS Analysis By Control System,2023 & 2033

Figure 158: Netherland Market Y-o-Y Growth Projections By Control System, 2022 to 2033

Figure 159: Netherland Market Attractiveness By Control System, 2023 to 2033

Figure 160: Luxembourg Market Share and BPS Analysis by Material Type - 2023 & 2033

Figure 161: Luxembourg Market Y-o-Y Growth Projections by Material Type, 2022 to 2033

Figure 162: Luxembourg Market Attractiveness by Material Type, 2023 to 2033

Figure 163: Luxembourg Market Share and BPS Analysis by Process Type - 2023 & 2033

Figure 164: Luxembourg Market Y-o-Y Growth Projections by Process Type 2022 to 2033

Figure 165: Luxembourg Market Attractiveness by Process Type, 2023 to 2033

Figure 166: Luxembourg Market Share and BPS Analysis By Operation Type- 2023 & 2033

Figure 167: Luxembourg Market Y-o-Y Growth Projections By Operation Type, 2022 to 2033

Figure 168: Luxembourg Market Attractiveness By Operation Type, 2023 to 2033

Figure 169: Luxembourg Market Share and BPS Analysis By Maximum Temp,2023 & 2033

Figure 170: Luxembourg Market Y-o-Y Growth Projections By Maximum Temp, 2022 to 2033

Figure 171: Luxembourg Market Attractiveness By Maximum Temp, 2023 to 2033

Figure 172: Luxembourg Market Share and BPS Analysis by Application - 2023 & 2033

Figure 173: Luxembourg Market Y-o-Y Growth Projections by Application, 2022 to 2033

Figure 174: Luxembourg Market Attractiveness by Application, 2023 to 2033

Figure 175: Luxembourg Market Share and BPS Analysis By Control System,2023 & 2033

Figure 176: Luxembourg Market Y-o-Y Growth Projections By Control System, 2022 to 2033

Figure 177: Luxembourg Market Attractiveness By Control System, 2023 to 2033

Figure 178: Belgium Market Share and BPS Analysis By Country- 2023 & 2033

Figure 179: Belgium Market Y-o-Y Growth Projections By Country, 2022 to 2033

Figure 180: Belgium Market Attractiveness By Country, 2023 to 2033

Figure 181: Belgium Market Share and BPS Analysis by Material Type - 2023 & 2033

Figure 182: Belgium Market Y-o-Y Growth Projections by Material Type, 2022 to 2033

Figure 183: Belgium Market Attractiveness by Material Type, 2023 to 2033

Figure 184: Belgium Market Share and BPS Analysis by Process Type - 2023 & 2033

Figure 185: Belgium Market Y-o-Y Growth Projections by Process Type 2022 to 2033

Figure 186: Belgium Market Attractiveness by Process Type, 2023 to 2033

Figure 187: Belgium Market Share and BPS Analysis By Operation Type- 2023 & 2033

Figure 188: Belgium Market Y-o-Y Growth Projections By Operation Type, 2022 to 2033

Figure 189: Belgium Market Attractiveness By Operation Type, 2023 to 2033

Figure 190: Belgium Market Share and BPS Analysis By Maximum Temp,2023 & 2033

Figure 191: Belgium Market Y-o-Y Growth Projections By Maximum Temp, 2022 to 2033

Figure 192: Belgium Market Attractiveness By Maximum Temp, 2023 to 2033

Figure 193: Belgium Market Share and BPS Analysis by Application - 2023 & 2033

Figure 194: Belgium Market Y-o-Y Growth Projections by Application, 2022 to 2033

Figure 195: Belgium Market Attractiveness by Application, 2023 to 2033

Figure 196: Belgium Market Share and BPS Analysis By Control System,2023 & 2033

Figure 197: Belgium Market Y-o-Y Growth Projections By Control System, 2022 to 2033

Figure 198: Belgium Market Attractiveness By Control System, 2023 to 2033

Figure 199: Russia Market Share and BPS Analysis by Country- 2023 & 2033

Figure 200: Russia Market Y-o-Y Growth Projections by Country, 2022 to 2033

Figure 201: Russia Market Attractiveness by Country, 2023 to 2033

Figure 202: Russia Market Share and BPS Analysis by Material Type- 2023 & 2033

Figure 203: Russia Market Y-o-Y Growth Projections by Material Type, 2022 to 2033

Figure 204: Russia Market Attractiveness by Material Type, 2023 to 2033

Figure 205: Russia Market Share and BPS Analysis by Process Type - 2023 & 2033

Figure 206: Russia Market Y-o-Y Growth Projections by Process Type 2022 to 2033

Figure 207: Russia Market Attractiveness by Process Type, 2023 to 2033

Figure 208: Russia Market Share and BPS Analysis By Operation Type- 2023 & 2033

Figure 209: Russia Market Y-o-Y Growth Projections By Operation Type, 2022 to 2033

Figure 210: Russia Market Attractiveness By Operation Type, 2023 to 2033

Figure 211: Russia Market Share and BPS Analysis By Maximum Temp,2023 & 2033

Figure 212: Russia Market Y-o-Y Growth Projections By Maximum Temp, 2022 to 2033

Figure 213: Russia Market Attractiveness By Maximum Temp, 2023 to 2033

Figure 214: Russia Market Share and BPS Analysis by Application - 2023 & 2033

Figure 215: Russia Market Y-o-Y Growth Projections by Application, 2022 to 2033

Figure 216: Russia Market Attractiveness by Application, 2023 to 2033

Figure 217: Russia Market Share and BPS Analysis By Control System,2023 & 2033

Figure 218: Russia Market Y-o-Y Growth Projections By Control System, 2022 to 2033

Figure 219: Russia Market Attractiveness By Control System, 2023 to 2033

Figure 220: Rest of Europe Market Share and BPS Analysis by Material Type - 2023 & 2033

Figure 221: Rest of Europe Market Y-o-Y Growth Projections by Material Type, 2022 to 2033

Figure 222: Rest of Europe Market Attractiveness by Material Type, 2023 to 2033

Figure 223: Rest of Europe Market Y-o-Y Growth Projections by Application, 2022 to 2033

Figure 224: Rest of Europe Market Y-o-Y Growth Projections by Process Type 2022 to 2033

Figure 225: Rest of Europe Market Attractiveness by Process Type, 2023 to 2033

Figure 226: Rest of Europe Market Y-o-Y Growth Projections By Control System, 2022 to 2033

Figure 227: Rest of Europe Market Attractiveness By Control System, 2023 to 2033

Figure 228: Rest of Europe Market Attractiveness By Operation Type, 2023 to 2033

Figure 229: Rest of Europe Market Share and BPS Analysis By Maximum Temp,2023 & 2033

Figure 230: Rest of Europe Market Y-o-Y Growth Projections By Maximum Temp, 2022 to 2033

Figure 231: Rest of Europe Market Attractiveness By Maximum Temp, 2023 to 2033

Figure 232: Rest of Europe Market Share and BPS Analysis by Application - 2023 & 2033

Recommendations

Technology

Industrial Radiography Market

Published : August 2023

Industrial Automation

High-Temperature Industrial Burner Market

Published : July 2023

Industrial Automation

Industrial Air Filtration Market

Published : May 2023

Industrial Automation

Portable Loading Ramps Market

Published : September 2022

Explore Industrial Automation Insights

View Reports

Industrial Furnace Industry Analysis in Europe