Electric Motor Market
Market Insights on Electric Motor covering sales outlook, demand forecast & up-to-date key trends
Electric Motor Market By Consumables (AC Motor, DC Motor), Application (Pumps, Fans, Drives, Compressor, General Machinery, Centrifugal Machinery, Grinders) & Region - Forecast 2021-2031
Electric Motor Market Snapshot
[300 Pages Report] The Electric Motor Market to exhibit year-on-year (YoY) growth of 4.2% in 2021 to total 1.2 billion units. As per the report, demand in the DC motors segment will grow by 2.2% to 339 million units in 2021, while the AC Motors segment was up 5.1% to 837 million units.
Let us know your requirement to get
100% FREE customization
Electric Motor Market Key Points Covered
- electric motor market estimates and forecast 2015-2031
- Key drivers and restraints impacting market growth
- Segment-wise, Country-wise, and Region-wise Analysis
- Competition Mapping and Benchmarking
- Brand share and electric motor market Share Analysis
- Key Product Innovations and Regulatory Climate
- COVID-19 Impact on XYZ and How to Navigate
- Recommendation on Key Winning Strategies
Electric Motor Market Outlook 2016-2020 Compared to 2021-2031 Forecast
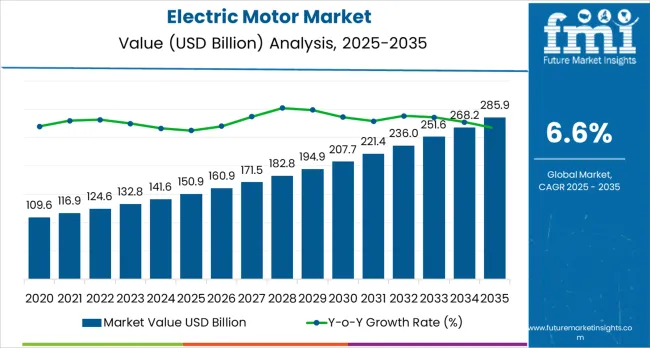
Driven by increasing focus on research and development and investment in Industrial sector, the electric motor market will rise at 5.6% CAGR between 2021 and 2031 in comparison above 3.8% CAGR registered during 2016-2020.
With the penetration of robotics and automation in the last decade, across a plethora of industry verticals encompassing electronics manufacturing, food & beverage industries and automotive. Furthermore, investments in smart factory automation, particularly is massive production plants, have been growing constantly. With the increasing adoption for automation and robotics technology, electric motor demand will be boosted in regards to its use in drive units. The growth rate of the electric motor market growth is thus expected to be in proportion to that of industrial automation and robotics.
Demand of electric motor is also set to be buoyed from residential appliances segment wherein low power capacity motor are primarily used. The Electric motor market has been perceived as a high volume-high value market.
As per Energy Association estimates, 40% of total energy used in industries is consumed to drive electric motor. In lieu of the same, emphasis on promoting the use of high efficiency motor.
Developed as well as developing countries are expected to usher in sound growth opportunities of the product via new units as well as replacement sales. Expansion of usage scope towards untapped end use verticals is expected to be augur the growth of electric motor on long term basis.
In the coming years, the demand for electric motor will witness healthy growth with Industrial Robotics, Energy, Residential Appliances and Municipal Water Utilities being the key growth enablers.
How will the Expansion of Municipal Water Treatment Market Benefit Electric Motor Sales?
The robust rate of investments in civic infrastructure involving municipal water supply and wastewater treatment process will call for a hefty rate of pumps thus involving a proportionate rate of electric motor to be sold and installed. With the electric motor market growth in intermediate stages and clocking nearly double digit growth rates in next 5 years, the new unit sales of electric motor will be highly sought.
Another supporting factor for growth promotion is that electric motor and associated pumps for heavy duty water supply process are priced at premium which will prove as a value proposition for the OEMs when coupled with installation and aftersales services.
Find your sweet spots for generating winning opportunities in this market.
Talk to AnalystWhat Is the Impact Of COVID-19 Crisis On Electric Motor Market?
Lockdown imposed across various countries has negatively impacted the manufacturing sector in terms of production output and supply procedures coupled with slowdown of demand and order intake from customers. However, with subsequent financial quarters of the initial pandemic outbreak, the resumption of industrial manufacturing activities are being permitted by the regional authorities. The electric motor market growth is also expected to gain rebound in growth within 3-4 quarters of upcoming fiscal.
Nonetheless, several distributers and manufacturers stockpiled the equipment to ensure sufficient supplies during the pandemic. Additionally, increase in the new product developments post COVID-19 has increased the usage for robotics and digitally operated machineries which is driving the demand for the electric motor.
Despite the difficult situation, economies are steadily recovering from the effect. Company activities have begun to grow at a slow and steady pace as supply and distribution networks recover. Considering this, the pandemic is unlikely to have a long-term effect on the Electric Motor Market.
Electric Motor Market Country-wise Insights
How big is the Opportunity for Electric Motor Market in the U.S.?
North America is predicted to remain one of the most attractive markets during the forecast period, according to Future Market Insights. According to the study, the U.S. is expected to be the largest market in North America and reach US$ 40.4 Bn by 2031.
The United States' highly developed end-use sectors are supporting the electric motor market growth. Overall industrial spending grew at a rate of about 4.6 percent in 2019 than overall economic growth of 4.0 percent in the United States calculated by Gross Domestic Product (GDP), according to CMS' Office of the Actuary estimates.
Furthermore, the U.S. is home to technically advanced industrial sector in the world, making it a lucrative market for electric motor manufacturers, as it exhibits high demand for robotics and automation for industrial as well as residential applications.
Why is Demand for Electric Motor Increasing in China?
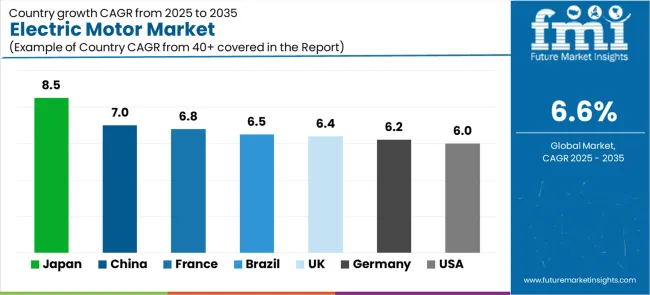
Demand in the China market is expected to rise at nearly 5.5% CAGR over the forecast period. The China’s Industrial sector is backed by a well-developed infrastructure and it is largely supported by the government. It is not surprising that the China has the most elevated level of expenditure across globe.
As per the report, China is recognized as a primary market and it is expected to continue exhibiting high demand for electric motor through the forecast period. Moreover, rising research activities, presence of several major players, and growing electric vehicle and Industrial sector are creating attractive opportunities for electric motor market in the country.
Why is Innovation Key to Succeed in the Germany Electric Motor Market?
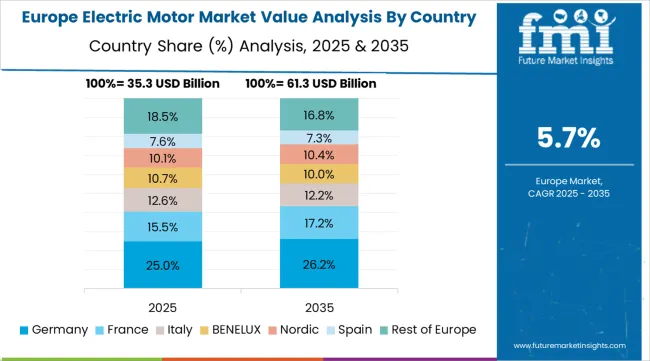
Germany is one of the world’s top most manufacturers of pharmaceuticals. Considering this, the demand for electric motor is expected to remain high in the country. By 2031, it is expected to account for over 25% of electric motor sales within Europe.
Manufacturers in the country have a competitive advantage as they have access to cutting edge research to address the unmet challenges. Additionally, they are constantly investing in order to expand their operations, which is resulting in a more promising pipeline.
How are Government Initiatives Boosting Electric Motor Sales in India?
In 2021, India will account for over 27% sales in South Asia & Pacific. Government initiatives undertaken to give to impetus to industrial and automotive sectors are anticipated to complement industrial development in India, in turn supporting the expansion of the electric motor market.
Favorable policies implemented by the government of India to support production and sales of electric vehicles will fuel the demand for electric motor apart from this demand for pumps, drives, and general machinery.

A unified Market Research Subscription Platform, built for today's disparate research needs.
Electric Motor Market Category-wise Insights
Why the Demand for <1HP in Electric Motor Continuously Rising?
Based on power output, <1HP is the leading category and it is expected to account for for nearly 22% of the value share of the electric motor market in 2021. Reason behind demand is that this power output range witnesses maximum applications in various end-use industries. Moreover, these motor are cost-effective.
<1HP electric motor are expected to remain top choice for many end users, since they significantly reduce storage space and are considered to be suitable for diverse applications.
Who is the Leading End User of Electric Motor?
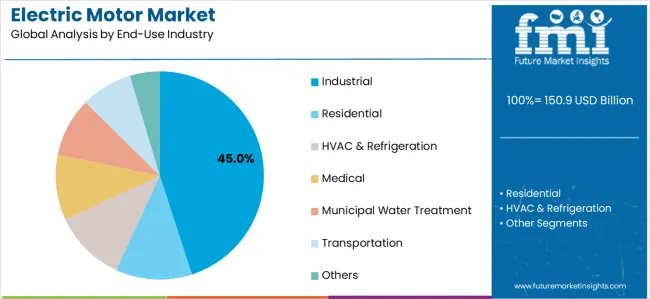
The industrial sector is expected to hold the highest market share in electric motor market and is expected to reach at the market value of US$ 72.3 Bn by 2031.
The primary reason behind sales in industrial sector is the rapid growing demand for automation across industries. Demand for the time saving and environment friendly equipment has been increasing since the past few years which is increasing sales opportunities. Also, the market is expected to gain from advent of the Industry 4.0 is major.
Which Type of Electric Motor are Top-selling?
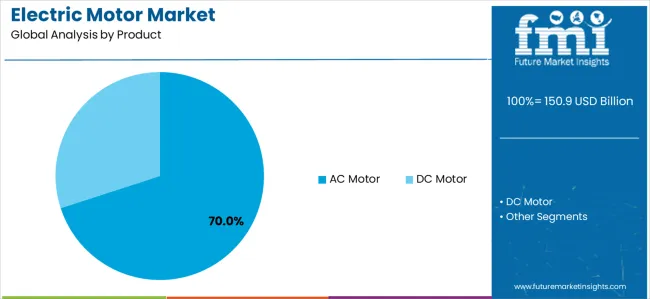
The AC electric motor segment is estimated to hold for the largest share of more than 70% in 2021 owing to its advantages over DC motors as it requires less maintenance and has longer life cycle than DC motor. Also AC motors are typically thought to be more powerful than DC motors because they can create more torque with a higher current which is increasing its demand for various applications.
Why is Robotics Segment Exhibiting High Growth?
The robotics segment is expected to exhibit 5.9% CAGR in the global electric motor market through the assessment period. The increasing expenditure on technical developments and robotics imports for industrial production will aid the overall expansion of the segment.
Advancement in industrial production approaches in different nations like the U.S. and China has brought about improved cost-effectiveness for different production techniques. This has prompted more individuals receiving strategies for their production specific technologies. This thusly has prompted rise in demand for robotics.
Electric Motor Market Competitive Landscape
Companies operating in Electric Motor Market are aiming at strategic collaborations and partnerships with other manufacturers to expand their product manufacturing capacity and address the demand of an expanding consumer pool.
- For instance, In, On January 24, 2019 Bosch assumed full control of of EM-motive, one of Europe’s most successful manufacturers of electric motors.
- On August 3rd, 2021, Nidec Corporation acquired stocks of Mitsubishi Heavy Industries Machine Tool Co., Ltd. and announced an outline for its new subsidiaries.
Manufacturers are also focusing on the expansion of their product portfolio to maintain high customer base across the globe
- For instance, On 5 Feb, 2021 Johnson Electric Launches Low Voltage DC Motor Solutions for Smart Furniture. The LVDC motor solutions are designed for actuators used in smart recliners, height adjustable desks, hospital beds and other smart furniture products.
- On February 16th, 2021 Regal announced a collaboration with Rexnord's PMC segment to create world-class power transmission technology.
Scope of Report
Attribute |
Details |
Forecast Period |
2021-2031 |
Historical Data Available for |
2016-2020 |
Market Analysis |
USD Billion for Value |
Key Regions Covered |
North America, Latin America, Europe, East Asia, South Asia & Pacific, and the Middle East & Africa |
Key Countries Covered |
US, Canada, Germany, U.K., France, Italy, Spain, BENELUX, Russia, China, Japan, South Korea, India, ASEAN, Australia, New Zealand, GCC Countries, Turkey, South Africa and North Africa |
Key Segments Covered |
By Power Output, By Product Type, By Application, End Use and Region |
Key Companies Profiled |
|
Report Coverage |
Market Forecast, Company Share Analysis, Competition Intelligence, DROT Analysis, Market Dynamics and Challenges, and Strategic Growth Initiatives |
Customization & Pricing |
Available upon Request |
Electric Motor Market by Category
Power Output:
- <1HP
- 1-5HP
- 5 – 10 HP
- 10 -20 HP
- 20 – 50 HP
- 50 - 100HP
- 100 – 300 HP
- 300 - 500HP
- Above 500HP
Product Type:
- AC Motor
- Induction Motor
- Synchronous Motor
- DC Motor
- Brushed DC
- Brushless DC
By Application:
- Pumps
- Fans
- Drives
- Compressor
- General Machinery
- Centrifugal Machinery
- Grinders
- Extruders
- Robotics
- Others
By End Use:
- Industrial
- Oil & Gas
- Power Generation
- Mining
- Food & Beverages
- Pulp & Paper
- Chemicals
- Air Separation Plant
- Other Manufacturing
- Residential
- HVAC & Refrigeration
- Medical
- Municipal Water Treatment
- Transportation
- Automotive
- Aviation
- Electric vehicles
- Railways
- Boats
- Others
By Region:
- North America
- Latin America
- Europe
- East Asia
- South Asia & Pacific
- Middle East and Africa (MEA)
Frequently Asked Questions
North America currently holds dominance, accounting for over more than 1/4th of the electric motor market in 2021. Expansion of electronics sector in the region is creating growth opportunities for the years ahead. The U.S. currently leads the global market, with revenue expected to reach US$ 40.4 Bn by 2031.
AC Electric Motors will remain top-selling product in the market, accounting for over 70% of revenue generated in the global market by 2031.
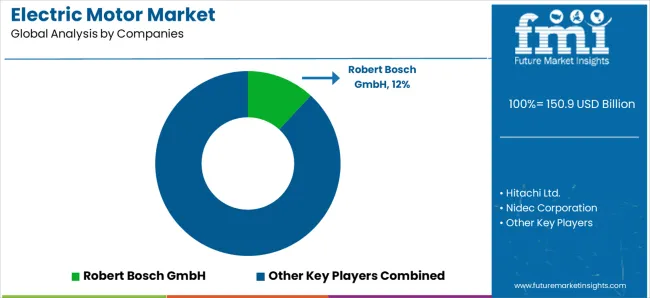
Some of the leading companies in this landscape are General Electric, Robert Bosch GmbH, Hitachi, Ltd., Nidec Corporation, WEG S.A., Siemens AG, ABB Group, Regal Beloit Corporation, Toshiba Corporation, Johnson Electric, Hyosung Corporation, Schneider Electric SE, Bonfiglioli Riduttori S.p.A., Kirloskar Electric Company Ltd., Allied Motion Technologies Inc., East West Manufacturing, LLC, Hyundai Electric Co. Ltd. and others. As per FMI, over 20% of the market share is currently covered by the to
The industrial sector is expected to dominate the market over the forecast period, generating revenue of US$ 72.3 Bn by 2031 due to rising focus on automation and digitalization.
The demand for the market is expected to increase at 5.4% CAGR in North America between 2021 and 2031.
The demand for electric motors is expected to increase by 5.2% in Europe through 2031.
Germany, China, U.S., and Japan are the key producers of electric motors.
The electric motors demand grew by 3.5% CAGR between 2016 and 2020.
South Korea and Japan are expected to account for 5% of the global Electric Motor Market in 2021.
Table of Content
1. Executive Summary
1.1. Global Market Outlook
1.2. Demand Side Trends
1.3. Supply Side Trends
1.4. Analysis and Recommendations
2. Market Overview
2.1. Market Coverage / Taxonomy
2.2. Market Definition / Scope / Limitations
3. Key Market Trends
3.1. Key Trends Impacting the Market
3.2. Product Innovation / Development Trends
4. Key Success Factors
4.1. Product Adoption / Usage Analysis
4.2. Product USPs / Features
5. Global Demand Analysis 2016-2020 and Forecast, 2021-2031
5.1. Historical Market Volume (Mn Units) Analysis, 2016-2020
5.2. Current and Future Market Volume (Mn Units) Projections, 2021-2031
5.3. Y-o-Y Growth Trend Analysis
6. Global - Pricing Analysis
6.1. Pricing Break-up Analysis By Power Output
7. Global Demand (in Value or Size in US$ Mn) Analysis 2016-2020 and Forecast, 2021-2031
7.1. Historical Market Value (US$ Mn) Analysis, 2016-2020
7.2. Current and Future Market Value (US$ Mn) Projections, 2021-2031
7.2.1. Y-o-Y Growth Trend Analysis
7.2.2. Absolute $ Opportunity Analysis
8. Market Background
8.1. Macro-Economic Factors
8.1.1. Global GDP Growth Outlook
8.1.2. Industry Value Added By Key Countries
8.1.3. Manufacturing Value Added by Key Countries
8.1.4. Oil & Gas Industry Outlook
8.1.5. Oil Production Overview by Key Countries
8.1.6. Regional Municipal Water & Wastewater Capital Expenditure
8.1.7. Global Healthcare Industry Overview
8.1.8. Global Automotive Production by Region
8.1.9. GDP and Healthcare Expenditure
8.1.10. Global Motor Vehicle Production Overview
8.1.11. Electric & Plug-in-Hybrid Vehicles Sales Overview
8.1.12. Import Statistics 2016-2020
8.1.13. Export Statistics 2016-2020
8.1.14. Robotics: Market Overview
8.2. Forecast Factors - Relevance & Impact
8.2.1. Global Urbanization Growth Outlook
8.2.2. Top Companies Historical Growth
8.2.3. Regulatory Impact Outlook
8.2.4. Other Key Forecast Factors
8.3. Value Chain
8.4. Global Market Trade Analysis (Imports and Exports)
8.5. COVID-19 Impact
8.5.1. Current Statistics
8.5.2. Potential of Impact
8.5.3. Recovery Scenarios
8.6. Market Dynamics
8.6.1. Drivers
8.6.2. Restraints
8.6.3. Opportunity Analysis
9. Global Analysis 2016-2020 and Forecast 2021-2031, by Power Output
9.1. Introduction / Key Findings
9.2. Historical Market Size (US$ Mn) and Volume Analysis By Power Output, 2016-2020
9.3. Current and Future Market Size (US$ Mn) and Volume Analysis and Forecast By Power Output, 2021-2031
9.3.1. <1HP
9.3.2. 1-5HP
9.3.3. 5 – 10 HP
9.3.4. 10 -20 HP
9.3.5. 20 – 50 HP
9.3.6. 50 - 100HP
9.3.7. 100 – 300 HP
9.3.8. 300 - 500HP
9.3.9. Above 500HP
Market Attractiveness Analysis By Power Output
10. Global Analysis 2016-2020 and Forecast 2021-2031, by Product Type
10.1. Introduction / Key Findings
10.2. Historical Market Size (US$ Mn) and Volume Analysis By Product Type, 2016-2020
10.3. Current and Future Market Size (US$ Mn) and Volume Analysis and Forecast By Product Type, 2021-2031
10.3.1. AC Motor
10.3.1.1. Induction Motor
10.3.1.2. Synchronous Motor
10.3.2. DC Motor
10.3.2.1. Brushed DC
10.3.2.2. Brushless DC
10.4. Market Attractiveness Analysis By Product Type
11. Global Analysis 2016-2020 and Forecast 2021-2031, by Application
11.1. Introduction / Key Findings
11.2. Historical Market Size (US$ Mn) and Volume Analysis By Application, 2016-2020
11.3. Current and Future Market Size (US$ Mn) and Volume Analysis and Forecast By Application, 2021-2031
11.3.1. Pumps
11.3.2. Fans
11.3.3. Drives
11.3.4. Compressor
11.3.5. General Machinery
11.3.6. Centrifugal Machinery
11.3.7. Grinders
11.3.8. Extruders
11.3.9. Robotics
11.3.10. Others
11.4. Market Attractiveness Analysis By Application
12. Global Analysis 2016-2020 and Forecast 2021-2031, by End-use Industry
12.1. Introduction / Key Findings
12.2. Historical Market Size (US$ Mn) and Volume Analysis By End-use Industry, 2016-2020
12.3. Current and Future Market Size (US$ Mn) and Volume Analysis and Forecast By End-use Industry, 2021-2031
12.3.1. Industrial
12.3.1.1. Oil & Gas
12.3.1.2. Power Generation
12.3.1.3. Mining
12.3.1.4. Food & Beverages
12.3.1.5. Pulp & Paper
12.3.1.6. Chemicals
12.3.1.7. Air Separation Plant
12.3.1.8. Other Manufacturing
12.3.2. Residential
12.3.3. HVAC & Refrigeration
12.3.4. Medical
12.3.5. Municipal Water Treatment
12.3.6. Transportation
12.3.6.1. Automotive
12.3.6.2. Aviation
12.3.6.3. Electric vehicles
12.3.6.4. Railways
12.3.6.5. Boats
12.3.7. Others
12.4. Market Attractiveness Analysis By End-use Industry
13. Global Analysis 2016-2020 and Forecast 2021-2031, by Region
13.1. Introduction
13.2. Historical Market Size (US$ Mn) and Volume Analysis By Region, 2016-2020
13.3. Current Market Size (US$ Mn) and Volume Analysis and Forecast By Region, 2021-2031
13.3.1. North America
13.3.2. Latin America
13.3.3. Europe
13.3.4. South Asia & Pacific
13.3.5. East Asia
13.3.6. Middle East and Africa (MEA)
13.4. Market Attractiveness Analysis By Region
14. North America Analysis 2016-2020 and Forecast 2021-2031
14.1. Introduction
14.2. Pricing Analysis
14.3. Historical Market Size (US$ Mn) and Volume Trend Analysis By Market Taxonomy, 2016-2020
14.4. Market Size (US$ Mn) and Volume Forecast By Market Taxonomy, 2021-2031
14.4.1. By Country
14.4.1.1. U.S.
14.4.1.2. Canada
14.4.2. By Power Output
14.4.3. By Product Type
14.4.4. By Application
14.4.5. By End-use Industry
14.5. Market Attractiveness Analysis
14.5.1. By Country
14.5.2. By Power Output
14.5.3. By Product Type
14.5.4. By Application
14.5.5. By End-use Industry
14.6. Drivers and Restraints - Impact Analysis
15. Latin America Analysis 2016-2020 and Forecast 2021-2031
15.1. Introduction
15.2. Pricing Analysis
15.3. Historical Market Size (US$ Mn) and Volume Trend Analysis By Market Taxonomy, 2016-2020
15.4. Market Size (US$ Mn) and Volume Forecast By Market Taxonomy, 2021-2031
15.4.1. By Country
15.4.1.1. Brazil
15.4.1.2. Mexico
15.4.1.3. Rest of Latin America
15.4.2. By Power Output
15.4.3. By Product Type
15.4.4. By Application
15.4.5. By End-use Industry
15.5. Market Attractiveness Analysis
15.5.1. By Country
15.5.2. By Power Output
15.5.3. By Product Type
15.5.4. By Application
15.5.5. By End-use Industry
15.6. Drivers and Restraints - Impact Analysis
16. Europe Analysis 2016-2020 and Forecast 2021-2031
16.1. Introduction
16.2. Pricing Analysis
16.3. Historical Market Size (US$ Mn) and Volume Trend Analysis By Market Taxonomy, 2016-2020
16.4. Market Size (US$ Mn) and Volume Forecast By Market Taxonomy, 2021-2031
16.4.1. By Country
16.4.1.1. Germany
16.4.1.2. Italy
16.4.1.3. France
16.4.1.4. U.K.
16.4.1.5. Spain
16.4.1.6. BENELUX
16.4.1.7. Russia
16.4.1.8. Rest of Europe
16.4.2. By Power Output
16.4.3. By Product Type
16.4.4. By Application
16.4.5. By End-use Industry
16.5. Market Attractiveness Analysis
16.5.1. By Country
16.5.2. By Power Output
16.5.3. By Product Type
16.5.4. By Application
16.5.5. By End-use Industry
16.6. Drivers and Restraints - Impact Analysis
17. South Asia & Pacific Analysis 2016-2020 and Forecast 2021-2031
17.1. Introduction
17.2. Pricing Analysis
17.3. Historical Market Size (US$ Mn) and Volume Trend Analysis By Market Taxonomy, 2016-2020
17.4. Market Size (US$ Mn) and Volume Forecast By Market Taxonomy, 2021-2031
17.4.1. By Country
17.4.1.1. India
17.4.1.2. ASEAN
17.4.1.3. ANZ
17.4.1.4. Rest of South Asia
17.4.2. By Power Output
17.4.3. By Product Type
17.4.4. By Application
17.4.5. By End-use Industry
17.5. Market Attractiveness Analysis
17.5.1. By Country
17.5.2. By Power Output
17.5.3. By Product Type
17.5.4. By Application
17.5.5. By End-use Industry
17.6. Drivers and Restraints - Impact Analysis
18. East Asia Analysis 2016-2020 and Forecast 2021-2031
18.1. Introduction
18.2. Pricing Analysis
18.3. Historical Market Size (US$ Mn) and Volume Trend Analysis By Market Taxonomy, 2016-2020
18.4. Market Size (US$ Mn) and Volume Forecast By Market Taxonomy, 2021-2031
18.4.1. By Country
18.4.1.1. China
18.4.1.2. Japan
18.4.1.3. South Korea
18.4.2. By Power Output
18.4.3. By Product Type
18.4.4. By Application
18.4.5. By End-use Industry
18.5. Market Attractiveness Analysis
18.5.1. By Country
18.5.2. By Power Output
18.5.3. By Product Type
18.5.4. By Application
18.5.5. By End-use Industry
18.6. rivers and Restraints - Impact Analysis
19. Middle East and Africa Analysis 2016-2020 and Forecast 2021-2031
19.1. Introduction
19.2. Pricing Analysis
19.3. Historical Market Size (US$ Mn) and Volume Trend Analysis By Market Taxonomy, 2016-2020
19.4. Market Size (US$ Mn) and Volume Forecast By Market Taxonomy, 2021-2031
19.4.1. By Country
19.4.1.1. GCC Countries
19.4.1.2. Turkey
19.4.1.3. South Africa
19.4.1.4. Rest of Middle East and Africa
19.4.2. By Power Output
19.4.3. By Product Type
19.4.4. By Application
19.4.5. By End-use Industry
19.5. Market Attractiveness Analysis
19.5.1. By Country
19.5.2. By Power Output
19.5.3. By Product Type
19.5.4. By Application
19.5.5. By End-use Industry
19.6. Drivers and Restraints - Impact Analysis
20. Key and Emerging Countries for Analysis
20.1. U.S. Analysis
20.1.1. By Power Output
20.1.2. By Product Type
20.1.3. By Application
20.1.4. By End-use Industry
20.2. Canada Analysis
20.2.1. By Power Output
20.2.2. By Product Type
20.2.3. By Application
20.2.4. By End-use Industry
20.3. Mexico Analysis
20.3.1. By Power Output
20.3.2. By Product Type
20.3.3. By Application
20.3.4. By End-use Industry
20.4. Brazil Analysis
20.4.1. By Power Output
20.4.2. By Product Type
20.4.3. By Application
20.4.4. By End-use Industry
20.5. Germany Analysis
20.5.1. By Power Output
20.5.2. By Product Type
20.5.3. By Application
20.5.4. By End-use Industry
20.6. Italy Analysis
20.6.1. By Power Output
20.6.2. By Product Type
20.6.3. By Application
20.6.4. By End-use Industry
20.7. France Analysis
20.7.1. By Power Output
20.7.2. By Product Type
20.7.3. By Application
20.7.4. By End-use Industry
20.8. U.K. Analysis
20.8.1. By Power Output
20.8.2. By Product Type
20.8.3. By Application
20.8.4. By End-use Industry
20.9. Spain Analysis
20.9.1. By Power Output
20.9.2. By Product Type
20.9.3. By Application
20.9.4. By End-use Industry
20.10. BENELUX Analysis
20.10.1. By Power Output
20.10.2. By Product Type
20.10.3. By Application
20.10.4. By End-use Industry
20.11. Russia Analysis
20.11.1. By Power Output
20.11.2. By Product Type
20.11.3. By Application
20.11.4. By End-use Industry
20.12. China Analysis
20.12.1. By Power Output
20.12.2. By Product Type
20.12.3. By Application
20.12.4. By End-use Industry
20.13. Japan Analysis
20.13.1. By Power Output
20.13.2. By Product Type
20.13.3. By Application
20.13.4. By End-use Industry
20.14. South Korea Analysis
20.14.1. By Power Output
20.14.2. By Product Type
20.14.3. By Application
20.14.4. By End-use Industry
20.15. India Analysis
20.15.1. By Power Output
20.15.2. By Product Type
20.15.3. By Application
20.15.4. By End-use Industry
20.16. ASEAN Analysis
20.16.1. By Power Output
20.16.2. By Product Type
20.16.3. By Application
20.16.4. By End-use Industry
20.17. Australia and New Zealand Analysis
20.17.1. By Power Output
20.17.2. By Product Type
20.17.3. By Application
20.17.4. By End-use Industry
20.18. GCC Countries Analysis
20.18.1. By Power Output
20.18.2. By Product Type
20.18.3. By Application
20.18.4. By End-use Industry
20.19. South Africa Analysis
20.19.1. By Power Output
20.19.2. By Product Type
20.19.3. By Application
20.19.4. By End-use Industry
20.20. Turkey Analysis
20.20.1. By Power Output
20.20.2. By Product Type
20.20.3. By Application
20.20.4. By End-use Industry
21. Market Structure Analysis
21.1. Market Analysis by Tier of Companies (Electric Motor)
21.2. Market Concentration
21.3. Market Share Analysis of Top Players
21.4. Market Presence Analysis
22. Competition Analysis
22.1. Competition Dashboard
22.2. Pricing Analysis by Competition
22.3. Competition Benchmarking\
22.4. Competition Deep Dive
22.4.1. General Electric
22.4.1.1. Overview
22.4.1.2. Product Portfolio
22.4.1.3. Profitability by Market Segments (Product/Channel/Region)
22.4.1.4. Sales Footprint
22.4.1.5. Strategy Overview
22.4.1.5.1. Marketing Strategy
22.4.1.5.2. Product Strategy
22.4.1.5.3. Channel Strategy
22.4.2. Robert Bosch GmbH
22.4.2.1. Overview
22.4.2.2. Product Portfolio
22.4.2.3. Profitability by Market Segments (Product/Channel/Region)
22.4.2.4. Sales Footprint
22.4.2.5. Strategy Overview
22.4.2.5.1. Marketing Strategy
22.4.2.5.2. Product Strategy
22.4.2.5.3. Channel Strategy
22.4.3. Hitachi, Ltd.
22.4.3.1. Overview
22.4.3.2. Product Portfolio
22.4.3.3. Profitability by Market Segments (Product/Channel/Region)
22.4.3.4. Sales Footprint
22.4.3.5. Strategy Overview
22.4.3.5.1. Marketing Strategy
22.4.3.5.2. Product Strategy
22.4.3.5.3. Channel Strategy
22.4.4. Nidec Corporation
22.4.4.1. Overview
22.4.4.2. Product Portfolio
22.4.4.3. Profitability by Market Segments (Product/Channel/Region)
22.4.4.4. Sales Footprint
22.4.4.5. Strategy Overview
22.4.4.5.1. Marketing Strategy
22.4.4.5.2. Product Strategy
22.4.4.5.3. Channel Strategy
22.4.5. WEG S.A.
22.4.5.1. Overview
22.4.5.2. Product Portfolio
22.4.5.3. Profitability by Market Segments (Product/Channel/Region)
22.4.5.4. Sales Footprint
22.4.5.5. Strategy Overview
22.4.5.5.1. Marketing Strategy
22.4.5.5.2. Product Strategy
22.4.5.5.3. Channel Strategy
22.4.6. Siemens AG
22.4.6.1. Overview
22.4.6.2. Product Portfolio
22.4.6.3. Profitability by Market Segments (Product/Channel/Region)
22.4.6.4. Sales Footprint
22.4.6.5. Strategy Overview
22.4.6.5.1. Marketing Strategy
22.4.6.5.2. Product Strategy
22.4.6.5.3. Channel Strategy
22.4.7. ABB Group
22.4.7.1. Overview
22.4.7.2. Product Portfolio
22.4.7.3. Profitability by Market Segments (Product/Channel/Region)
22.4.7.4. Sales Footprint
22.4.7.5. Strategy Overview
22.4.7.5.1. Marketing Strategy
22.4.7.5.2. Product Strategy
22.4.7.5.3. Channel Strategy
22.4.8. Regal Beloit Corporation
22.4.8.1. Overview
22.4.8.2. Product Portfolio
22.4.8.3. Profitability by Market Segments (Product/Channel/Region)
22.4.8.4. Sales Footprint
22.4.8.5. Strategy Overview
22.4.8.5.1. Marketing Strategy
22.4.8.5.2. Product Strategy
22.4.8.5.3. Channel Strategy
22.4.9. Toshiba Corporation
22.4.9.1. Overview
22.4.9.2. Product Portfolio
22.4.9.3. Profitability by Market Segments (Product/Channel/Region)
22.4.9.4. Sales Footprint
22.4.9.5. Strategy Overview
22.4.9.5.1. Marketing Strategy
22.4.9.5.2. Product Strategy
22.4.9.5.3. Channel Strategy
22.4.10. Johnson Electric
22.4.10.1. Overview
22.4.10.2. Product Portfolio
22.4.10.3. Profitability by Market Segments (Product/Channel/Region)
22.4.10.4. Sales Footprint
22.4.10.5. Strategy Overview
22.4.10.5.1. Marketing Strategy
22.4.10.5.2. Product Strategy
22.4.10.5.3. Channel Strategy
22.4.11. Hyosung Corporation
22.4.11.1. Overview
22.4.11.2. Product Portfolio
22.4.11.3. Profitability by Market Segments (Product/Channel/Region)
22.4.11.4. Sales Footprint
22.4.11.5. Strategy Overview
22.4.11.5.1. Marketing Strategy
22.4.11.5.2. Product Strategy
22.4.11.5.3. Channel Strategy
22.4.12. Schneider Electric SE
22.4.12.1. Overview
22.4.12.2. Product Portfolio
22.4.12.3. Profitability by Market Segments (Product/Channel/Region)
22.4.12.4. Sales Footprint
22.4.12.5. Strategy Overview
22.4.12.5.1. Marketing Strategy
22.4.12.5.2. Product Strategy
22.4.12.5.3. Channel Strategy
22.4.13. Bonfiglioli Riduttori S.p.A.
22.4.13.1. Overview
22.4.13.2. Product Portfolio
22.4.13.3. Profitability by Market Segments (Product/Channel/Region)
22.4.13.4. Sales Footprint
22.4.13.5. Strategy Overview
22.4.13.5.1. Marketing Strategy
22.4.13.5.2. Product Strategy
22.4.13.5.3. Channel Strategy
22.4.14. Kirloskar Electric Company Ltd.
22.4.14.1. Overview
22.4.14.2. Product Portfolio
22.4.14.3. Profitability by Market Segments (Product/Channel/Region)
22.4.14.4. Sales Footprint
22.4.14.5. Strategy Overview
22.4.14.5.1. Marketing Strategy
22.4.14.5.2. Product Strategy
22.4.14.5.3. Channel Strategy
22.4.15. Allied Motion Technologies Inc.
22.4.15.1. Overview
22.4.15.2. Product Portfolio
22.4.15.3. Profitability by Market Segments (Product/Channel/Region)
22.4.15.4. Sales Footprint
22.4.15.5. Strategy Overview
22.4.15.5.1. Marketing Strategy
22.4.15.5.2. Product Strategy
22.4.15.5.3. Channel Strategy
22.4.16. East West Manufacturing, LLC
22.4.16.1. Overview
22.4.16.2. Product Portfolio
22.4.16.3. Profitability by Market Segments (Product/Channel/Region)
22.4.16.4. Sales Footprint
22.4.16.5. Strategy Overview
22.4.16.5.1. Marketing Strategy
22.4.16.5.2. Product Strategy
22.4.16.5.3. Channel Strategy
22.4.17. Hyundai Electric Co. Ltd.
22.4.17.1. Overview
22.4.17.2. Product Portfolio
22.4.17.3. Profitability by Market Segments (Product/Channel/Region)
22.4.17.4. Sales Footprint
22.4.17.5. Strategy Overview
22.4.17.5.1. Marketing Strategy
22.4.17.5.2. Product Strategy
22.4.17.5.3. Channel Strategy
23. Assumptions and Acronyms Used
24. Research Methodology
Let us know your requirement to get
100% FREE customization
List of Tables
Table 01: Global Market Value (US$ Bn) & Volume (‘000 Units) Historical Data 2013 – 2017 and Forecast 2021 – 2031 by Power Output
Table 02: Global Market Value (US$ Bn) & Volume (‘000 Units) Historical Data 2013 – 2017 and Forecast 2021 – 2031 by Power Output
Table 03: Global Market Value (US$ Bn) & Volume (‘000 Units) Historical Data 2013 – 2017 and Forecast 2021 – 2031 by Product Type
Table 04: Global Market Value (US$ Bn) & Volume (‘000 Units) Historical Data 2013 – 2017 and Forecast 2021 – 2031 by Application
Table 05: Global Market Value (US$ Bn) & Volume (‘000 Units) Historical Data 2013 – 2017 and Forecast 2021 – 2031 by Application
Table 06: Global Market Value (US$ Bn) & Volume (‘000 Units) Historical Data 2013 – 2017 and Forecast 2021 – 2031 by End-Use
Table 07: Global Market Value (US$ Bn) & Volume (‘000 Units) Historical Data 2013 – 2017 and Forecast 2021 – 2031 by End-Use
Table 08: Global Market Value (US$ Bn) & Volume (‘000 Units) Historical Data 2013 – 2017 and Forecast 2021 – 2031 by End-Use
Table 09: Global Market Value (US$ Bn) & Volume (‘000 Units) Historical Data 2013 – 2017 and Forecast 2021 – 2031 by Region
Table 10: North America Market Value (US$ Bn) & Volume (‘000 Units) Historical Data 2016 - 2020 and Forecast 2021 - 2031 by Country
Table 11: North America Market Value (US$ Bn) & Volume (‘000 Units) Historical Data 2016 - 2020 and Forecast 2021 - 2031 by Power Output
Table 12: North America Market Value (US$ Bn) & Volume (‘000 Units) Historical Data 2016 - 2020 and Forecast 2021 - 2031 by Power Output
Table 13: North America Market Value (US$ Bn) & Volume (‘000 Units) Historical Data 2016 - 2020 and Forecast 2021 - 2031 by Product Type
Table 14: North America Volume (‘000 Units) Historical Data 2016 - 2020 and Forecast 2021 - 2031 by Application
Table 15: North America Value (US$ Bn) Historical Data 2016 - 2020 and Forecast 2021 - 2031 by Application
Table 16: North America Market Value (US$ Bn) & Volume (‘000 Units) Historical Data 2016 - 2020 and Forecast 2021 - 2031 by End-Use
Table 17: North America Market Value (US$ Bn) & Volume (‘000 Units) Historical Data 2016 - 2020 and Forecast 2021 - 2031 by End-Use
Table 18: North America Market Value (US$ Bn) & Volume (‘000 Units) Historical Data 2016 - 2020 and Forecast 2021 - 2031 by End-Use
Table 19: Latin America Market Value (US$ Bn) & Volume (‘000 Units) Historical Data 2016 - 2020 and Forecast 2021 - 2031 by Country
Table 20: Latin America Market Value (US$ Bn) & Volume (‘000 Units) Historical Data 2016 - 2020 and Forecast 2021 - 2031 by Power Output
Table 21: Latin America Market Value (US$ Bn) & Volume (‘000 Units) Historical Data 2016 - 2020 and Forecast 2021 - 2031 by Power Output
Table 22: Latin America Market Value (US$ Bn) & Volume (‘000 Units) Historical Data 2016 - 2020 and Forecast 2021 - 2031 by Product Type
Table 23: Latin America Volume (‘000 Units) Historical Data 2016 - 2020 and Forecast 2021 - 2031 by Application
Table 24: Latin America Value (US$ Bn) Historical Data 2016 - 2020 and Forecast 2021 - 2031 by Application
Table 25: Latin America Market Value (US$ Bn) & Volume (‘000 Units) Historical Data 2016 - 2020 and Forecast 2021 - 2031 by End-Use
Table 26: Latin America Market Value (US$ Bn) & Volume (‘000 Units) Historical Data 2016 - 2020 and Forecast 2021 - 2031 by End-Use
Table 27: Latin America Market Value (US$ Bn) & Volume (‘000 Units) Historical Data 2016 - 2020 and Forecast 2021 - 2031 by End-Use
Table 28: Europe Market Volume (‘000 Units) Historical Data 2016 - 2020 and Forecast 2021 - 2031 by Country
Table 29: Europe Market Value (US$ Bn) Historical Data 2016 - 2020 and Forecast 2021 - 2031 by Country
Table 30: Europe Market Value (US$ Bn) & Volume (‘000 Units) Historical Data 2016 - 2020 and Forecast 2021 - 2031 by Power Output
Table 31: Europe Market Value (US$ Bn) & Volume (‘000 Units) Historical Data 2016 - 2020 and Forecast 2021 - 2031 by Power Output
Table 32: Europe Market Value (US$ Bn) & Volume (‘000 Units) Historical Data 2016 - 2020 and Forecast 2021 - 2031 by Product Type
Table 33: Europe Volume (‘000 Units) Historical Data 2016 - 2020 and Forecast 2021 - 2031 by Application
Table 34: Europe Value (US$ Bn) Historical Data 2016 - 2020 and Forecast 2021 - 2031 by Application
Table 35: Europe Market Value (US$ Bn) & Volume (‘000 Units) Historical Data 2016 - 2020 and Forecast 2021 - 2031 by End-Use
Table 36: Europe Market Value (US$ Bn) & Volume (‘000 Units) Historical Data 2016 - 2020 and Forecast 2021 - 2031 by End-Use
Table 37: Europe Market Value (US$ Bn) & Volume (‘000 Units) Historical Data 2016 - 2020 and Forecast 2021 - 2031 by End-Use
Table 38: East Asia Market Volume (‘000 Units) Historical Data 2016 - 2020 and Forecast 2021 - 2031 by Country
Table 39: East Asia Market Value (US$ Bn) & Volume (‘000 Units) Historical Data 2016 - 2020 and Forecast 2021 - 2031 by Power Output
Table 40: East Asia Market Value (US$ Bn) & Volume (‘000 Units) Historical Data 2016 - 2020 and Forecast 2021 - 2031 by Power Output
Table 41: East Asia Market Value (US$ Bn) & Volume (‘000 Units) Historical Data 2016 - 2020 and Forecast 2021 - 2031 by Product Type
Table 42: East Asia Volume (‘000 Units) Historical Data 2016 - 2020 and Forecast 2021 - 2031 by Application
Table 43: East Asia Value (US$ Bn) Historical Data 2016 - 2020 and Forecast 2021 - 2031 by Application
Table 44: East Asia Market Value (US$ Bn) & Volume (‘000 Units) Historical Data 2016 - 2020 and Forecast 2021 - 2031 by End-Use
Table 45: East Asia Market Value (US$ Bn) & Volume (‘000 Units) Historical Data 2016 - 2020 and Forecast 2021 - 2031 by End-Use
Table 46: East Asia Market Value (US$ Bn) & Volume (‘000 Units) Historical Data 2016 - 2020 and Forecast 2021 - 2031 by End-Use
Table 47: South Asia & Pacific Market Volume (‘000 Units) Historical Data 2016 - 2020 and Forecast 2021 - 2031 by Country
Table 48: South Asia & Pacific Market Value (US$ Bn) & Volume (‘000 Units) Historical Data 2016 - 2020 and Forecast 2021 - 2031 by Power Output
Table 49: South Asia & Pacific Market Value (US$ Bn) & Volume (‘000 Units) Historical Data 2016 - 2020 and Forecast 2021 - 2031 by Power Output
Table 50: South Asia & Pacific Market Value (US$ Bn) & Volume (‘000 Units) Historical Data 2016 - 2020 and Forecast 2021 - 2031 by Product Type
Table 51: South Asia & Pacific Volume (‘000 Units) Historical Data 2016 - 2020 and Forecast 2021 - 2031 by Application
Table 52: South Asia & Pacific Value (US$ Bn) Historical Data 2016 - 2020 and Forecast 2021 - 2031 by Application
Table 53: South Asia & Pacific Market Value (US$ Bn) & Volume (‘000 Units) Historical Data 2016 - 2020 and Forecast 2021 - 2031 by End-Use
Table 54: South Asia & Pacific Market Value (US$ Bn) & Volume (‘000 Units) Historical Data 2016 - 2020 and Forecast 2021 - 2031 by End-Use
Table 55: South Asia & Pacific Market Value (US$ Bn) & Volume (‘000 Units) Historical Data 2016 - 2020 and Forecast 2021 - 2031 by End-Use
Table 56: Middle East & Africa Market Volume (‘000 Units) Historical Data 2016 - 2020 and Forecast 2021 - 2031 by Country
Table 57: Middle East & Africa Market Value (US$ Bn) & Volume (‘000 Units) Historical Data 2016 - 2020 and Forecast 2021 - 2031 by Power Output
Table 58: Middle East & Africa Market Value (US$ Bn) & Volume (‘000 Units) Historical Data 2016 - 2020 and Forecast 2021 - 2031 by Power Output
Table 59: Middle East & Africa Market Value (US$ Bn) & Volume (‘000 Units) Historical Data 2016 - 2020 and Forecast 2021 - 2031 by Product Type
Table 60: Middle East & Africa Volume (‘000 Units) Historical Data 2016 - 2020 and Forecast 2021 - 2031 by Application
Table 61: Middle East & Africa Value (US$ Bn) Historical Data 2016 - 2020 and Forecast 2021 - 2031 by Application
Table 62: Middle East & Africa Market Value (US$ Bn) & Volume (‘000 Units) Historical Data 2016 - 2020 and Forecast 2021 - 2031 by End-Use
Table 63: Middle East & Africa Market Value (US$ Bn) & Volume (‘000 Units) Historical Data 2016 - 2020 and Forecast 2021 - 2031 by End-Use
Table 64: Middle East & Africa Market Value (US$ Bn) & Volume (‘000 Units) Historical Data 2016 - 2020 and Forecast 2021 - 2031 by End-Use
Find your sweet spots for generating winning opportunities in this market.
Talk to AnalystList of Charts
Figure 01: Global Market Volume ('000 Units) and Y-o-Y Growth Rate From 2021-2031
Figure 02: Global Market Value (US$ Bn) and Y-o-Y Growth Rate From 2021-2031
Figure 03: Global Market Absolute $ opportunity Analysis, 2021-2031
Figure 04: Global Market Share and BPS Analysis by Power Output– 2021 & 2031
Figure 05: Global Y-o-Y Growth Projection by Power Output, 2021 – 2031
Figure 06: Global Market Attractiveness Index by Power Output, 2021 – 2031
Figure 07: Global Market Incremental $ Opportunity by Power Output,
Figure 08: Global Market Share and BPS Analysis by Product Type – 2021 & 2031
Figure 09: Global Y-o-Y Growth Projection by Product Type, 2021 – 2031
Figure 10: Global Market Attractiveness Index by Product Type, 2021 – 2031
Figure 11: Global Market Incremental $ Opportunity by Product Type,
Figure 12: Global Market Share and BPS Analysis by Application– 2021 & 2031
Figure 13: Global Y-o-Y Growth Projection by Application, 2021 – 2031
Figure 14: Global Market Attractiveness Index by Application, 2021 – 2031
Figure 15: Global Market Incremental $ Opportunity by Application,
Figure 16: Global Market Share and BPS Analysis by End-Use– 2021 & 2031
Figure 17: Global Y-o-Y Growth Projection by End-Use, 2021 – 2031
Figure 18: Global Market Attractiveness Index by End-Use, 2021 – 2031
Figure 19: Global Market Incremental $ Opportunity by End-Use,
Figure 20: Global Market Share and BPS Analysis by Region– 2021 & 2031
Figure 21: Global Y-o-Y Growth Projection by Region, 2021 – 2031
Figure 22: Global Market Attractiveness Index by Region, 2021 – 2031
Figure 23: Global Market Incremental $ Opportunity by Region,
Figure 24: North America Market Share and BPS Analysis by Country– 2021 & 2031
Figure 25: North America Y-o-Y Growth Projection by Country, 2021 - 2031
Figure 26: North America Market Attractiveness Index by Country, 2021 - 2031
Figure 27: Global Market Incremental $ Opportunity by Technology,
Figure 28: North America Market Share and BPS Analysis by Power Output– 2021 & 2031
Figure 29: North America Y-o-Y Growth Projection by Power Output, 2021 - 2031
Figure 30: North America Market Attractiveness Index by Power Output, 2021 - 2031
Figure 31: North America Market Share and BPS Analysis by Product Type – 2021 & 2031
Figure 32: North America Y-o-Y Growth Projection by Product Type, 2021 - 2031
Figure 33: North America Market Attractiveness Index by Product Type, 2021 - 2031
Figure 34: North America Market Share and BPS Analysis by Application– 2021 & 2031
Figure 35: North America Y-o-Y Growth Projection by Application, 2021 - 2031
Figure 36: North America Market Attractiveness Index by Application, 2021 - 2031
Figure 37: North America Market Share and BPS Analysis by End-Use– 2021 & 2031
Figure 38: North America Y-o-Y Growth Projection by End-Use, 2021 - 2031
Figure 39: North America Market Attractiveness Index by End-Use, 2021 - 2031
Figure 40: Latin America Market Share and BPS Analysis by Country– 2021 & 2031
Figure 41: Latin America Y-o-Y Growth Projection by Country, 2021 - 2031
Figure 42: Latin America Market Attractiveness Index by Country, 2021 - 2031
Figure 43: Global Market Incremental $ Opportunity by Technology,
Figure 44: Latin America Market Share and BPS Analysis by Power Output– 2021 & 2031
Figure 45: Latin America Y-o-Y Growth Projection by Power Output, 2021 - 2031
Figure 46: Latin America Market Attractiveness Index by Power Output, 2021 - 2031
Figure 47: Latin America Market Share and BPS Analysis by Product Type – 2021 & 2031
Figure 48: Latin America Y-o-Y Growth Projection by Product Type, 2021 - 2031
Figure 49: Latin America Market Attractiveness Index by Product Type, 2021 - 2031
Figure 50: Latin America Market Share and BPS Analysis by Application– 2021 & 2031
Figure 51: Latin America Y-o-Y Growth Projection by Application, 2021 - 2031
Figure 52: Latin America Market Attractiveness Index by Application, 2021 - 2031
Figure 53: Latin America Market Share and BPS Analysis by End-Use– 2021 & 2031
Figure 54: Latin America Y-o-Y Growth Projection by End-Use, 2021 - 2031
Figure 55: Latin America Market Attractiveness Index by End-Use, 2021 - 2031
Figure 56: Europe Market Share and BPS Analysis by Country– 2021 & 2031
Figure 57: Europe Y-o-Y Growth Projection by Country, 2021 - 2031
Figure 58: Europe Market Attractiveness Index by Country, 2021 - 2031
Figure 59: Global Market Incremental $ Opportunity by Technology,
Figure 60: Europe Market Share and BPS Analysis by Power Output– 2021 & 2031
Figure 61: Europe Y-o-Y Growth Projection by Power Output, 2021 - 2031
Figure 62: Europe Market Attractiveness Index by Power Output, 2021 - 2031
Figure 63: Europe Market Share and BPS Analysis by Product Type – 2021 & 2031
Figure 64: Europe Y-o-Y Growth Projection by Product Type, 2021 - 2031
Figure 65: Europe Market Attractiveness Index by Product Type, 2021 - 2031
Figure 66: Europe Market Share and BPS Analysis by Application– 2021 & 2031
Figure 67: Europe Y-o-Y Growth Projection by Application, 2021 - 2031
Figure 68: Europe Market Attractiveness Index by Application, 2021 - 2031
Figure 69: Europe Market Share and BPS Analysis by End-Use– 2021 & 2031
Figure 70: Europe Y-o-Y Growth Projection by End-Use, 2021 - 2031
Figure 71: Europe Market Attractiveness Index by End-Use, 2021 - 2031
Figure 72: East Asia Market Share and BPS Analysis by Country– 2021 & 2031
Figure 73: East Asia Y-o-Y Growth Projection by Country, 2021 - 2031
Figure 74: East Asia Market Attractiveness Index by Country, 2021 - 2031
Figure 75: Global Market Incremental $ Opportunity by Technology,
Figure 76: East Asia Market Share and BPS Analysis by Power Output– 2021 & 2031
Figure 77: East Asia Y-o-Y Growth Projection by Power Output, 2021 - 2031
Figure 78: East Asia Market Attractiveness Index by Power Output, 2021 - 2031
Figure 79: East Asia Market Share and BPS Analysis by Product Type – 2021 & 2031
Figure 80: East Asia Y-o-Y Growth Projection by Product Type, 2021 - 2031
Figure 81: East Asia Market Attractiveness Index by Product Type, 2021 - 2031
Figure 82: East Asia Market Share and BPS Analysis by Application– 2021 & 2031
Figure 83: East Asia Y-o-Y Growth Projection by Application, 2021 - 2031
Figure 84: East Asia Market Attractiveness Index by Application, 2021 - 2031
Figure 85: East Asia Market Share and BPS Analysis by End-Use– 2021 & 2031
Figure 86: East Asia Y-o-Y Growth Projection by End-Use, 2021 - 2031
Figure 87: East Asia Market Attractiveness Index by End-Use, 2021 - 2031
Figure 88: South Asia & Pacific Market Share and BPS Analysis by Country– 2021 & 2031
Figure 89: South Asia & Pacific Y-o-Y Growth Projection by Country, 2021 - 2031
Figure 90: South Asia & Pacific Market Attractiveness Index by Country, 2021 - 2031
Figure 91: Global Market Incremental $ Opportunity by Technology,
Figure 92: South Asia & Pacific Market Share and BPS Analysis by Power Output– 2021 & 2031
Figure 93: South Asia & Pacific Y-o-Y Growth Projection by Power Output, 2021 - 2031
Figure 94: South Asia & Pacific Market Attractiveness Index by Power Output, 2021 - 2031
Figure 95: South Asia & Pacific Market Share and BPS Analysis by Product Type – 2021 & 2031
Figure 96: South Asia & Pacific Y-o-Y Growth Projection by Product Type, 2021 - 2031
Figure 97: South Asia & Pacific Market Attractiveness Index by Product Type, 2021 - 2031
Figure 98: South Asia & Pacific Market Share and BPS Analysis by Application– 2021 & 2031
Figure 99: South Asia & Pacific Y-o-Y Growth Projection by Application, 2021 - 2031
Figure 100: South Asia & Pacific Market Attractiveness Index by Application, 2021 - 2031
Figure 101: South Asia & Pacific Market Share and BPS Analysis by End-Use– 2021 & 2031
Figure 102: South Asia & Pacific Y-o-Y Growth Projection by End-Use, 2021 - 2031
Figure 103: South Asia & Pacific Market Attractiveness Index by End-Use, 2021 - 2031
Figure 104: Middle East & Africa Market Share and BPS Analysis by Country– 2021 & 2031
Figure 105: Middle East & Africa Y-o-Y Growth Projection by Country, 2021 - 2031
Figure 106: Middle East & Africa Market Attractiveness Index by Country, 2021 - 2031
Figure 107: Middle East & Africa Market Share and BPS Analysis by Power Output– 2021 & 2031
Figure 108: Middle East & Africa Y-o-Y Growth Projection by Power Output, 2021 - 2031
Figure 109: Middle East & Africa Market Attractiveness Index by Power Output, 2021 - 2031
Figure 110: Middle East & Africa Market Share and BPS Analysis by Product Type – 2021 & 2031
Figure 111: Middle East & Africa Y-o-Y Growth Projection by Product Type, 2021 - 2031
Figure 112: Middle East & Africa Market Attractiveness Index by Product Type, 2021 - 2031
Figure 113: Middle East & Africa Market Share and BPS Analysis by Application– 2021 & 2031
Figure 114: Middle East & Africa Y-o-Y Growth Projection by Application, 2021 - 2031
Figure 115: Middle East & Africa Market Attractiveness Index by Application, 2021 - 2031
Figure 116: Middle East & Africa Market Share and BPS Analysis by End-Use– 2021 & 2031
Figure 117: Middle East & Africa Y-o-Y Growth Projection by End-Use, 2021 - 2031
Figure 118: Middle East & Africa Market Attractiveness Index by End-Use, 2021 – 2031
Need specific information?
Request CustomizationExplore Industrial Automation Insights
View Reports