AC Electric Motor Market Outlook

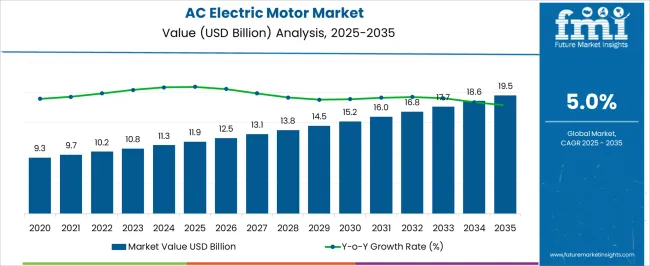
The sales of AC electric motors in the oil and gas industry are projected to be valued at US$ 11.3 billion by the end of 2024 and are expected to rise to US$ 18.6 billion by 2034. The global AC electric motor market is expected to grow at a CAGR of 5.10% during the forecast period.

Key Market Drivers:

The AC electric motor market in the global oil and gas industry generated an estimated revenue of US$ 8.2 billion in 2019. In the span of four years, the market grew at a pace of 6.80% CAGR and added a staggering revenue of US$ 3.1 billion. Several reasons can be attributed to this growth:

  • Rising demand for energy-efficient and sustainable solutions in oil and gas extraction to enhance environmental performance and operational efficiency
  • Increasing reliance on AC electric motors of exploration and production companies in the oil and gas industry due to their enhanced performance, reliability, and energy efficiency
  • Increasing awareness of environmental concerns, forcing stakeholders in the industry to adopt cleaner and greener solutions
  • Surging demand within the oil and gas industry due to the shift toward modernization and technological upgradation
  • The push for operational cost reduction amidst the evolving economic landscape, driving the adoption of cost-effective oil and gas solutions
  • Integration of smart technologies with AC electric motors, making them well-suited for demanding applications in drilling, pumping, and other critical processes
  • Advancements in AC motor technology, such as variable frequency drives (VFDs), are offering greater control and efficiency in oil and gas applications
  • Government incentives and regulations promoting energy-efficient solutions in the oil and gas industry to reduce carbon emissions and enhance sustainability
Attributes Key Statistics
Expected Base Year Value (2024) US$ 11.3 billion
Anticipated Forecast Value (2034) US$ 18.6 billion
Estimated Growth (2024 to 2034) 5.10% CAGR

Don't pay for what you don't need

Customize your report by selecting specific countries or regions and save 30%!

Consumption Analysis of the AC Electric Motor in the Oil and Gas Industry

  • Demand from exploration and drilling companies to power drilling rigs makes them a significant consumer pool in the AC electric motor market.
  • Sales of AC electric motors see a new high in the extraction and production facilities to transport oil and gas through compressors, pumping systems, and other equipment.
  • Refinery is yet another key consumer of AC electric motors in the oil and gas industry. Demand rises to power critical equipment and ensure efficient fluid flow, pressurization, and ventilation throughout the refining processes.
  • Adoption of AC electric motors in petrochemical plants is anticipated to rise to facilitate the blending, agitation, and transfer of various chemical components.
  • On a significantly smaller scale, midstream facilities also generate demand for AC electric motors in compressors and pumping stations to transport oil and gas from production sites to refineries or distribution points.

Historical Analysis of the AC Electric Motor Market in the Oil and Gas Industry

Demand for AC electric motors in the oil and gas industry heavily relies on a multitude of factors, such as the overall demand for oil and gas products in the international marketplace, capital investments in exploration and production projects, innovations and advancements in motor technology, etc. These factors decide the fate of the overall performance of AC electric motors in the oil and gas industry.

In the past few years, the market for AC electric motors has seen a series of ups and downs. During the pandemic, the oil and gas industry faced significant challenges due to a decline in global energy demand, travel restrictions, and economic uncertainties.

This negatively affected the global market revenue for AC electric motors as the pandemic led to a decrease in oil prices, causing companies to reassess their capital expenditures and delay or scale back projects.

However, as the world got accustomed to the new normal, things gradually began to pace up. As economies recovered, the oil and gas industry rebounded, positively impacting the AC electric motor market. Stakeholders across the world started investing heavily in their equipment, thus amplifying the growth of AC electric motors in the global oil and gas industry.

Attributes Key Statistics
Base Year Value (2019) US$ 8.2 million
Forecast Value (2023) US$ 10.6 billion
Estimated Growth (2019 to 2023) 6.80% CAGR
Sudip Saha
Sudip Saha

Principal Consultant

Talk to Analyst

Find your sweet spots for generating winning opportunities in this market.

Restraining Factors Adversely Affecting the AC Electric Motor Market

The AC electric motor market is anticipated to surpass a global valuation of US$ 18.6 billion by the year 2034, with a growth rate of 5.10% CAGR. While the market is expected to experience substantial growth, several restraining factors could adversely affect its development:

  • The growth of alternative energy storage technologies, such as batteries, for certain applications may pose a challenge to the AC electric motor market, particularly in areas where energy efficiency and environmental impact are critical considerations.
  • The initial costs associated with implementing AC electric motors, especially advanced and energy-efficient models, act as a deterrent for some end users.
  • Competition from DC motors, particularly in specific applications that offer advantages, such as energy-efficient operations, precise speed control, and applications with variable torque requirements.

Category-wise Insights

Induction Motors to Gain Popularity in the Oil and Gas Industry

Based on the type, induction motors dominate the global market with a CAGR of 4.0%. This rising preference is attributed to:

  • The robust design of these motors, making them well-suited for the demanding and harsh operating conditions commonly found in the oil and gas industry.
  • The reliability of induction motors, even in extreme temperatures, corrosive atmospheres, and potentially explosive environments
  • The capability of induction motors to operate efficiently across a range of speeds, especially when paired with variable frequency drives (VFDs),
  • Ongoing advancements in induction motor technology, including improvements in energy efficiency and the incorporation of energy-saving features
  • The ability of induction motors to deliver high torque at low speeds in applications such as pumping and drilling
Attributes Details
Type Induction Motors
CAGR 4.0%

AC Electric Motors, less than 1kV, dominates the Oil and Gas Industry Worldwide

On the basis of voltage, electric motors less than 1kV dominate the global market with a CAGR of 3.8%. This is primarily due to:

  • Widespread applicability of these motors, making them integral components in various operations within the oil and gas industry
  • Commonality of these motors, ensuring compatibility with existing infrastructure and power systems
  • Easy availability of these motors and a diverse range of options and specifications, making them easily accessible for various applications across different industries.
  • The versatility of electric motors less than 1kV, making them suitable for a wide range of applications within the oil and gas industry, such as powering pumps, compressors, driving fans, conveyors, etc.
Attributes Details
Voltage Less than 1kV
CAGR 0%

Get the data you need at a Fraction of the cost

Personalize your report by choosing insights you need
and save 40%!

Country-wise Insights

The section provides an analysis of the AC electric motors market by country, including South Korea, China, the United States, the United Kingdom, and Japan. The table presents the CAGR for each country, indicating the expected growth of the market in that country through 2034.

Countries CAGR
South Korea 7.40%
The United Kingdom 6.50%
China 6.00%
The United States 5.50%
Japan 3.70%

AC Electric Motor Market in South Korea

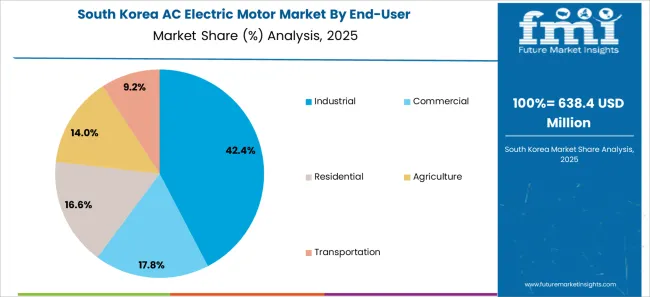
South Korea is one of the leading countries in this market. The Korean AC electric motor market is anticipated to retain its dominance by progressing at an annual growth rate of 7.40% till 2034.

South Korea is one of the most advanced countries when it comes to technological advancements in the manufacturing and engineering sectors. The government in this country has been actively promoting these advancements by providing funds and subsidies to the stakeholders in the market. This has pushed the demand for AC electric motors in various industries, especially the oil and gas industry.

AC Electric Motor Market in the United Kingdom

The United Kingdom leads the AC electric motor market in the European region. The market in the UK is anticipated to retain its dominance by progressing at an annual growth rate of 6.50% till 2034.

The United Kingdom is blessed with significant oil and gas reserves in the North Sea. This generates exponential demand for exploration, production, and related services in the country. Besides this, the United Kingdom is also pushing toward sustainability in all its industries, including the oil and gas industry. This has driven the demand for AC electric motors in the United Kingdom.

AC electric motor Market in China

In the Asian region, China is another country that dominates the AC electric motor market. The Chinese AC electric motor market is anticipated to exhibit an annual growth rate of 6.00% till 2034.

In the last few years, the Chinese economy has grown massively. This has led to an increasing demand for oil and gas in the country. This growth is also another reason for the government’s investment in the oil and gas sector to secure a stable energy supply. AC electric motors, being one of the crucial components in these operations, are, thus, in great demand in China. Also,
AC Electric Motor Market in the United States

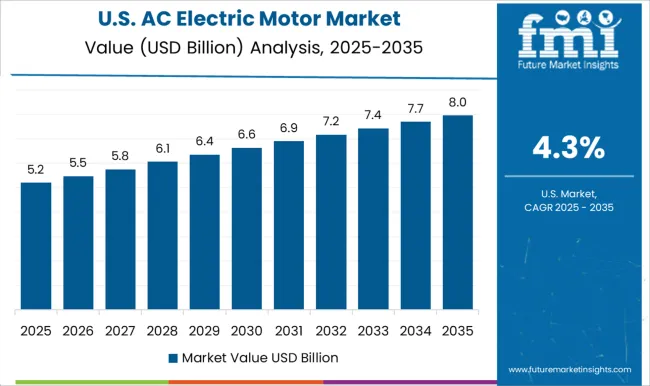
In the North American region, the United States leads the AC electric motor market. The United States AC electric motor market is anticipated to register a CAGR of 5.50% through 2034.

The shale gas revolution in the United States has transformed the country into a major player in the global oil and gas market, with increased production and exports contributing to market growth. This is one of the main reasons why the United States is one of the leading countries in this market.
AC Electric Motor Market in Japan

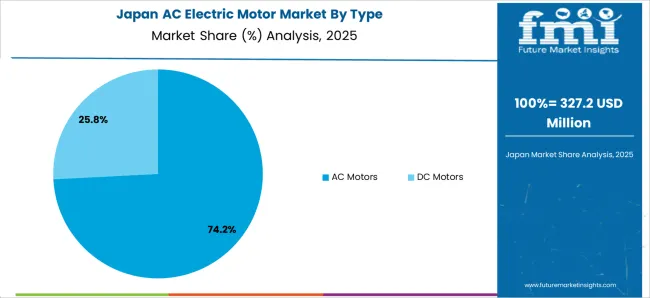
Japan is another Asian country leading in the AC electric motor market. Over the next ten years, Japanese demand for AC electric motors is projected to rise at a 3.70% CAGR.

Japan is a major importer of Liquefied Natural Gas, and the country's continued focus on expanding its LNG infrastructure and investments in related projects contributes to the growth of AC electric motors as they play a crucial role in supporting various aspects of LNG infrastructure.
Competitive Landscape

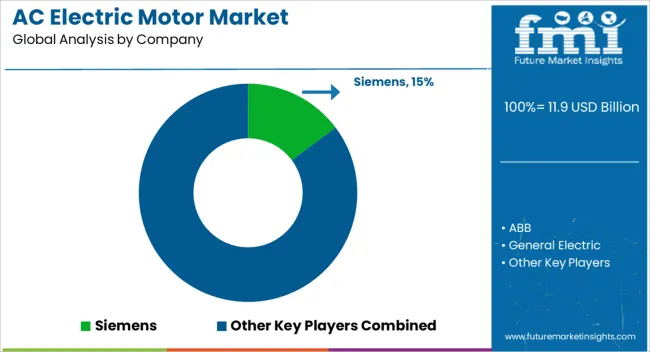
The global AC electric motors market is highly concentrated, with prominent players such as Siemens, General Electric, WEG, Emerson Electric, Nidec, Regal Beloit, Marathon Electric, Kirloskar Electric Company Limited, etc. Key companies in the market are investing heavily in research and development to introduce innovative technologies and improvements in electric motors.

They are also expanding the range of electric motors and related products, allowing companies to cater to a broader spectrum of applications within the oil and gas sector.

Recent Developments:

  • ABB launched the AMI 5800 NEMA modular induction motor in June 2023, offering exceptional energy efficiency and reliability in demanding applications such as pumps, compressors, and crushers. With a power output of up to 1750 HP, it provides modularity for projects in various industries, including oil, gas, and chemicals.
  • In July 2019, Ward Leonard, a US manufacturer of electric motors and generators, introduced the WL29BC200 AC induction motor tailored for mud pumps and draw works in oil and gas applications. The 2,000 HP motor is designed to fit into a 1,500 HP motor package, offering compactness and increased power density.

Key Companies in the Market

  • ABB
  • Siemens
  • General Electric
  • Schneider Electric
  • WEG
  • Emerson Electric
  • Nidec
  • Regal Beloit
  • TECO Electric & Machinery
  • Marathon Electric
  • Toshiba Corporation
  • Franklin Electric Co.
  • Yaskawa Electric Corporation
  • Baldor Electric Company
  • Johnson Electric Holdings Limited
  • Kirloskar Electric Company Limited
  • Hyundai Electric & Energy Systems
  • Brook Crompton UK Ltd.
  • CG Power and Industrial Solutions Ltd.
  • Leroy-Somer

Market Segmentation

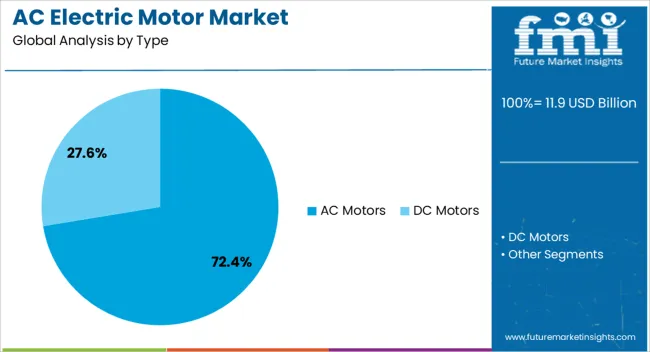
On the basis of type, the market has been segmented as follows:

  • AC motors
  • DC motors

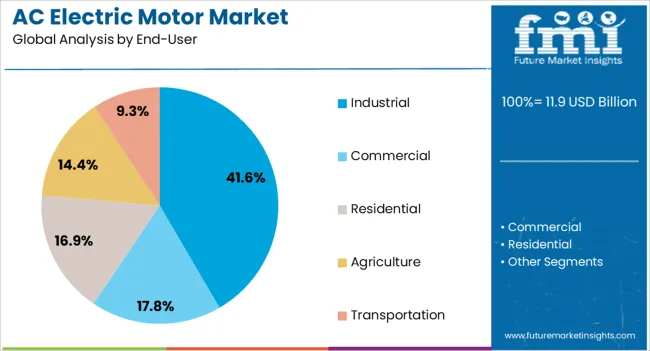
On the basis of end-user, the market has been segmented as follows:

  • Industrial
  • Commercial
  • Residential
  • Agriculture
  • Transportation

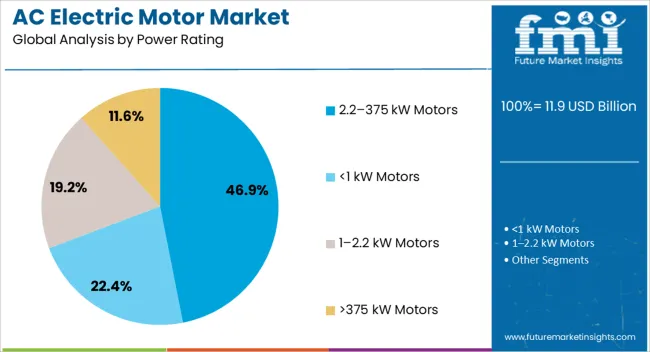
On the basis of power rating, the market has been segmented as follows:

  • <1 kW Motors
  • 1–2.2 kW Motors
  • 2.2–375 kW Motors
  • >375 kW Motors

On the basis of voltage, the market has been segmented as follows:

  • Low Voltage Motors
  • Medium Voltage Motors
  • High Voltage Motors

On the basis of rotor type, the market has been segmented as follows:

  • Inner Rotor
  • Outer Rotor

On the basis of output power, the market has been segmented as follows:

  • <1 HP
  • >1 HP

On the basis of region, the market has been segmented as follows:

  • Asia Pacific
  • Europe
  • North America
  • Middle East & Africa
  • Latin America

Frequently Asked Questions

How much is the AC electric motor market currently worth?

The global AC electric motor market is expected to be worth US$ 11.3 billion by 2024.

What is the sales forecast for AC electric motors through 2034?

The market for AC electric motors is expected to reach US$ 18.6 billion by 2034.

At what rate is the AC electric motor market growing across the world?

The AC electric motor market is growing at a CAGR of 5.10% from 2024 to 2034.

Who are the key manufacturing companies for AC electric motors?

Some of the key players in the market are Siemens, General Electric, WEG, Emerson Electric, Nidec, Regal Beloit, Marathon Electric, Kirloskar Electric Company Limited, etc.

Which is the most preferred AC electric motor in the international market?

The induction motor is the most preferred AC electric motor, with a CAGR of 4.0%.

Table of Content
1. Executive Summary
    1.1. Global Market Outlook
    1.2. Demand-side Trends
    1.3. Supply-side Trends
    1.4. Technology Roadmap Analysis
    1.5. Analysis and Recommendations
2. Market Overview
    2.1. Market Coverage / Taxonomy
    2.2. Market Definition / Scope / Limitations
3. Market Background
    3.1. Market Dynamics
        3.1.1. Drivers
        3.1.2. Restraints
        3.1.3. Opportunity
        3.1.4. Trends
    3.2. Scenario Forecast
        3.2.1. Demand in Optimistic Scenario
        3.2.2. Demand in Likely Scenario
        3.2.3. Demand in Conservative Scenario
    3.3. Opportunity Map Analysis
    3.4. Product Life Cycle Analysis
    3.5. Supply Chain Analysis
        3.5.1. Supply Side Participants and their Roles
            3.5.1.1. Producers
            3.5.1.2. Mid-Level Participants (Traders/ Agents/ Brokers)
            3.5.1.3. Wholesalers and Distributors
        3.5.2. Value Added and Value Created at Node in the Supply Chain
        3.5.3. List of Raw Material Suppliers
        3.5.4. List of Existing and Potential Buyer’s
    3.6. Investment Feasibility Matrix
    3.7. Value Chain Analysis
        3.7.1. Profit Margin Analysis
        3.7.2. Wholesalers and Distributors
        3.7.3. Retailers
    3.8. PESTLE and Porter’s Analysis
    3.9. Regulatory Landscape
        3.9.1. By Key Regions
        3.9.2. By Key Countries
    3.10. Regional Parent Market Outlook
    3.11. Production and Consumption Statistics
    3.12. Import and Export Statistics
4. Global Market Analysis 2019 to 2023 and Forecast, 2024 to 2034
    4.1. Historical Market Size Value (US$ Million) & Volume (Units) Analysis, 2019 to 2023
    4.2. Current and Future Market Size Value (US$ Million) & Volume (Units) Projections, 2024 to 2034
        4.2.1. Y-o-Y Growth Trend Analysis
        4.2.2. Absolute $ Opportunity Analysis
5. Global Market Analysis 2019 to 2023 and Forecast 2024 to 2034, By Type
    5.1. Introduction / Key Findings
    5.2. Historical Market Size Value (US$ Million) & Volume (Units) Analysis By Type, 2019 to 2023
    5.3. Current and Future Market Size Value (US$ Million) & Volume (Units) Analysis and Forecast By Type, 2024 to 2034
        5.3.1. Induction Motor
        5.3.2. Synchronous Motor
    5.4. Y-o-Y Growth Trend Analysis By Type, 2019 to 2023
    5.5. Absolute $ Opportunity Analysis By Type, 2024 to 2034
6. Global Market Analysis 2019 to 2023 and Forecast 2024 to 2034, By Voltage
    6.1. Introduction / Key Findings
    6.2. Historical Market Size Value (US$ Million) & Volume (Units) Analysis By Voltage, 2019 to 2023
    6.3. Current and Future Market Size Value (US$ Million) & Volume (Units) Analysis and Forecast By Voltage, 2024 to 2034
        6.3.1. Less than 1kV
        6.3.2. Between 1 kV and 6.6 kV
        6.3.3. Greater than 6.6 kV
    6.4. Y-o-Y Growth Trend Analysis By Voltage, 2019 to 2023
    6.5. Absolute $ Opportunity Analysis By Voltage, 2024 to 2034
7. Global Market Analysis 2019 to 2023 and Forecast 2024 to 2034, By Output Power
    7.1. Introduction / Key Findings
    7.2. Historical Market Size Value (US$ Million) & Volume (Units) Analysis By Output Power, 2019 to 2023
    7.3. Current and Future Market Size Value (US$ Million) & Volume (Units) Analysis and Forecast By Output Power, 2024 to 2034
        7.3.1. Less than 1 HP
        7.3.2. Greater than 1 HP
    7.4. Y-o-Y Growth Trend Analysis By Output Power, 2019 to 2023
    7.5. Absolute $ Opportunity Analysis By Output Power, 2024 to 2034
8. Global Market Analysis 2019 to 2023 and Forecast 2024 to 2034, By Region
    8.1. Introduction
    8.2. Historical Market Size Value (US$ Million) & Volume (Units) Analysis By Region, 2019 to 2023
    8.3. Current Market Size Value (US$ Million) & Volume (Units) Analysis and Forecast By Region, 2024 to 2034
        8.3.1. North America
        8.3.2. Latin America
        8.3.3. Western Europe
        8.3.4. Eastern Europe
        8.3.5. South Asia and Pacific
        8.3.6. East Asia
        8.3.7. Middle East and Africa
    8.4. Market Attractiveness Analysis By Region
9. North America Market Analysis 2019 to 2023 and Forecast 2024 to 2034, By Country
    9.1. Historical Market Size Value (US$ Million) & Volume (Units) Trend Analysis By Market Taxonomy, 2019 to 2023
    9.2. Market Size Value (US$ Million) & Volume (Units) Forecast By Market Taxonomy, 2024 to 2034
        9.2.1. By Country
            9.2.1.1. USA
            9.2.1.2. Canada
        9.2.2. By Type
        9.2.3. By Voltage
        9.2.4. By Output Power
    9.3. Market Attractiveness Analysis
        9.3.1. By Country
        9.3.2. By Type
        9.3.3. By Voltage
        9.3.4. By Output Power
    9.4. Key Takeaways
10. Latin America Market Analysis 2019 to 2023 and Forecast 2024 to 2034, By Country
    10.1. Historical Market Size Value (US$ Million) & Volume (Units) Trend Analysis By Market Taxonomy, 2019 to 2023
    10.2. Market Size Value (US$ Million) & Volume (Units) Forecast By Market Taxonomy, 2024 to 2034
        10.2.1. By Country
            10.2.1.1. Brazil
            10.2.1.2. Mexico
            10.2.1.3. Rest of Latin America
        10.2.2. By Type
        10.2.3. By Voltage
        10.2.4. By Output Power
    10.3. Market Attractiveness Analysis
        10.3.1. By Country
        10.3.2. By Type
        10.3.3. By Voltage
        10.3.4. By Output Power
    10.4. Key Takeaways
11. Western Europe Market Analysis 2019 to 2023 and Forecast 2024 to 2034, By Country
    11.1. Historical Market Size Value (US$ Million) & Volume (Units) Trend Analysis By Market Taxonomy, 2019 to 2023
    11.2. Market Size Value (US$ Million) & Volume (Units) Forecast By Market Taxonomy, 2024 to 2034
        11.2.1. By Country
            11.2.1.1. Germany
            11.2.1.2. UK
            11.2.1.3. France
            11.2.1.4. Spain
            11.2.1.5. Italy
            11.2.1.6. Rest of Western Europe
        11.2.2. By Type
        11.2.3. By Voltage
        11.2.4. By Output Power
    11.3. Market Attractiveness Analysis
        11.3.1. By Country
        11.3.2. By Type
        11.3.3. By Voltage
        11.3.4. By Output Power
    11.4. Key Takeaways
12. Eastern Europe Market Analysis 2019 to 2023 and Forecast 2024 to 2034, By Country
    12.1. Historical Market Size Value (US$ Million) & Volume (Units) Trend Analysis By Market Taxonomy, 2019 to 2023
    12.2. Market Size Value (US$ Million) & Volume (Units) Forecast By Market Taxonomy, 2024 to 2034
        12.2.1. By Country
            12.2.1.1. Poland
            12.2.1.2. Russia
            12.2.1.3. Czech Republic
            12.2.1.4. Romania
            12.2.1.5. Rest of Eastern Europe
        12.2.2. By Type
        12.2.3. By Voltage
        12.2.4. By Output Power
    12.3. Market Attractiveness Analysis
        12.3.1. By Country
        12.3.2. By Type
        12.3.3. By Voltage
        12.3.4. By Output Power
    12.4. Key Takeaways
13. South Asia and Pacific Market Analysis 2019 to 2023 and Forecast 2024 to 2034, By Country
    13.1. Historical Market Size Value (US$ Million) & Volume (Units) Trend Analysis By Market Taxonomy, 2019 to 2023
    13.2. Market Size Value (US$ Million) & Volume (Units) Forecast By Market Taxonomy, 2024 to 2034
        13.2.1. By Country
            13.2.1.1. India
            13.2.1.2. Bangladesh
            13.2.1.3. Australia
            13.2.1.4. New Zealand
            13.2.1.5. Rest of South Asia and Pacific
        13.2.2. By Type
        13.2.3. By Voltage
        13.2.4. By Output Power
    13.3. Market Attractiveness Analysis
        13.3.1. By Country
        13.3.2. By Type
        13.3.3. By Voltage
        13.3.4. By Output Power
    13.4. Key Takeaways
14. East Asia Market Analysis 2019 to 2023 and Forecast 2024 to 2034, By Country
    14.1. Historical Market Size Value (US$ Million) & Volume (Units) Trend Analysis By Market Taxonomy, 2019 to 2023
    14.2. Market Size Value (US$ Million) & Volume (Units) Forecast By Market Taxonomy, 2024 to 2034
        14.2.1. By Country
            14.2.1.1. China
            14.2.1.2. Japan
            14.2.1.3. South Korea
        14.2.2. By Type
        14.2.3. By Voltage
        14.2.4. By Output Power
    14.3. Market Attractiveness Analysis
        14.3.1. By Country
        14.3.2. By Type
        14.3.3. By Voltage
        14.3.4. By Output Power
    14.4. Key Takeaways
15. Middle East and Africa Market Analysis 2019 to 2023 and Forecast 2024 to 2034, By Country
    15.1. Historical Market Size Value (US$ Million) & Volume (Units) Trend Analysis By Market Taxonomy, 2019 to 2023
    15.2. Market Size Value (US$ Million) & Volume (Units) Forecast By Market Taxonomy, 2024 to 2034
        15.2.1. By Country
            15.2.1.1. GCC Countries
            15.2.1.2. South Africa
            15.2.1.3. Israel
            15.2.1.4. Rest of MEA
        15.2.2. By Type
        15.2.3. By Voltage
        15.2.4. By Output Power
    15.3. Market Attractiveness Analysis
        15.3.1. By Country
        15.3.2. By Type
        15.3.3. By Voltage
        15.3.4. By Output Power
    15.4. Key Takeaways
16. Key Countries Market Analysis
    16.1. USA
        16.1.1. Pricing Analysis
        16.1.2. Market Share Analysis, 2023
            16.1.2.1. By Type
            16.1.2.2. By Voltage
            16.1.2.3. By Output Power
    16.2. Canada
        16.2.1. Pricing Analysis
        16.2.2. Market Share Analysis, 2023
            16.2.2.1. By Type
            16.2.2.2. By Voltage
            16.2.2.3. By Output Power
    16.3. Brazil
        16.3.1. Pricing Analysis
        16.3.2. Market Share Analysis, 2023
            16.3.2.1. By Type
            16.3.2.2. By Voltage
            16.3.2.3. By Output Power
    16.4. Mexico
        16.4.1. Pricing Analysis
        16.4.2. Market Share Analysis, 2023
            16.4.2.1. By Type
            16.4.2.2. By Voltage
            16.4.2.3. By Output Power
    16.5. Germany
        16.5.1. Pricing Analysis
        16.5.2. Market Share Analysis, 2023
            16.5.2.1. By Type
            16.5.2.2. By Voltage
            16.5.2.3. By Output Power
    16.6. UK
        16.6.1. Pricing Analysis
        16.6.2. Market Share Analysis, 2023
            16.6.2.1. By Type
            16.6.2.2. By Voltage
            16.6.2.3. By Output Power
    16.7. France
        16.7.1. Pricing Analysis
        16.7.2. Market Share Analysis, 2023
            16.7.2.1. By Type
            16.7.2.2. By Voltage
            16.7.2.3. By Output Power
    16.8. Spain
        16.8.1. Pricing Analysis
        16.8.2. Market Share Analysis, 2023
            16.8.2.1. By Type
            16.8.2.2. By Voltage
            16.8.2.3. By Output Power
    16.9. Italy
        16.9.1. Pricing Analysis
        16.9.2. Market Share Analysis, 2023
            16.9.2.1. By Type
            16.9.2.2. By Voltage
            16.9.2.3. By Output Power
    16.10. Poland
        16.10.1. Pricing Analysis
        16.10.2. Market Share Analysis, 2023
            16.10.2.1. By Type
            16.10.2.2. By Voltage
            16.10.2.3. By Output Power
    16.11. Russia
        16.11.1. Pricing Analysis
        16.11.2. Market Share Analysis, 2023
            16.11.2.1. By Type
            16.11.2.2. By Voltage
            16.11.2.3. By Output Power
    16.12. Czech Republic
        16.12.1. Pricing Analysis
        16.12.2. Market Share Analysis, 2023
            16.12.2.1. By Type
            16.12.2.2. By Voltage
            16.12.2.3. By Output Power
    16.13. Romania
        16.13.1. Pricing Analysis
        16.13.2. Market Share Analysis, 2023
            16.13.2.1. By Type
            16.13.2.2. By Voltage
            16.13.2.3. By Output Power
    16.14. India
        16.14.1. Pricing Analysis
        16.14.2. Market Share Analysis, 2023
            16.14.2.1. By Type
            16.14.2.2. By Voltage
            16.14.2.3. By Output Power
    16.15. Bangladesh
        16.15.1. Pricing Analysis
        16.15.2. Market Share Analysis, 2023
            16.15.2.1. By Type
            16.15.2.2. By Voltage
            16.15.2.3. By Output Power
    16.16. Australia
        16.16.1. Pricing Analysis
        16.16.2. Market Share Analysis, 2023
            16.16.2.1. By Type
            16.16.2.2. By Voltage
            16.16.2.3. By Output Power
    16.17. New Zealand
        16.17.1. Pricing Analysis
        16.17.2. Market Share Analysis, 2023
            16.17.2.1. By Type
            16.17.2.2. By Voltage
            16.17.2.3. By Output Power
    16.18. China
        16.18.1. Pricing Analysis
        16.18.2. Market Share Analysis, 2023
            16.18.2.1. By Type
            16.18.2.2. By Voltage
            16.18.2.3. By Output Power
    16.19. Japan
        16.19.1. Pricing Analysis
        16.19.2. Market Share Analysis, 2023
            16.19.2.1. By Type
            16.19.2.2. By Voltage
            16.19.2.3. By Output Power
    16.20. South Korea
        16.20.1. Pricing Analysis
        16.20.2. Market Share Analysis, 2023
            16.20.2.1. By Type
            16.20.2.2. By Voltage
            16.20.2.3. By Output Power
    16.21. GCC Countries
        16.21.1. Pricing Analysis
        16.21.2. Market Share Analysis, 2023
            16.21.2.1. By Type
            16.21.2.2. By Voltage
            16.21.2.3. By Output Power
    16.22. South Africa
        16.22.1. Pricing Analysis
        16.22.2. Market Share Analysis, 2023
            16.22.2.1. By Type
            16.22.2.2. By Voltage
            16.22.2.3. By Output Power
    16.23. Israel
        16.23.1. Pricing Analysis
        16.23.2. Market Share Analysis, 2023
            16.23.2.1. By Type
            16.23.2.2. By Voltage
            16.23.2.3. By Output Power
17. Market Structure Analysis
    17.1. Competition Dashboard
    17.2. Competition Benchmarking
    17.3. Market Share Analysis of Top Players
        17.3.1. By Regional
        17.3.2. By Type
        17.3.3. By Voltage
        17.3.4. By Output Power
18. Competition Analysis
    18.1. Competition Deep Dive
        18.1.1. ABB Ltd.
            18.1.1.1. Overview
            18.1.1.2. Product Portfolio
            18.1.1.3. Profitability by Market Segments
            18.1.1.4. Sales Footprint
            18.1.1.5. Strategy Overview
                18.1.1.5.1. Marketing Strategy
                18.1.1.5.2. Product Strategy
                18.1.1.5.3. Channel Strategy
        18.1.2. Arc Systems Inc.
            18.1.2.1. Overview
            18.1.2.2. Product Portfolio
            18.1.2.3. Profitability by Market Segments
            18.1.2.4. Sales Footprint
            18.1.2.5. Strategy Overview
                18.1.2.5.1. Marketing Strategy
                18.1.2.5.2. Product Strategy
                18.1.2.5.3. Channel Strategy
        18.1.3. Franklin Electric Co. Inc.
            18.1.3.1. Overview
            18.1.3.2. Product Portfolio
            18.1.3.3. Profitability by Market Segments
            18.1.3.4. Sales Footprint
            18.1.3.5. Strategy Overview
                18.1.3.5.1. Marketing Strategy
                18.1.3.5.2. Product Strategy
                18.1.3.5.3. Channel Strategy
        18.1.4. General Electric Co.
            18.1.4.1. Overview
            18.1.4.2. Product Portfolio
            18.1.4.3. Profitability by Market Segments
            18.1.4.4. Sales Footprint
            18.1.4.5. Strategy Overview
                18.1.4.5.1. Marketing Strategy
                18.1.4.5.2. Product Strategy
                18.1.4.5.3. Channel Strategy
        18.1.5. Hitachi Ltd.
            18.1.5.1. Overview
            18.1.5.2. Product Portfolio
            18.1.5.3. Profitability by Market Segments
            18.1.5.4. Sales Footprint
            18.1.5.5. Strategy Overview
                18.1.5.5.1. Marketing Strategy
                18.1.5.5.2. Product Strategy
                18.1.5.5.3. Channel Strategy
        18.1.6. Hoyer Motors
            18.1.6.1. Overview
            18.1.6.2. Product Portfolio
            18.1.6.3. Profitability by Market Segments
            18.1.6.4. Sales Footprint
            18.1.6.5. Strategy Overview
                18.1.6.5.1. Marketing Strategy
                18.1.6.5.2. Product Strategy
                18.1.6.5.3. Channel Strategy
        18.1.7. Nidec Corp.
            18.1.7.1. Overview
            18.1.7.2. Product Portfolio
            18.1.7.3. Profitability by Market Segments
            18.1.7.4. Sales Footprint
            18.1.7.5. Strategy Overview
                18.1.7.5.1. Marketing Strategy
                18.1.7.5.2. Product Strategy
                18.1.7.5.3. Channel Strategy
        18.1.8. NOV Inc.
            18.1.8.1. Overview
            18.1.8.2. Product Portfolio
            18.1.8.3. Profitability by Market Segments
            18.1.8.4. Sales Footprint
            18.1.8.5. Strategy Overview
                18.1.8.5.1. Marketing Strategy
                18.1.8.5.2. Product Strategy
                18.1.8.5.3. Channel Strategy
        18.1.9. Parker Hannifin Corp.
            18.1.9.1. Overview
            18.1.9.2. Product Portfolio
            18.1.9.3. Profitability by Market Segments
            18.1.9.4. Sales Footprint
            18.1.9.5. Strategy Overview
                18.1.9.5.1. Marketing Strategy
                18.1.9.5.2. Product Strategy
                18.1.9.5.3. Channel Strategy
        18.1.10. Regal Rexnord Corp.
            18.1.10.1. Overview
            18.1.10.2. Product Portfolio
            18.1.10.3. Profitability by Market Segments
            18.1.10.4. Sales Footprint
            18.1.10.5. Strategy Overview
                18.1.10.5.1. Marketing Strategy
                18.1.10.5.2. Product Strategy
                18.1.10.5.3. Channel Strategy
        18.1.11. Rockwell Automation Inc.
            18.1.11.1. Overview
            18.1.11.2. Product Portfolio
            18.1.11.3. Profitability by Market Segments
            18.1.11.4. Sales Footprint
            18.1.11.5. Strategy Overview
                18.1.11.5.1. Marketing Strategy
                18.1.11.5.2. Product Strategy
                18.1.11.5.3. Channel Strategy
        18.1.12. Schlumberger Ltd.
            18.1.12.1. Overview
            18.1.12.2. Product Portfolio
            18.1.12.3. Profitability by Market Segments
            18.1.12.4. Sales Footprint
            18.1.12.5. Strategy Overview
                18.1.12.5.1. Marketing Strategy
                18.1.12.5.2. Product Strategy
                18.1.12.5.3. Channel Strategy
        18.1.13. Siemens AG
            18.1.13.1. Overview
            18.1.13.2. Product Portfolio
            18.1.13.3. Profitability by Market Segments
            18.1.13.4. Sales Footprint
            18.1.13.5. Strategy Overview
                18.1.13.5.1. Marketing Strategy
                18.1.13.5.2. Product Strategy
                18.1.13.5.3. Channel Strategy
        18.1.14. TECO-Westinghouse
            18.1.14.1. Overview
            18.1.14.2. Product Portfolio
            18.1.14.3. Profitability by Market Segments
            18.1.14.4. Sales Footprint
            18.1.14.5. Strategy Overview
                18.1.14.5.1. Marketing Strategy
                18.1.14.5.2. Product Strategy
                18.1.14.5.3. Channel Strategy
        18.1.15. Toshiba Corp.
            18.1.15.1. Overview
            18.1.15.2. Product Portfolio
            18.1.15.3. Profitability by Market Segments
            18.1.15.4. Sales Footprint
            18.1.15.5. Strategy Overview
                18.1.15.5.1. Marketing Strategy
                18.1.15.5.2. Product Strategy
                18.1.15.5.3. Channel Strategy
19. Assumptions & Acronyms Used
20. Research Methodology

Explore Technology Insights

View Reports
Future Market Insights

AC Electric Motor Market

Schedule a Call