Activated Cake Emulsifier Market Size and Share Forecast Outlook 2025 to 2035

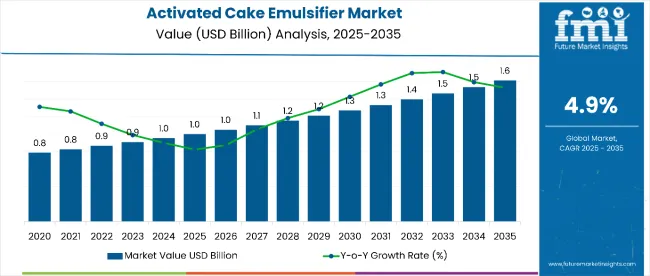
The activated cake emulsifier market is estimated to be valued at USD 1 billion in 2025 and is projected to reach USD 1.6 billion by 2035, registering a compound annual growth rate (CAGR) of 4.9% over the forecast period. This expansion will generate an incremental opportunity of USD 600 million, marking a 1.6x increase over the decade.
Quick Stats for Activated Cake Emulsifier Market

  • Activated Cake Emulsifier Market Value (2025): USD 1 billion
  • Activated Cake Emulsifier Market Forecast Value (2035): USD 1.6 billion
  • Activated Cake Emulsifier Market Forecast CAGR (2025 to 2035): 4.9%
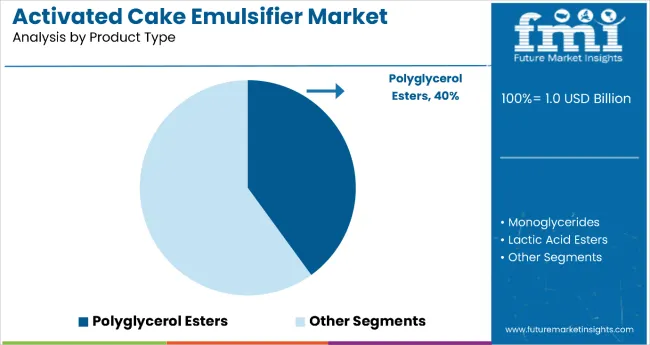
  • Leading Product Type Segment in Activated Cake Emulsifier Market in 2025: Polyglycerol Esters (40% market share)
  • Key Growth Regions in Activated Cake Emulsifier Market: Europe, North America, East Asia
  • Top Key Players in Activated Cake Emulsifier Market: Palsgaard SA, PentaCake, BASF SE, United Food Industries, SensoryEffects, Wacker Chemie AG, Masson Group Company Limited, Corbion N.V., Rich Products Corporation, The Bakels Group, Molkerei MEGGLE Wasserburg GmbH & Co.KG, Ingredion Inc., Guangzhou Kegu Food, FrieslandCampina Kievit, Danisco A/S

Activated Cake Emulsifier Market

Metric Value
Estimated Size (2025E) USD 1 billion
Projected Value (2035F) USD 1.6 billion
CAGR (2025 to 2035) 4.9%

Growth is expected to be underpinned by expanding usage in premium bakery formulations, improved whipping properties, and rising preference for natural and clean-label ingredients in baked goods.

By 2030, the activated cake emulsifier market is projected to reach around USD 1.35 billion, indicating a gain of approximately USD 350 million during the first half of the forecast period. The subsequent five years (2030 to 2035) are projected to contribute an additional USD 250 million, indicating an accelerated, back‑loaded growth trajectory during the latter half of the decade.

Companies such as Palsgaard A/S, Corbion N.V., and Kerry Group plc are intensifying investments in non-GMO, plant-based emulsifier innovations to meet the rising demand for functional cake ingredients. Strategic collaborations with regional bakery chains and introduction of enzyme-activated emulsifier blends are enabling these firms to scale efficiently. Performance will remain tied to shelf-life extension, foam stability, and texture uniformity in industrial and artisanal baking applications.

The activated cake emulsifier market represents a niche yet essential subset within its broader parent markets. It accounts for approximately 6.5% of the global bakery ingredients market, 4.2% of the emulsifiers market, and around 3.8% of the overall food additives sector.

Within the cake ingredients segment, its share rises to about 9.1%, given its specialized application in improving cake texture, volume, and shelf life. Owing to rising demand for clean-label and high-performance bakery products, the share of activated cake emulsifiers is expected to grow across all parent categories between 2025 and 2035.

Over the past two years, the activated cake emulsifier market has been influenced by rising demand for bakery mixes with extended shelf life, consumer shifts toward gluten-free and allergen-free formulations, and the push for palm oil-free solutions. Innovations are being observed in enzyme-activated emulsifier platforms and fat-replacement blends with enhanced foam stability. Regulatory clarity in Europe and cleaner ingredient declarations in North America are further propelling demand.

Analyzing Activated Cake Emulsifier Market by Top Investment Segments

The market is segmented by product type, form, source, application, and region. By product type, the market is divided into polyglycerol esters, monoglycerides, lactic acid esters, polysorbates, and others (citrate esters, acetylated monoglycerides, and blended systems). Based on form, the market is classified into powder, paste, and liquids.

In terms of source, the market is bifurcated into dairy and non-dairy. By application, the market is characterized into pound cake, butter cake, sponge cake, dorayaki (bean-jam pancakes), castella and others (frozen desserts and microwaveable products). Regionally, the market is segmented into North America, Latin America, Europe, East Asia, South Asia, Oceania, the Middle East & Africa.
By Product Type, the Polyglycerol Esters Segment Accounts for 40% of the Market Share

Activated Cake Emulsifier Market By Product Type

The polyglycerol esters segment leads the product type category with a 40% market share in 2025. These emulsifiers are favored for their superior aeration, stability, and emulsifying efficiency in cake batter systems. Their multifunctionality allows for enhanced crumb structure, increased volume, and better moisture retention across a variety of cake formulations, particularly in high-fat and low-fat bakery recipes.

Polyglycerol esters have gained momentum due to their clean-label acceptance and ability to meet both industrial and artisanal production needs. Manufacturers are leveraging these ingredients to formulate vegan and allergen-free cakes while maintaining softness and texture consistency.

Growing demand for emulsifiers that improve shelf life without altering flavor profiles has also supported the expanded use of polyglycerol esters. Regulatory recognition as safe and widespread availability across developed markets have further cemented their dominance in the emulsifier landscape.
By Form, Powder Segment Accounts for 55% of the Market Share

Activated Cake Emulsifier Market By Form

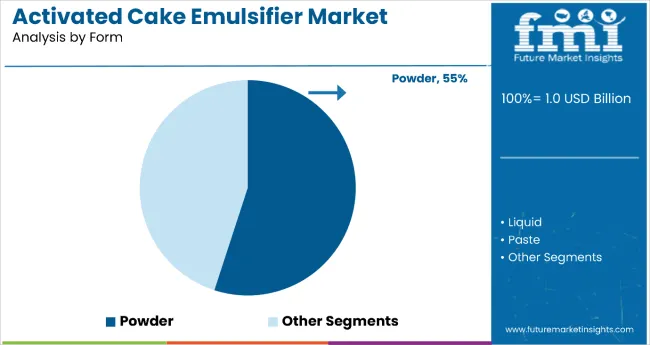
The powder form holds the largest share in the form segment, accounting for 55% of the activated cake emulsifier market share in 2025. Its dominance is attributed to exceptional shelf stability, ease of handling in automated bakery processes, and better compatibility with dry mixes. Powdered emulsifiers offer consistent dispersion in batters and facilitate accurate dosing, which is crucial for maintaining texture, volume, and mouthfeel in cakes.

The segment’s expansion has been supported by technological advancements in spray-drying and microencapsulation, allowing for the development of highly soluble, dust-free, and pre-activated powdered emulsifiers. These improvements have enabled their integration into clean-label and organic cake formulations, further increasing appeal among health-conscious and premium product consumers.

Given their reduced transportation weight and longer shelf life, powdered emulsifiers are well-suited for both large-scale industrial production and long-distance export, securing their position as the most preferred form in the market.

Why is the Activated Cake Emulsifier Market Growing?

Activated cake emulsifiers’ ability to enhance batter stability, improve texture, and extend the shelf life of bakery products make them a preferred choice for industrial and artisanal bakers seeking consistent, high-quality outcomes.

Growing demand for convenient, ready-to-eat, and premium baked goods is driving adoption across bread, cakes, muffins, and pastry segments. Technological advancements in emulsification processes, along with clean-label and allergen-free innovations, are expanding product applications and meeting evolving consumer preferences.

As bakery manufacturers increasingly focus on production efficiency, reduced waste, and product consistency, the market outlook remains positive. With strong potential in both large-scale manufacturing and small-scale bakery operations, activated cake emulsifiers are poised for significant growth across global bakery and confectionery industries.

What are the Drivers, Restraints, and Key Trends of the Activated Cake Emulsifier Market?

In 2024, global demand for activated cake emulsifiers rose steadily, with Europe and Asia-Pacific accounting for over 60% of total consumption. Their primary applications lie in volume enhancement, crumb softening, and shelf-life extension in cakes and sponge-based bakery products. Manufacturers have increasingly adopted enzyme-activated and plant-based emulsifier systems to comply with clean-label trends and allergen-free regulations.

These systems improve batter aeration, provide uniform cell structure, and offer consistency across high-speed production lines. As consumer demand rises for premium-quality baked goods with fewer synthetic additives, activated emulsifiers are being positioned as essential functional ingredients.

Health-Driven Reformulation and Clean-Label Baking Fuel Market Expansion

The push toward trans-fat elimination, palm-free labeling, and reduction of chemical additives in packaged food is driving growth in the activated cake emulsifier market. Food brands are incorporating powdered emulsifier blends that meet clean-label criteria while delivering functional benefits like prolonged softness and moisture retention.

A shift in consumer preference toward natural-origin bakery ingredients is pushing adoption of emulsifiers derived from sunflower lecithin, polyglycerol esters, and mono- and diglycerides sourced from non-GMO oils. These trends are encouraging bakery manufacturers to reformulate products without compromising sensory quality, especially in gluten-free and low-fat cakes.

Processing Limitations and Cost Pressures Restrain Growth

Despite growing demand, market expansion is challenged by cost volatility in raw materials like vegetable oils and food-grade esters. Complex activation processes involving spray drying and enzymatic treatment increase production costs and lengthen formulation timelines.

Small-to-mid-scale bakeries often lack the infrastructure for integrating pre-activated emulsifier systems, reducing adoption. Additionally, labeling ambiguities across regions, particularly in Asia and Latin America, complicate marketing for clean-label claims, restraining growth in certain consumer segments.
Activated Cake Emulsifier Market Analysis by Top Countries

Activated Cake Emulsifier Market Country Wise Analysis

Country CAGR (2025 to 2035)
USA 5.5%
UK 5.2%
Germany 5.1%
France 5.0%
Japan 4.8%

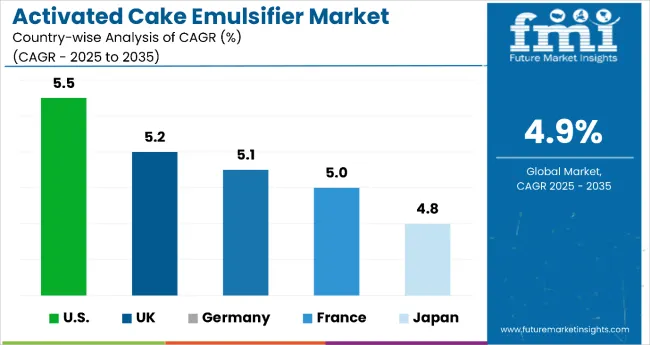
Between 2025 and 2035, the activated cake emulsifier market is set to expand steadily across key global economies. The USA is forecasted to lead with a CAGR of 5.5%, followed closely by the UK at 5.2%, Germany at 5.1%, and France at 5.0%. Japan, while slightly behind at 4.8%, continues to demonstrate healthy growth.

These trends reflect increased investment in clean-label baking, growing consumer demand for longer shelf-life products, and regional shifts toward plant-based emulsification technologies. Market maturity, regulatory stringency, and industrial baking infrastructure influence these varying growth rates.

The report covers an in-depth analysis of 40+ countries; five top-performing OECD countries are highlighted below.
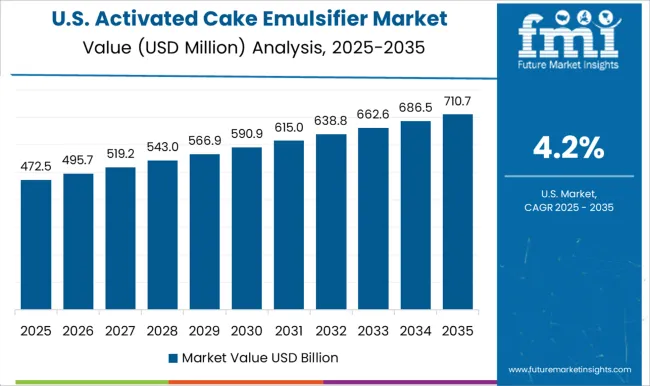
Market Growth in Activated Cake Emulsifier Market in the United States

The activated cake emulsifier market in the USA is projected to expand at a CAGR of 5.5% from 2025 to 2035. Growth is driven by the robust expansion of in-store bakery formats and the demand for shelf-stable, clean-label cakes in states such as California, Texas, and Illinois.

USA food processors are adopting powdered emulsifier blends that offer extended softness and moisture retention in finished products. Regulatory clarity and investments in enzymatic activation technologies are improving formulation efficiency and shelf-life performance in industrial bakeries.

Key Statistics:

  • Powdered emulsifiers hold a 62% share in commercial USA bakery applications (2025)
  • Over 70 clean-label emulsifier SKUs launched in USA supermarkets in 2024
  • USD 312 million invested in bakery R&D focusing on emulsification systems in 2024

Market Expansion in Activated Cake Emulsifier Market in the United Kingdom

The revenue from activated cake emulsifier in the UK is expected to grow at a CAGR of 5.2% from 2025 to 2035. This growth is led by demand for natural-origin emulsifiers in premium cakes, supported by retailers in London, Birmingham, and Manchester.

Brexit-led import challenges have prompted a shift toward domestic formulation and enzyme activation technologies. Consumers are increasingly drawn to trans-fat-free and palm-free baked products, which is pushing bakery producers to adopt functional, powdered emulsifier blends.

Key Statistics:
  • 54% of UK emulsifier usage directed toward premium cake formulations
  • 2.1 million kg of clean-label emulsifiers consumed in 2024
  • £128 million invested in bakery modernization programs in 2024

Innovation Leadership in Activated Cake Emulsifier Market in Germany

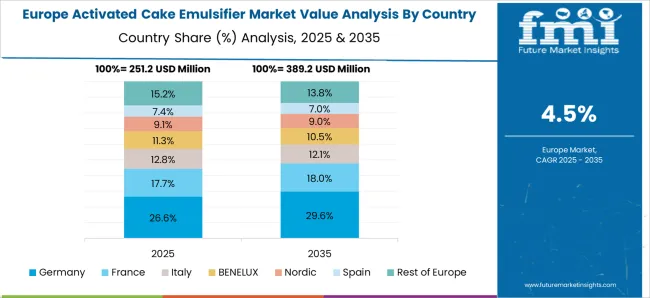
The sales of activated cake emulsifier in Germany are estimated to flourish at a CAGR of 5.1% between 2025 and 2035. German bakeries prioritize quality enhancement and product differentiation, particularly in regions like Bavaria and North Rhine-Westphalia. Strong partnerships between food tech firms and bakery cooperatives have driven innovation in emulsifier solutions that comply with EU clean-label mandates. The integration of powdered emulsifiers in hybrid and vegan baked goods has also intensified.

Key Statistics:

  • 78% of emulsifiers used in Germany meet EU clean-label standards
  • 34 R&D pilot lines dedicated to emulsifier testing in 2024
  • 93% of industrial cakes in Germany use powder-based emulsifiers

Market Development in Activated Cake Emulsifier Market in France

The demand for activated cake emulsifier in France is forecasted to rise at a CAGR of 5.0% from 2025 to 2035. Growth is supported by the artisanal bakery renaissance and rising demand for vegan pâtisserie and gluten-free cakes in Paris, Lyon, and Marseille. French bakeries are integrating polyglycerol esters and lactic acid esters into cake formulations to enhance softness and shelf life. Domestic ingredient manufacturers are scaling up pre-activated blends with reduced allergen load, tailored to French nutritional labeling norms.

Key Statistics:

  • 41% of cake emulsifiers in France derived from non-GMO sources in 2025
  • €174 million in domestic emulsifier production recorded in 2024
  • 29 collaborative research programs launched in bakery emulsification

Activated Cake Emulsifier Market Outlook in Japan

The activated cake emulsifier market in Japan is projected to strengthen at a CAGR of 4.8% from 2025 to 2035. Urban consumers in Tokyo, Osaka, and Fukuoka are driving demand for cleaner, lower-fat, and longer-lasting bakery products. Japanese baking manufacturers are adopting microencapsulated powdered emulsifiers that deliver consistent aeration and superior moisture control. A rising elderly population is also creating opportunities for softer, easily digestible sponge cakes, further boosting demand.

Key Statistics:
  • 65% of bakery producers in Japan use enzyme-activated emulsifiers as of 2024
  • USD 196 million projected revenue from non-dairy emulsifier applications in 2025
  • 27% increase in cake exports using clean-label emulsifiers recorded in 2024

Competitive Landscape of the Activated Cake Emulsifier Market

Activated Cake Emulsifier Market Analysis By Company

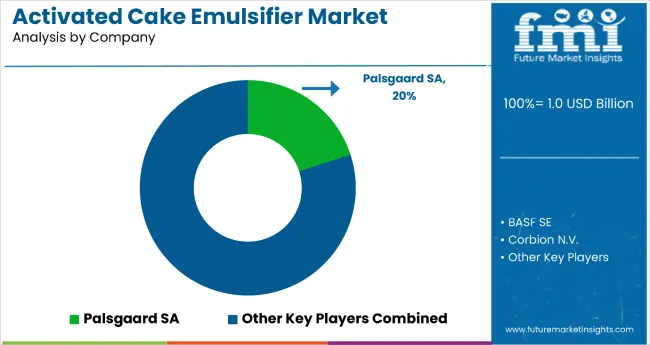
The activated cake emulsifier market is moderately consolidated, with key players ranging from global chemical and ingredient manufacturers to specialized emulsifier producers. Leading companies such as Palsgaard A/S, Corbion N.V., and Kerry Group plc dominate the market by leveraging advanced emulsification technologies and robust global supply chains.

Their strengths lie in extensive research and development capabilities, allowing them to innovate enzyme-activated emulsifiers that enhance cake volume, texture, and shelf life while meeting clean-label and non-GMO demands. These companies maintain strong partnerships with major bakery ingredient suppliers and benefit from broad distribution networks across North America, Europe, and Asia-Pacific.

Specialized players including Riken Vitamin Co. Ltd. and Danisco A/S differentiate themselves through tailored product portfolios focused on niche applications such as vegan and allergen-free bakery products. These firms invest in proprietary spray-drying and microencapsulation processes to improve powder solubility and functional performance.

Regional manufacturers in Europe and Asia also contribute by adapting formulations to local consumer preferences and regulatory frameworks, especially in markets with stringent clean-label and sustainability requirements.

High entry barriers persist in the activated cake emulsifier space due to the complexity of enzymatic activation, the need for food safety compliance, and significant capital investment in production infrastructure. Competitive advantage increasingly depends on technological innovation, regulatory adherence, and ability to deliver customized emulsifier blends that cater to evolving bakery trends such as gluten-free, organic, and plant-based products. Sustainability and clean-label credentials are becoming critical factors influencing market competitiveness and long-term growth potential.

Scope of Report

Item Value
Quantitative Units USD 1 Billion (Estimated Market Size in 2025)
Product Type Polyglycerol Esters, Monoglycerides, Lactic Acid Esters, Polysorbates, Others
Application Pound Cake, Butter Cake, Sponge Cake, Dorayaki (Bean-Jam Pancakes), Castella, Others
Source Dairy, Non-Dairy
Form Powder, Liquid, Paste
Regions Covered North America, Latin America, Europe, East Asia, South Asia, Oceania, Middle East & Africa
Countries Covered United States, United Kingdom, Germany, France, Japan, China, Canada, Australia, Brazil, South Korea and 40+ countries
Key Companies Profiled Palsgaard SA, PentaCake, BASF SE, United Food Industries, SensoryEffects, Wacker Chemie AG, Masson Group Company Limited, Corbion N.V., Rich Products Corporation, The Bakels Group, Molkerei MEGGLE Wasserburg GmbH & Co.KG, Ingredion Inc., Guangzhou Kegu Food, FrieslandCampina Kievit, Danisco A/S
Additional Attributes Market size by product type and form, regional consumption patterns, regulatory framework overview, technological advancements in enzyme activation, sustainability practices in ingredient sourcing, innovations in powder formulation, competitive landscape analysis, and clean-label trends impacting product development

Activated Cake Emulsifier Market by Category

By Product Type:

  • Polyglycerol Esters
  • Monoglycerides
  • Lactic Acid Esters
  • Polysorbates
  • Others

By Source:

  • Dairy
  • Non-Dairy

By Form:

  • Liquid
  • Powder
  • Paste

By Application:

  • Pound Cake
  • Butter Cake
  • Sponge Cake
  • Dorayaki (Bean-Jam Pancakes)
  • Castella
  • Others

By Region:

  • North America
  • Latin America
  • Western Europe
  • Eastern Europe
  • East Asia
  • South Asia & Pacific
  • Middle East and Africa

Table of Content

  1. Executive Summary
    • Global Market Outlook
    • Demand-side Trends
    • Supply-side Trends
    • Technology Roadmap Analysis
    • Analysis and Recommendations
  2. Market Overview
    • Market Coverage / Taxonomy
    • Market Definition / Scope / Limitations
  3. Market Background
    • Market Dynamics
      • Drivers
      • Restraints
      • Opportunity
      • Trends
    • Scenario Forecast
      • Demand in Optimistic Scenario
      • Demand in Likely Scenario
      • Demand in Conservative Scenario
    • Opportunity Map Analysis
    • Product Life Cycle Analysis
    • Supply Chain Analysis
      • Supply Side Participants and their Roles
        • Producers
        • Mid-Level Participants (Traders/ Agents/ Brokers)
        • Wholesalers and Distributors
      • Value Added and Value Created at Node in the Supply Chain
      • List of Raw Material Suppliers
      • List of Existing and Potential Buyer’s
    • Investment Feasibility Matrix
    • Value Chain Analysis
      • Profit Margin Analysis
      • Wholesalers and Distributors
      • Retailers
    • PESTLE and Porter’s Analysis
    • Regulatory Landscape
      • By Key Regions
      • By Key Countries
    • Regional Parent Market Outlook
    • Production and Consumption Statistics
    • Import and Export Statistics
  4. Global Market Analysis 2020 to 2024 and Forecast, 2025 to 2035
    • Historical Market Size Value (USD Billion) & Volume (Metric Tons) Analysis, 2020 to 2024
    • Current and Future Market Size Value (USD Billion) & Volume (Metric Tons) Projections, 2025 to 2035
      • Y-o-Y Growth Trend Analysis
      • Absolute $ Opportunity Analysis
  5. Global Market Pricing Analysis 2020 to 2024 and Forecast 2025 to 2035
  6. Global Market Analysis 2020 to 2024 and Forecast 2025 to 2035, By Product Type
    • Introduction / Key Findings
    • Historical Market Size Value (USD Billion) & Volume (Metric Tons) Analysis By Product Type, 2020 to 2024
    • Current and Future Market Size Value (USD Billion) & Volume (Metric Tons) Analysis and Forecast By Product Type, 2025 to 2035
      • Polyglycerol Esters
      • Monoglycerides
      • Lactic Acid Esters
      • Polysorbates
      • Others
    • Y-o-Y Growth Trend Analysis By Product Type, 2020 to 2024
    • Absolute $ Opportunity Analysis By Product Type, 2025 to 2035
  7. Global Market Analysis 2020 to 2024 and Forecast 2025 to 2035, By Source
    • Introduction / Key Findings
    • Historical Market Size Value (USD Billion) & Volume (Metric Tons) Analysis By Source, 2020 to 2024
    • Current and Future Market Size Value (USD Billion) & Volume (Metric Tons) Analysis and Forecast By Source, 2025 to 2035
      • Dairy
      • Non-Dairy
    • Y-o-Y Growth Trend Analysis By Source, 2020 to 2024
    • Absolute $ Opportunity Analysis By Source, 2025 to 2035
  8. Global Market Analysis 2020 to 2024 and Forecast 2025 to 2035, By Form
    • Introduction / Key Findings
    • Historical Market Size Value (USD Billion) & Volume (Metric Tons) Analysis By Form, 2020 to 2024
    • Current and Future Market Size Value (USD Billion) & Volume (Metric Tons) Analysis and Forecast By Form, 2025 to 2035
      • Liquid
      • Powder
      • Paste
    • Y-o-Y Growth Trend Analysis By Form, 2020 to 2024
    • Absolute $ Opportunity Analysis By Form, 2025 to 2035
  9. Global Market Analysis 2020 to 2024 and Forecast 2025 to 2035, By Application
    • Introduction / Key Findings
    • Historical Market Size Value (USD Billion) & Volume (Metric Tons) Analysis By Application, 2020 to 2024
    • Current and Future Market Size Value (USD Billion) & Volume (Metric Tons) Analysis and Forecast By Application, 2025 to 2035
      • Pound Cake
      • Butter Cake
      • Sponge Cake
      • Dorayaki (Bean-Jam Pancakes)
      • Castella
      • Others
    • Y-o-Y Growth Trend Analysis By Application, 2020 to 2024
    • Absolute $ Opportunity Analysis By Application, 2025 to 2035
  10. Global Market Analysis 2020 to 2024 and Forecast 2025 to 2035, By Region
    • Introduction
    • Historical Market Size Value (USD Billion) & Volume (Metric Tons) Analysis By Region, 2020 to 2024
    • Current Market Size Value (USD Billion) & Volume (Metric Tons) Analysis and Forecast By Region, 2025 to 2035
      • North America
      • Latin America
      • Western Europe
      • Eastern Europe
      • East Asia
      • South Asia & Pacific
      • Middle East and Africa
    • Market Attractiveness Analysis By Region
  11. North America Market Analysis 2020 to 2024 and Forecast 2025 to 2035, By Country
    • Historical Market Size Value (USD Billion) & Volume (Metric Tons) Trend Analysis By Market Taxonomy, 2020 to 2024
    • Market Size Value (USD Billion) & Volume (Metric Tons) Forecast By Market Taxonomy, 2025 to 2035
      • By Country
        • USA
        • Canada
        • Mexico
      • By Product Type
      • By Source
      • By Form
      • By Application
    • Market Attractiveness Analysis
      • By Country
      • By Product Type
      • By Source
      • By Form
      • By Application
    • Key Takeaways
  12. Latin America Market Analysis 2020 to 2024 and Forecast 2025 to 2035, By Country
    • Historical Market Size Value (USD Billion) & Volume (Metric Tons) Trend Analysis By Market Taxonomy, 2020 to 2024
    • Market Size Value (USD Billion) & Volume (Metric Tons) Forecast By Market Taxonomy, 2025 to 2035
      • By Country
        • Brazil
        • Argentina
        • Rest of LATAM
      • By Product Type
      • By Source
      • By Form
      • By Application
    • Market Attractiveness Analysis
      • By Country
      • By Product Type
      • By Source
      • By Form
      • By Application
    • Key Takeaways
  13. Western Europe Market Analysis 2020 to 2024 and Forecast 2025 to 2035, By Country
    • Historical Market Size Value (USD Billion) & Volume (Metric Tons) Trend Analysis By Market Taxonomy, 2020 to 2024
    • Market Size Value (USD Billion) & Volume (Metric Tons) Forecast By Market Taxonomy, 2025 to 2035
      • By Country
        • Germany
        • Italy
        • France
        • UK
        • Spain
        • BENELUX
        • Nordic
        • Rest of W.Europe
      • By Product Type
      • By Source
      • By Form
      • By Application
    • Market Attractiveness Analysis
      • By Country
      • By Product Type
      • By Source
      • By Form
      • By Application
    • Key Takeaways
  14. Eastern Europe Market Analysis 2020 to 2024 and Forecast 2025 to 2035, By Country
    • Historical Market Size Value (USD Billion) & Volume (Metric Tons) Trend Analysis By Market Taxonomy, 2020 to 2024
    • Market Size Value (USD Billion) & Volume (Metric Tons) Forecast By Market Taxonomy, 2025 to 2035
      • By Country
        • Russia
        • Hungary
        • Poland
        • Balkan & Baltics
        • Rest of E. Europe
      • By Product Type
      • By Source
      • By Form
      • By Application
    • Market Attractiveness Analysis
      • By Country
      • By Product Type
      • By Source
      • By Form
      • By Application
    • Key Takeaways
  15. East Asia Market Analysis 2020 to 2024 and Forecast 2025 to 2035, By Country
    • Historical Market Size Value (USD Billion) & Volume (Metric Tons) Trend Analysis By Market Taxonomy, 2020 to 2024
    • Market Size Value (USD Billion) & Volume (Metric Tons) Forecast By Market Taxonomy, 2025 to 2035
      • By Country
        • China
        • Japan
        • South Korea
      • By Product Type
      • By Source
      • By Form
      • By Application
    • Market Attractiveness Analysis
      • By Country
      • By Product Type
      • By Source
      • By Form
      • By Application
    • Key Takeaways
  16. South Asia & Pacific Market Analysis 2020 to 2024 and Forecast 2025 to 2035, By Country
    • Historical Market Size Value (USD Billion) & Volume (Metric Tons) Trend Analysis By Market Taxonomy, 2020 to 2024
    • Market Size Value (USD Billion) & Volume (Metric Tons) Forecast By Market Taxonomy, 2025 to 2035
      • By Country
        • India
        • Australia & New Zealand
        • ASEAN
        • Rest of SAP
      • By Product Type
      • By Source
      • By Form
      • By Application
    • Market Attractiveness Analysis
      • By Country
      • By Product Type
      • By Source
      • By Form
      • By Application
    • Key Takeaways
  17. Middle East and Africa Market Analysis 2020 to 2024 and Forecast 2025 to 2035, By Country
    • Historical Market Size Value (USD Billion) & Volume (Metric Tons) Trend Analysis By Market Taxonomy, 2020 to 2024
    • Market Size Value (USD Billion) & Volume (Metric Tons) Forecast By Market Taxonomy, 2025 to 2035
      • By Country
        • GCC Countries
        • Northern Africa
        • South Africa
        • Turkiye
        • Rest of MEA
      • By Product Type
      • By Source
      • By Form
      • By Application
    • Market Attractiveness Analysis
      • By Country
      • By Product Type
      • By Source
      • By Form
      • By Application
    • Key Takeaways
  18. Key Countries Market Analysis
    • USA
      • Pricing Analysis
      • Market Share Analysis, 2024
        • By Product Type
        • By Source
        • By Form
        • By Application
    • Canada
      • Pricing Analysis
      • Market Share Analysis, 2024
        • By Product Type
        • By Source
        • By Form
        • By Application
    • Brazil
      • Pricing Analysis
      • Market Share Analysis, 2024
        • By Product Type
        • By Source
        • By Form
        • By Application
    • Mexico
      • Pricing Analysis
      • Market Share Analysis, 2024
        • By Product Type
        • By Source
        • By Form
        • By Application
    • Argentina
      • Pricing Analysis
      • Market Share Analysis, 2024
        • By Product Type
        • By Source
        • By Form
        • By Application
  19. Market Structure Analysis
    • Competition Dashboard
    • Competition Benchmarking
    • Market Share Analysis of Top Players
      • By Regional
      • By Product Type
      • By Source
      • By Form
      • By Application
  20. Competition Analysis
    • Competition Deep Dive
      • Palsgaard SA
        • Overview
        • Product Portfolio
        • Profitability by Market Segments (Product/Age /Sales Channel/Region)
        • Sales Footprint
        • Strategy Overview
          • Marketing Strategy
          • Product Strategy
          • Channel Strategy
      • PentaCake
        • Overview
        • Product Portfolio
        • Profitability by Market Segments (Product/Age /Sales Channel/Region)
        • Sales Footprint
        • Strategy Overview
          • Marketing Strategy
          • Product Strategy
          • Channel Strategy
      • BASF SE
        • Overview
        • Product Portfolio
        • Profitability by Market Segments (Product/Age /Sales Channel/Region)
        • Sales Footprint
        • Strategy Overview
          • Marketing Strategy
          • Product Strategy
          • Channel Strategy
      • Danisco A/S
        • Overview
        • Product Portfolio
        • Profitability by Market Segments (Product/Age /Sales Channel/Region)
        • Sales Footprint
        • Strategy Overview
          • Marketing Strategy
          • Product Strategy
          • Channel Strategy
      • SensoryEffects
        • Overview
        • Product Portfolio
        • Profitability by Market Segments (Product/Age /Sales Channel/Region)
        • Sales Footprint
        • Strategy Overview
          • Marketing Strategy
          • Product Strategy
          • Channel Strategy
      • Wacker Chemie AG
        • Overview
        • Product Portfolio
        • Profitability by Market Segments (Product/Age /Sales Channel/Region)
        • Sales Footprint
        • Strategy Overview
          • Marketing Strategy
          • Product Strategy
          • Channel Strategy
      • Masson Group Company Limited
        • Overview
        • Product Portfolio
        • Profitability by Market Segments (Product/Age /Sales Channel/Region)
        • Sales Footprint
        • Strategy Overview
          • Marketing Strategy
          • Product Strategy
          • Channel Strategy
      • Corbion N.V.
        • Overview
        • Product Portfolio
        • Profitability by Market Segments (Product/Age /Sales Channel/Region)
        • Sales Footprint
        • Strategy Overview
          • Marketing Strategy
          • Product Strategy
          • Channel Strategy
      • Rich Products Corporation
        • Overview
        • Product Portfolio
        • Profitability by Market Segments (Product/Age /Sales Channel/Region)
        • Sales Footprint
        • Strategy Overview
          • Marketing Strategy
          • Product Strategy
          • Channel Strategy
      • The Bakels Group
        • Overview
        • Product Portfolio
        • Profitability by Market Segments (Product/Age /Sales Channel/Region)
        • Sales Footprint
        • Strategy Overview
          • Marketing Strategy
          • Product Strategy
          • Channel Strategy
      • Molkerei MEGGLE Wasserburg GmbH & Co.KG
        • Overview
        • Product Portfolio
        • Profitability by Market Segments (Product/Age /Sales Channel/Region)
        • Sales Footprint
        • Strategy Overview
          • Marketing Strategy
          • Product Strategy
          • Channel Strategy
      • Ingredion Inc.
        • Overview
        • Product Portfolio
        • Profitability by Market Segments (Product/Age /Sales Channel/Region)
        • Sales Footprint
        • Strategy Overview
          • Marketing Strategy
          • Product Strategy
          • Channel Strategy
      • Guangzhou Kegu Food
        • Overview
        • Product Portfolio
        • Profitability by Market Segments (Product/Age /Sales Channel/Region)
        • Sales Footprint
        • Strategy Overview
          • Marketing Strategy
          • Product Strategy
          • Channel Strategy
      • FrieslandCampina Kievit
        • Overview
        • Product Portfolio
        • Profitability by Market Segments (Product/Age /Sales Channel/Region)
        • Sales Footprint
        • Strategy Overview
          • Marketing Strategy
          • Product Strategy
          • Channel Strategy
  21. Assumptions & Acronyms Used
  22. Research Methodology

List of Tables

  • Table 1: Global Market Value (USD Billion) Forecast by Region, 2020-2035
  • Table 2: Global Market Volume (Metric Tons) Forecast by Region, 2020-2035
  • Table 3: Global Market Value (USD Billion) Forecast by Product Type, 2020-2035
  • Table 4: Global Market Volume (Metric Tons) Forecast by Product Type, 2020-2035
  • Table 5: Global Market Value (USD Billion) Forecast by Source, 2020-2035
  • Table 6: Global Market Volume (Metric Tons) Forecast by Source, 2020-2035
  • Table 7: Global Market Value (USD Billion) Forecast by Form, 2020-2035
  • Table 8: Global Market Volume (Metric Tons) Forecast by Form, 2020-2035
  • Table 9: Global Market Value (USD Billion) Forecast by Application, 2020-2035
  • Table 10: Global Market Volume (Metric Tons) Forecast by Application, 2020-2035
  • Table 11: North America Market Value (USD Billion) Forecast by Country, 2020-2035
  • Table 12: North America Market Volume (Metric Tons) Forecast by Country, 2020-2035
  • Table 13: North America Market Value (USD Billion) Forecast by Product Type, 2020-2035
  • Table 14: North America Market Volume (Metric Tons) Forecast by Product Type, 2020-2035
  • Table 15: North America Market Value (USD Billion) Forecast by Source, 2020-2035
  • Table 16: North America Market Volume (Metric Tons) Forecast by Source, 2020-2035
  • Table 17: North America Market Value (USD Billion) Forecast by Form, 2020-2035
  • Table 18: North America Market Volume (Metric Tons) Forecast by Form, 2020-2035
  • Table 19: North America Market Value (USD Billion) Forecast by Application, 2020-2035
  • Table 20: North America Market Volume (Metric Tons) Forecast by Application, 2020-2035
  • Table 21: Latin America Market Value (USD Billion) Forecast by Country, 2020-2035
  • Table 22: Latin America Market Volume (Metric Tons) Forecast by Country, 2020-2035
  • Table 23: Latin America Market Value (USD Billion) Forecast by Product Type, 2020-2035
  • Table 24: Latin America Market Volume (Metric Tons) Forecast by Product Type, 2020-2035
  • Table 25: Latin America Market Value (USD Billion) Forecast by Source, 2020-2035
  • Table 26: Latin America Market Volume (Metric Tons) Forecast by Source, 2020-2035
  • Table 27: Latin America Market Value (USD Billion) Forecast by Form, 2020-2035
  • Table 28: Latin America Market Volume (Metric Tons) Forecast by Form, 2020-2035
  • Table 29: Latin America Market Value (USD Billion) Forecast by Application, 2020-2035
  • Table 30: Latin America Market Volume (Metric Tons) Forecast by Application, 2020-2035
  • Table 31: Western Europe Market Value (USD Billion) Forecast by Country, 2020-2035
  • Table 32: Western Europe Market Volume (Metric Tons) Forecast by Country, 2020-2035
  • Table 33: Western Europe Market Value (USD Billion) Forecast by Product Type, 2020-2035
  • Table 34: Western Europe Market Volume (Metric Tons) Forecast by Product Type, 2020-2035
  • Table 35: Western Europe Market Value (USD Billion) Forecast by Source, 2020-2035
  • Table 36: Western Europe Market Volume (Metric Tons) Forecast by Source, 2020-2035
  • Table 37: Western Europe Market Value (USD Billion) Forecast by Form, 2020-2035
  • Table 38: Western Europe Market Volume (Metric Tons) Forecast by Form, 2020-2035
  • Table 39: Western Europe Market Value (USD Billion) Forecast by Application, 2020-2035
  • Table 40: Western Europe Market Volume (Metric Tons) Forecast by Application, 2020-2035
  • Table 41: Eastern Europe Market Value (USD Billion) Forecast by Country, 2020-2035
  • Table 42: Eastern Europe Market Volume (Metric Tons) Forecast by Country, 2020-2035
  • Table 43: Eastern Europe Market Value (USD Billion) Forecast by Product Type, 2020-2035
  • Table 44: Eastern Europe Market Volume (Metric Tons) Forecast by Product Type, 2020-2035
  • Table 45: Eastern Europe Market Value (USD Billion) Forecast by Source, 2020-2035
  • Table 46: Eastern Europe Market Volume (Metric Tons) Forecast by Source, 2020-2035
  • Table 47: Eastern Europe Market Value (USD Billion) Forecast by Form, 2020-2035
  • Table 48: Eastern Europe Market Volume (Metric Tons) Forecast by Form, 2020-2035
  • Table 49: Eastern Europe Market Value (USD Billion) Forecast by Application, 2020-2035
  • Table 50: Eastern Europe Market Volume (Metric Tons) Forecast by Application, 2020-2035
  • Table 51: East Asia Market Value (USD Billion) Forecast by Country, 2020-2035
  • Table 52: East Asia Market Volume (Metric Tons) Forecast by Country, 2020-2035
  • Table 53: East Asia Market Value (USD Billion) Forecast by Product Type, 2020-2035
  • Table 54: East Asia Market Volume (Metric Tons) Forecast by Product Type, 2020-2035
  • Table 55: East Asia Market Value (USD Billion) Forecast by Source, 2020-2035
  • Table 56: East Asia Market Volume (Metric Tons) Forecast by Source, 2020-2035
  • Table 57: East Asia Market Value (USD Billion) Forecast by Form, 2020-2035
  • Table 58: East Asia Market Volume (Metric Tons) Forecast by Form, 2020-2035
  • Table 59: East Asia Market Value (USD Billion) Forecast by Application, 2020-2035
  • Table 60: East Asia Market Volume (Metric Tons) Forecast by Application, 2020-2035
  • Table 61: South Asia & Pacific Market Value (USD Billion) Forecast by Country, 2020-2035
  • Table 62: South Asia & Pacific Market Volume (Metric Tons) Forecast by Country, 2020-2035
  • Table 63: South Asia & Pacific Market Value (USD Billion) Forecast by Product Type, 2020-2035
  • Table 64: South Asia & Pacific Market Volume (Metric Tons) Forecast by Product Type, 2020-2035
  • Table 65: South Asia & Pacific Market Value (USD Billion) Forecast by Source, 2020-2035
  • Table 66: South Asia & Pacific Market Volume (Metric Tons) Forecast by Source, 2020-2035
  • Table 67: South Asia & Pacific Market Value (USD Billion) Forecast by Form, 2020-2035
  • Table 68: South Asia & Pacific Market Volume (Metric Tons) Forecast by Form, 2020-2035
  • Table 69: South Asia & Pacific Market Value (USD Billion) Forecast by Application, 2020-2035
  • Table 70: South Asia & Pacific Market Volume (Metric Tons) Forecast by Application, 2020-2035
  • Table 71: Middle East and Africa Market Value (USD Billion) Forecast by Country, 2020-2035
  • Table 72: Middle East and Africa Market Volume (Metric Tons) Forecast by Country, 2020-2035
  • Table 73: Middle East and Africa Market Value (USD Billion) Forecast by Product Type, 2020-2035
  • Table 74: Middle East and Africa Market Volume (Metric Tons) Forecast by Product Type, 2020-2035
  • Table 75: Middle East and Africa Market Value (USD Billion) Forecast by Source, 2020-2035
  • Table 76: Middle East and Africa Market Volume (Metric Tons) Forecast by Source, 2020-2035
  • Table 77: Middle East and Africa Market Value (USD Billion) Forecast by Form, 2020-2035
  • Table 78: Middle East and Africa Market Volume (Metric Tons) Forecast by Form, 2020-2035
  • Table 79: Middle East and Africa Market Value (USD Billion) Forecast by Application, 2020-2035
  • Table 80: Middle East and Africa Market Volume (Metric Tons) Forecast by Application, 2020-2035

List of Figures

  • Figure 1: Global Market Volume (Metric Tons) Forecast 2020-2035
  • Figure 2: Global Market Pricing Analysis
  • Figure 3: Global Market Value (USD Billion) Forecast 2020-2035
  • Figure 4: Global Market Value Share and BPS Analysis by Product Type, 2025 and 2035
  • Figure 5: Global Market Y-o-Y Growth Comparison by Product Type, 2025-2035
  • Figure 6: Global Market Attractiveness Analysis by Product Type
  • Figure 7: Global Market Value Share and BPS Analysis by Source, 2025 and 2035
  • Figure 8: Global Market Y-o-Y Growth Comparison by Source, 2025-2035
  • Figure 9: Global Market Attractiveness Analysis by Source
  • Figure 10: Global Market Value Share and BPS Analysis by Form, 2025 and 2035
  • Figure 11: Global Market Y-o-Y Growth Comparison by Form, 2025-2035
  • Figure 12: Global Market Attractiveness Analysis by Form
  • Figure 13: Global Market Value Share and BPS Analysis by Application, 2025 and 2035
  • Figure 14: Global Market Y-o-Y Growth Comparison by Application, 2025-2035
  • Figure 15: Global Market Attractiveness Analysis by Application
  • Figure 16: Global Market Value (USD Billion) Share and BPS Analysis by Region, 2025 and 2035
  • Figure 17: Global Market Y-o-Y Growth Comparison by Region, 2025-2035
  • Figure 18: Global Market Attractiveness Analysis by Region
  • Figure 19: North America Market Incremental $ Opportunity, 2025-2035
  • Figure 20: Latin America Market Incremental $ Opportunity, 2025-2035
  • Figure 21: Western Europe Market Incremental $ Opportunity, 2025-2035
  • Figure 22: Eastern Europe Market Incremental $ Opportunity, 2025-2035
  • Figure 23: East Asia Market Incremental $ Opportunity, 2025-2035
  • Figure 24: South Asia & Pacific Market Incremental $ Opportunity, 2025-2035
  • Figure 25: Middle East and Africa Market Incremental $ Opportunity, 2025-2035
  • Figure 26: North America Market Value Share and BPS Analysis by Country, 2025 and 2035
  • Figure 27: North America Market Value Share and BPS Analysis by Product Type, 2025 and 2035
  • Figure 28: North America Market Y-o-Y Growth Comparison by Product Type, 2025-2035
  • Figure 29: North America Market Attractiveness Analysis by Product Type
  • Figure 30: North America Market Value Share and BPS Analysis by Source, 2025 and 2035
  • Figure 31: North America Market Y-o-Y Growth Comparison by Source, 2025-2035
  • Figure 32: North America Market Attractiveness Analysis by Source
  • Figure 33: North America Market Value Share and BPS Analysis by Form, 2025 and 2035
  • Figure 34: North America Market Y-o-Y Growth Comparison by Form, 2025-2035
  • Figure 35: North America Market Attractiveness Analysis by Form
  • Figure 36: North America Market Value Share and BPS Analysis by Application, 2025 and 2035
  • Figure 37: North America Market Y-o-Y Growth Comparison by Application, 2025-2035
  • Figure 38: North America Market Attractiveness Analysis by Application
  • Figure 39: Latin America Market Value Share and BPS Analysis by Country, 2025 and 2035
  • Figure 40: Latin America Market Value Share and BPS Analysis by Product Type, 2025 and 2035
  • Figure 41: Latin America Market Y-o-Y Growth Comparison by Product Type, 2025-2035
  • Figure 42: Latin America Market Attractiveness Analysis by Product Type
  • Figure 43: Latin America Market Value Share and BPS Analysis by Source, 2025 and 2035
  • Figure 44: Latin America Market Y-o-Y Growth Comparison by Source, 2025-2035
  • Figure 45: Latin America Market Attractiveness Analysis by Source
  • Figure 46: Latin America Market Value Share and BPS Analysis by Form, 2025 and 2035
  • Figure 47: Latin America Market Y-o-Y Growth Comparison by Form, 2025-2035
  • Figure 48: Latin America Market Attractiveness Analysis by Form
  • Figure 49: Latin America Market Value Share and BPS Analysis by Application, 2025 and 2035
  • Figure 50: Latin America Market Y-o-Y Growth Comparison by Application, 2025-2035
  • Figure 51: Latin America Market Attractiveness Analysis by Application
  • Figure 52: Western Europe Market Value Share and BPS Analysis by Country, 2025 and 2035
  • Figure 53: Western Europe Market Value Share and BPS Analysis by Product Type, 2025 and 2035
  • Figure 54: Western Europe Market Y-o-Y Growth Comparison by Product Type, 2025-2035
  • Figure 55: Western Europe Market Attractiveness Analysis by Product Type
  • Figure 56: Western Europe Market Value Share and BPS Analysis by Source, 2025 and 2035
  • Figure 57: Western Europe Market Y-o-Y Growth Comparison by Source, 2025-2035
  • Figure 58: Western Europe Market Attractiveness Analysis by Source
  • Figure 59: Western Europe Market Value Share and BPS Analysis by Form, 2025 and 2035
  • Figure 60: Western Europe Market Y-o-Y Growth Comparison by Form, 2025-2035
  • Figure 61: Western Europe Market Attractiveness Analysis by Form
  • Figure 62: Western Europe Market Value Share and BPS Analysis by Application, 2025 and 2035
  • Figure 63: Western Europe Market Y-o-Y Growth Comparison by Application, 2025-2035
  • Figure 64: Western Europe Market Attractiveness Analysis by Application
  • Figure 65: Eastern Europe Market Value Share and BPS Analysis by Country, 2025 and 2035
  • Figure 66: Eastern Europe Market Value Share and BPS Analysis by Product Type, 2025 and 2035
  • Figure 67: Eastern Europe Market Y-o-Y Growth Comparison by Product Type, 2025-2035
  • Figure 68: Eastern Europe Market Attractiveness Analysis by Product Type
  • Figure 69: Eastern Europe Market Value Share and BPS Analysis by Source, 2025 and 2035
  • Figure 70: Eastern Europe Market Y-o-Y Growth Comparison by Source, 2025-2035
  • Figure 71: Eastern Europe Market Attractiveness Analysis by Source
  • Figure 72: Eastern Europe Market Value Share and BPS Analysis by Form, 2025 and 2035
  • Figure 73: Eastern Europe Market Y-o-Y Growth Comparison by Form, 2025-2035
  • Figure 74: Eastern Europe Market Attractiveness Analysis by Form
  • Figure 75: Eastern Europe Market Value Share and BPS Analysis by Application, 2025 and 2035
  • Figure 76: Eastern Europe Market Y-o-Y Growth Comparison by Application, 2025-2035
  • Figure 77: Eastern Europe Market Attractiveness Analysis by Application
  • Figure 78: East Asia Market Value Share and BPS Analysis by Country, 2025 and 2035
  • Figure 79: East Asia Market Value Share and BPS Analysis by Product Type, 2025 and 2035
  • Figure 80: East Asia Market Y-o-Y Growth Comparison by Product Type, 2025-2035
  • Figure 81: East Asia Market Attractiveness Analysis by Product Type
  • Figure 82: East Asia Market Value Share and BPS Analysis by Source, 2025 and 2035
  • Figure 83: East Asia Market Y-o-Y Growth Comparison by Source, 2025-2035
  • Figure 84: East Asia Market Attractiveness Analysis by Source
  • Figure 85: East Asia Market Value Share and BPS Analysis by Form, 2025 and 2035
  • Figure 86: East Asia Market Y-o-Y Growth Comparison by Form, 2025-2035
  • Figure 87: East Asia Market Attractiveness Analysis by Form
  • Figure 88: East Asia Market Value Share and BPS Analysis by Application, 2025 and 2035
  • Figure 89: East Asia Market Y-o-Y Growth Comparison by Application, 2025-2035
  • Figure 90: East Asia Market Attractiveness Analysis by Application
  • Figure 91: South Asia & Pacific Market Value Share and BPS Analysis by Country, 2025 and 2035
  • Figure 92: South Asia & Pacific Market Value Share and BPS Analysis by Product Type, 2025 and 2035
  • Figure 93: South Asia & Pacific Market Y-o-Y Growth Comparison by Product Type, 2025-2035
  • Figure 94: South Asia & Pacific Market Attractiveness Analysis by Product Type
  • Figure 95: South Asia & Pacific Market Value Share and BPS Analysis by Source, 2025 and 2035
  • Figure 96: South Asia & Pacific Market Y-o-Y Growth Comparison by Source, 2025-2035
  • Figure 97: South Asia & Pacific Market Attractiveness Analysis by Source
  • Figure 98: South Asia & Pacific Market Value Share and BPS Analysis by Form, 2025 and 2035
  • Figure 99: South Asia & Pacific Market Y-o-Y Growth Comparison by Form, 2025-2035
  • Figure 100: South Asia & Pacific Market Attractiveness Analysis by Form
  • Figure 101: South Asia & Pacific Market Value Share and BPS Analysis by Application, 2025 and 2035
  • Figure 102: South Asia & Pacific Market Y-o-Y Growth Comparison by Application, 2025-2035
  • Figure 103: South Asia & Pacific Market Attractiveness Analysis by Application
  • Figure 104: Middle East and Africa Market Value Share and BPS Analysis by Country, 2025 and 2035
  • Figure 105: Middle East and Africa Market Value Share and BPS Analysis by Product Type, 2025 and 2035
  • Figure 106: Middle East and Africa Market Y-o-Y Growth Comparison by Product Type, 2025-2035
  • Figure 107: Middle East and Africa Market Attractiveness Analysis by Product Type
  • Figure 108: Middle East and Africa Market Value Share and BPS Analysis by Source, 2025 and 2035
  • Figure 109: Middle East and Africa Market Y-o-Y Growth Comparison by Source, 2025-2035
  • Figure 110: Middle East and Africa Market Attractiveness Analysis by Source
  • Figure 111: Middle East and Africa Market Value Share and BPS Analysis by Form, 2025 and 2035
  • Figure 112: Middle East and Africa Market Y-o-Y Growth Comparison by Form, 2025-2035
  • Figure 113: Middle East and Africa Market Attractiveness Analysis by Form
  • Figure 114: Middle East and Africa Market Value Share and BPS Analysis by Application, 2025 and 2035
  • Figure 115: Middle East and Africa Market Y-o-Y Growth Comparison by Application, 2025-2035
  • Figure 116: Middle East and Africa Market Attractiveness Analysis by Application
  • Figure 117: Global Market - Tier Structure Analysis
  • Figure 118: Global Market - Company Share Analysis

Frequently Asked Questions

How big is the activated cake emulsifier market in 2025?

The global activated cake emulsifier market is estimated to be valued at USD 1 billion in 2025.

What will be the size of activated cake emulsifier market in 2035?

The market size for the activated cake emulsifier market is projected to reach USD 1.6 billion by 2035.

How much will be the activated cake emulsifier market growth between 2025 and 2035?

The activated cake emulsifier market is expected to grow at a 4.9% CAGR between 2025 and 2035.

Which product type is projected to lead in the activated cake emulsifier market in 2025?

The polyglycerol esters segment is projected to lead in the activated cake emulsifier market with 40% market share in 2025.

Which form segment is expected to contribute significant share in the activated cake emulsifier market in 2025?

In terms of form, the powder segment is expected to command 55% share in the activated cake emulsifier market in 2025.

Explore Similar Insights

Future Market Insights

Activated Cake Emulsifier Market