Light-Activated Anti-Pollution Skincare Market Size and Share Forecast Outlook 2025 to 2035

A market valuation of USD 1,452.4 million has been estimated for 2025 in the light-activated anti-pollution skincare industry, with the figure expected to rise to USD 4,902.6 million by 2035. This progression reflects an overall addition of USD 3,450.2 million, translating into a CAGR of 12.9% during the decade under review. The growth trajectory indicates a more than threefold expansion, underscoring the increasing role of light-activated systems in advanced skincare formulations.
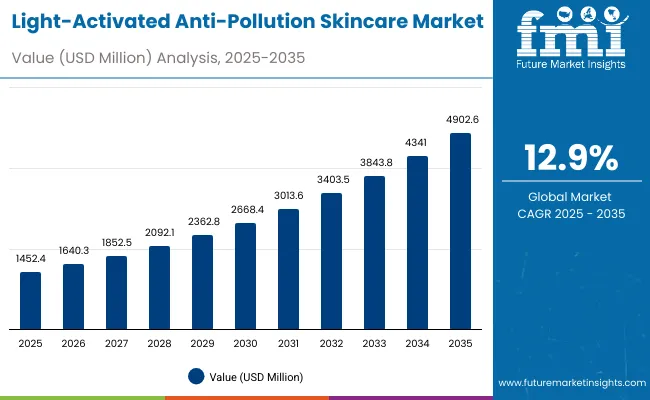
Quick Stats for Light-Activated Anti-Pollution Skincare Market

  • Light-Activated Anti-Pollution Skincare Market Value (2025): USD 1,452.4 million
  • Light-Activated Anti-Pollution Skincare Market Forecast Value (2035): USD 4,902.6 million
  • Light-Activated Anti-Pollution Skincare Market Forecast CAGR (2025 to 2035): 12.9%
  • Leading Segment in 2025: SPF-included function (52%)
  • Key Growth Regions: East Asia, North America, Europe, South Asia & Pacific
  • Top Key Players: Shiseido, L’Oréal, Estée Lauder, La Roche-Posay, Kiehl’s, Olay, Murad, Supergoop!, Dr. Jart+

Light Activated Anti Pollution Skincare Market

Light-Activated Anti-Pollution Skincare Market Key Takeaways

Metric Value
Light-Activated Anti-Pollution Skincare Market Estimated Value in (2025E) USD 1,452.4 million
Light-Activated Anti-Pollution Skincare Market Forecast Value in (2035F) USD 4,902.6 million
Forecast CAGR (2025 to 2035) 12.90%

During the initial phase from 2025 to 2030, the market is projected to climb from USD 1,452.4 million to USD 2,668.4 million, an addition of USD 1,216 million, which accounts for approximately 35% of the total growth expected over the decade. This stage is likely to be characterized by rapid adoption of SPF-included anti-pollution shields, which are forecasted to command a 52% share in 2025, valued at USD 588.9 million. Concurrently, moisturizers with SPF are anticipated to dominate the product landscape with a 55% share in 2025, translating into USD 566.7 million in sales.

In the subsequent period from 2030 to 2035, expansion is forecasted to accelerate, with the market increasing from USD 2,668.4 million to USD 4,902.6 million. This gain of USD 2,234.2 million will represent 65% of total decade growth, driven by heightened consumer demand for blue-light and IR defense solutions, alongside stronger traction for encapsulation-based delivery technologies. By 2035, digital-driven awareness and e-commerce penetration are expected to consolidate the leadership of multifunctional, clinically validated skincare formulations in this market.

From 2020 to 2024, the market foundation was shaped by rising consumer awareness of urban pollution and digital light exposure. By 2025, demand for multifunctional skincare solutions is expected to anchor growth, with SPF-included and anti-pollution shield claims forecasted to dominate. During the decade ahead, the revenue base is projected to shift significantly, with e-commerce channels strengthening above 50% share and clean-label claims gaining momentum in high-growth regions such as China and India.

Competitive positioning is expected to evolve as differentiation moves from product efficacy alone to holistic strategies encompassing clinical validation, sustainability, and advanced encapsulation technologies. Established global brands are projected to face intensified competition from digital-first challengers and regionally specialized players, leading to a market in which innovation ecosystems and brand authenticity are set to determine long-term leadership.

Why the Light-Activated Anti-Pollution Skincare Market is growing?

Growth in the light-activated anti-pollution skincare market is being driven by heightened consumer awareness of environmental stressors, digital light exposure, and the rising demand for multifunctional skin defense solutions. Advancements in photoreactive systems, including photochromic polymer shields and encapsulation-based delivery, have been enabling more effective protection against pollutants, UV rays, and blue light. Increasing urbanization and digital lifestyle shifts are expected to accelerate adoption, as consumers seek products that address both outdoor and indoor aggressors.

E-commerce expansion is anticipated to enhance accessibility, particularly in emerging economies, while clean-label and dermatologist-tested claims are forecasted to reinforce consumer trust. Premiumization trends in East Asia and strong clinical positioning in North America are projected to further consolidate demand. With moisturizers with SPF and SPF-included functions already dominating early market adoption, momentum is expected to intensify as innovations in light-activated microcapsules and blue-light defense redefine performance standards. These dynamics are anticipated to sustain robust double-digit growth through 2035.

Segmental Analysis

The light-activated anti-pollution skincare market has been segmented by claim, function, and product type, each reflecting distinct consumer priorities and innovation pathways. Claim-based segmentation is defined by the rising prominence of SPF-included formulations alongside alternatives such as dermatologist-tested and clean-label offerings. Function-based classification highlights the leading role of anti-pollution shield technologies while also recognizing the growing importance of blue-light and IR defense.

Product type segmentation illustrates how daily-use moisturizers with SPF continue to dominate consumer adoption, while other formats such as serums and essences are gaining traction. Together, these segments are expected to shape the competitive landscape and drive innovation throughout the forecast period, ensuring that both protective efficacy and consumer trust remain central to growth.
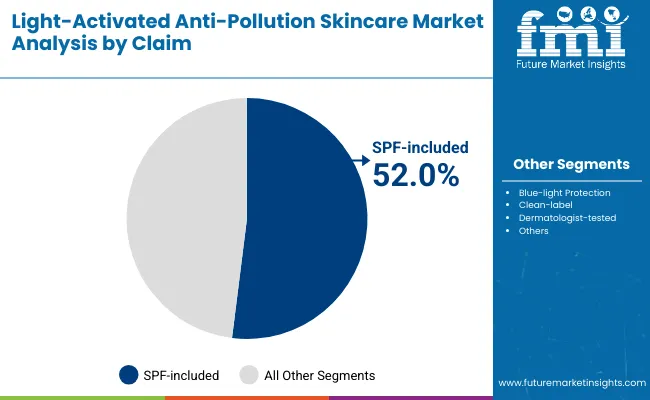
Insights into the Claim Segment with SPF-included Leading in Market Share

Light Activated Anti Pollution Skincare Market By Claim

Segment Market Value Share, 2025
SPF-included 52%
Others 48.0%

SPF-included claims are projected to capture 52% share in 2025, valued at USD 588.9 million. The claim segment of the light-activated anti-pollution skincare market is expected to grow steadily, as consumer trust in multifunctional skincare solutions continues to increase. Adoption is anticipated to be reinforced by rising awareness of UV-induced damage combined with environmental aggressors. Other claims, representing 48% share and USD 697.15 million, are projected to perform strongly as demand for dermatologist-tested and clean-label positioning gains momentum. This balance between SPF-included and alternative claims is forecasted to create a diversified growth path over the decade.
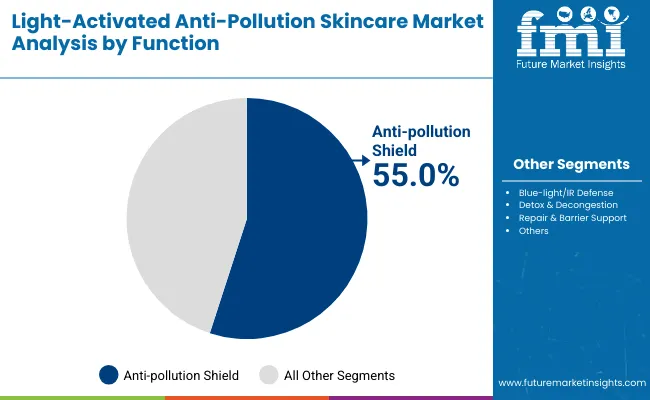
Insights into the Function Segment with Anti-pollution Shield Leading in Market Share

Light Activated Anti Pollution Skincare Market By Function

Segment Market Value Share, 2025
Anti-pollution shield 55%
Others 45.0%

Anti-pollution shield functions are forecasted to account for 55% share in 2025, valued at USD 566.7 million. The function segment is expected to expand rapidly as urbanization and pollution exposure continue to intensify, heightening consumer need for effective protective solutions. Adoption is projected to be strengthened by innovation in photoreactive complexes that deliver advanced environmental defense. Other functions, with a 45% share valued at USD 653.58 million, are forecasted to build traction as consumers increasingly recognize the impact of digital light and infrared exposure. The balance between these categories is anticipated to define the next phase of skincare innovation.
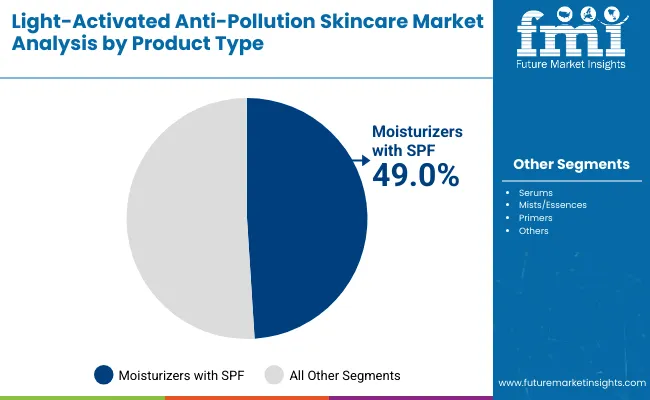
Insights into the Product Type Segment with Moisturizers with SPF Driving Growth

Light Activated Anti Pollution Skincare Market By Product

Segment Market Value Share, 2025
Moisturizers with SPF 49%
Others 51.0%

Moisturizers with SPF are projected to hold 49% share in 2025, valued at USD 533.3 million. The product type segment is forecasted to remain anchored by moisturizers, given their convenience of daily application and consumer confidence in clinically validated protection. Their adoption is expected to expand across both premium and mass-market categories, reinforcing leadership. Other product types, accounting for 51% share at USD 740.72 million, are projected to accelerate due to rising interest in lightweight formats such as serums, mists, and essences. This evolution is anticipated to strengthen product diversification and increase penetration across younger demographics and digitally influenced buyers.

What are the Drivers, Restraints, and Key Trends of the Light-Activated Anti-Pollution Skincare Market?

Complex urban environments, prolonged digital exposure, and shifting consumer expectations are redefining the adoption of light-activated anti-pollution skincare. While innovations in photoreactive systems enhance efficacy, challenges persist around cost, regulatory alignment, and sustainable ingredient sourcing.

Advancements in Photoreactive Delivery Systems

Market expansion is being shaped by the evolution of encapsulation and sustained-release technologies that ensure active ingredients are preserved until triggered by light exposure. This innovation is enabling improved stability, deeper skin penetration, and longer-lasting defense. The development of light-responsive microcapsules is anticipated to create a new performance benchmark, attracting premium positioning in dermatological and cosmetic applications. As consumers seek scientifically validated efficacy, such technologies are expected to anchor the credibility of next-generation skincare formulations.

Integration of Digital Wellness and Skincare

Consumer lifestyles dominated by digital device usage are influencing market direction, as concerns around blue-light and infrared exposure gain scientific validation. Light-activated skincare is being increasingly aligned with digital wellness narratives, where protection against screen-induced stress complements traditional UV defense. This convergence is projected to extend product relevance beyond outdoor settings into everyday indoor environments. The repositioning of skincare as a shield for both physical and digital pollution is likely to foster strong cross-category synergies with wellness, lifestyle, and healthcare platforms, ensuring sustained engagement across diverse consumer groups.
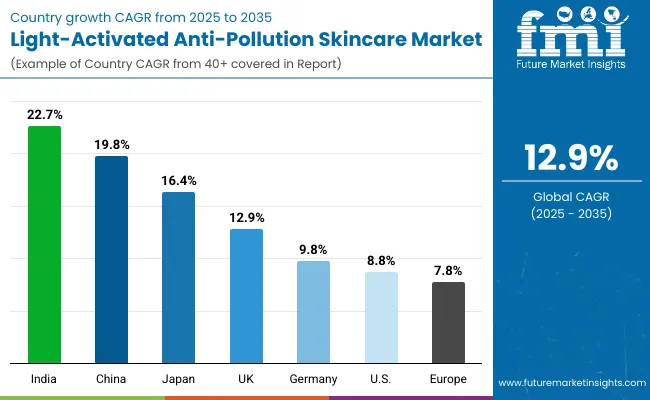
Analysis of Light-Activated Anti-Pollution Skincare Market By Key Countries

Light Activated Anti Pollution Skincare Market By Country

Countries CAGR
China 19.8%
USA 8.8%
India 22.7%
UK 12.9%
Germany 9.8%
Japan 16.4%

The global light-activated anti-pollution skincare market demonstrates considerable variation across leading countries, with growth trajectories shaped by urbanization intensity, digital lifestyle patterns, and the regulatory positioning of skincare innovations. China is forecasted to record a CAGR of 19.8% between 2025 and 2035, supported by rapid adoption of encapsulation and sustained-release technologies alongside strong consumer receptivity to multifunctional, premium skincare. India is expected to emerge as the fastest-growing country at a CAGR of 22.7%, as clean-label preferences converge with rising disposable incomes and growing awareness of digital light protection. Japan is projected to maintain a 16.4% CAGR, anchored by consumer demand for dermatologist-tested solutions and a cultural emphasis on skincare sophistication.

In Europe, the UK is anticipated to expand at a CAGR of 12.9%, reflecting the influence of clinical positioning and regulatory-driven trust in dermatological products. Germany, with a 9.8% CAGR, is expected to sustain growth through innovation in blue-light and infrared defense categories that resonate with health-conscious consumers. The USA is projected to grow more moderately at 8.8% CAGR, reflecting a mature skincare environment where clinical-grade and dermatologist-validated claims drive adoption. These dynamics collectively highlight how diverse consumer priorities and innovation pathways will define the global growth outlook.
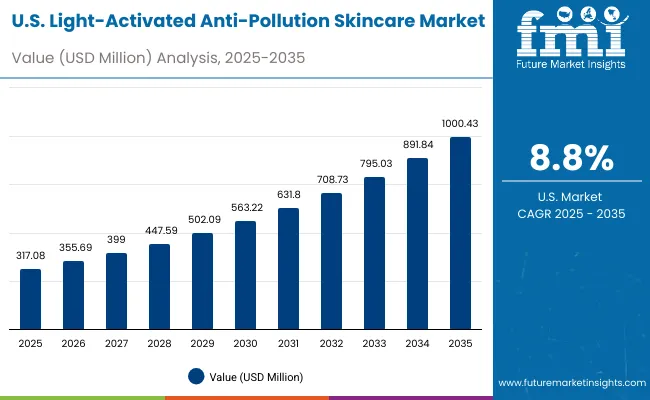
Sales Outlook For Light-Activated Anti-Pollution Skincare in the United States

Light Activated Anti Pollution Skincare Market Usa

Year USA Light-Activated Anti-Pollution Skincare Market (USD Million)
2025 317.08
2026 355.69
2027 399.00
2028 447.59
2029 502.09
2030 563.22
2031 631.80
2032 708.73
2033 795.03
2034 891.84
2035 1,000.43

The Light-Activated Anti-Pollution Skincare Market in the United States is projected to grow at a CAGR of ~12%, supported by rising demand for clinically validated, dermatologist-tested, and multifunctional skincare solutions. Consumer awareness of UV and digital light exposure has been strengthening adoption, while premiumization trends continue to shape purchasing behavior. The clinical-grade segment has been gaining prominence as trust in science-backed efficacy drives product preference.

Digital-first platforms have been expanding distribution, allowing wider consumer access and fostering direct engagement. Integration of skincare into broader wellness narratives, including digital protection and sustainability, is expected to further enhance penetration. Growth momentum is anticipated to intensify as e-commerce ecosystems expand and personalized skincare offerings gain traction among younger demographics.

  • Clinical-grade and dermatologist-tested claims are reinforcing consumer trust, positioning the USA market toward science-backed adoption.
  • Rising consumer concern over blue-light and infrared exposure is anticipated to transform skincare routines across multiple demographics.
  • E-commerce platforms and digital-native brands are projected to accelerate accessibility and expand market engagement throughout the decade.

Growth and Expansion Outlook for Light-Activated Anti-Pollution Skincare Market in the United Kingdom

The Light-Activated Anti-Pollution Skincare Market in the United Kingdom is projected to grow at a CAGR of 12.9% from 2025 to 2035, supported by rising awareness of digital light exposure and strict regulatory standards for dermatological products. Demand is anticipated to be shaped by trust in clinical validation and dermatologist-tested claims, with consumers seeking high-efficacy solutions backed by proven research. Premium skincare formats are expected to perform strongly as sustainability narratives resonate with eco-conscious buyers. Expansion is forecasted to be accelerated by the integration of clean-label positioning and transparent ingredient sourcing, further reinforcing consumer loyalty. E-commerce adoption is projected to support growth, particularly in reaching digitally active demographics across metropolitan regions.

  • Dermatologist-tested claims are strengthening credibility and encouraging repeat purchases.
  • Sustainability-driven innovations are aligning with consumer expectations for transparency.
  • Premiumization is expected to anchor value expansion in urban markets.
  • Online retail platforms are anticipated to amplify accessibility and engagement.

Growth and Expansion Outlook for Light-Activated Anti-Pollution Skincare Market in India

The Light-Activated Anti-Pollution Skincare Market in India is forecasted to grow at a CAGR of 22.7% between 2025 and 2035, making it the fastest-growing country globally. Market expansion is expected to be driven by rising disposable incomes, greater consumer exposure to digital lifestyles, and demand for multifunctional skincare solutions. Clean-label and natural formulations are projected to resonate strongly, as traditional wellness practices combine with modern science to create unique consumer appeal. E-commerce ecosystems are anticipated to provide significant momentum, as digital-first platforms penetrate both urban and semi-urban areas. Increasing awareness of blue-light protection is forecasted to reinforce demand among younger demographics, who are highly active on digital devices.

  • Clean-label and natural claims are strengthening consumer trust in modern skincare.
  • E-commerce is enabling broader distribution and deeper market penetration.
  • Rising disposable incomes are supporting premiumization of skincare portfolios.
  • Blue-light protection is emerging as a defining category among digital-native consumers.

Sales Outlook for Light-Activated Anti-Pollution Skincare in China

The Light-Activated Anti-Pollution Skincare Market in China is projected to expand at a CAGR of 19.8% from 2025 to 2035, fueled by urban pollution challenges and increasing demand for premium skincare technologies. Encapsulation and sustained-release functions are expected to anchor performance, as Chinese consumers increasingly prioritize innovation-driven efficacy. Market growth is anticipated to be amplified by rapid adoption of digital-first retail channels, where influencer-led education fosters awareness and trust. Clean-label and multifunctional claims are projected to be strong differentiators, particularly as regulatory oversight ensures transparency and quality. Consumer loyalty is forecasted to be shaped by advanced formulations that combine blue-light defense with long-lasting anti-pollution protection.
  • Encapsulation-based systems are positioning products as science-backed and premium.
  • E-commerce and social commerce are strengthening brand visibility and sales momentum.
  • Clean-label regulations are reinforcing trust and expanding consumer acceptance.
  • Multifunctional claims are projected to anchor growth across urban segments.

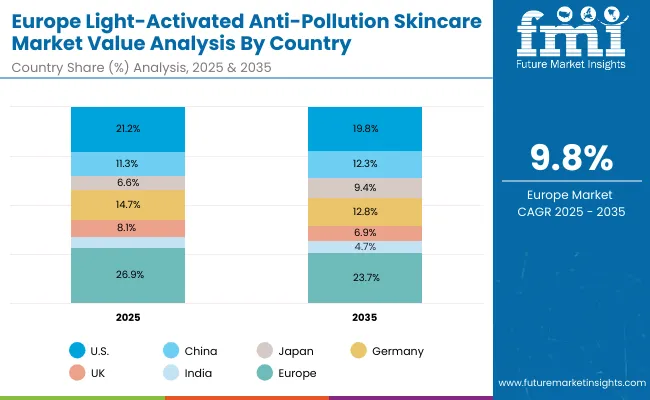
In-depth Analysis of Light-Activated Anti-Pollution Skincare in Germany

Light Activated Anti Pollution Skincare Market Europe

Countries 2025
USA 21.2%
China 11.3%
Japan 6.6%
Germany 14.7%
UK 8.1%
India 5.0%
Countries 2035
USA 19.8%
China 12.3%
Japan 9.4%
Germany 12.8%
UK 6.9%
India 5.6%

The Light-Activated Anti-Pollution Skincare Market in Germany is expected to grow at a CAGR of 9.8% from 2025 to 2035, reflecting steady adoption driven by regulatory trust and preference for dermatologist-tested solutions. Consumers are anticipated to prioritize blue-light and infrared defense, aligning with increasing awareness of digital and environmental skin stressors. Growth is forecasted to be concentrated in premium and clinical-grade segments, where efficacy and scientific validation serve as critical decision factors. Distribution expansion through pharmacies and specialist retailers is projected to maintain credibility while e-commerce channels enhance reach among younger demographics. Sustainability narratives are expected to hold significant weight, as German consumers remain focused on ethical sourcing and eco-friendly packaging.
  • Blue-light and IR defense solutions are expected to gain high traction.
  • Dermatologist-tested claims are reinforcing confidence in premium skincare offerings.
  • Pharmacies remain trusted distribution channels for clinical-grade solutions.
  • Sustainability-driven positioning is strengthening competitive differentiation.

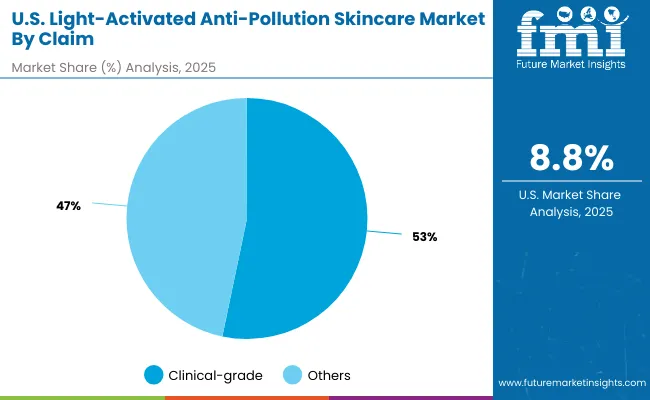
Growth Outlook for Light-Activated Anti-Pollution Skincare Market in USA

Light Activated Anti Pollution Skincare Market Usa 2

Segment Market Value Share, 2025
Clinical-grade 53.3%
Others 46.7%

The Light-Activated Anti-Pollution Skincare Market in the United States is projected at USD 317.08 million in 2025. Clinical-grade claims contribute 53.3%, equal to USD 169.1 million, while other claims account for 46.7%, valued at USD 147.97 million. This slight clinical-grade dominance reflects a strong preference for dermatologist-tested and science-backed skincare positioned around proven efficacy. Adoption is anticipated to be further reinforced by the USA consumer inclination toward formulations validated through clinical studies, which elevate trust and encourage repeat purchases. Other claims, however, are expected to maintain resilience, as clean-label, sustainable, and multifunctional offerings gain momentum with younger and wellness-oriented demographics.

The competitive trajectory is forecasted to be defined by the balance between clinically endorsed efficacy and consumer-driven demand for transparency. Integration of digital protection, sustainability claims, and advanced delivery mechanisms is projected to amplify the relevance of both categories, ensuring a diversified growth outlook for the decade.
  • Market in the USA accounts for 317.08 million in 2025 within the global landscape
  • Clinical-grade leads marginally at 53.3% versus 46.7% for other claims
  • Growth supported by dermatologist validation, clean-label traction, and multifunctional positioning

Opportunity Analysis of China Light-Activated Anti-Pollution Skincare Market

Light Activated Anti Pollution Skincare Market China

Segment Market Value Share, 2025
Encapsulation & sustained release 51.5%
Others 48.5%

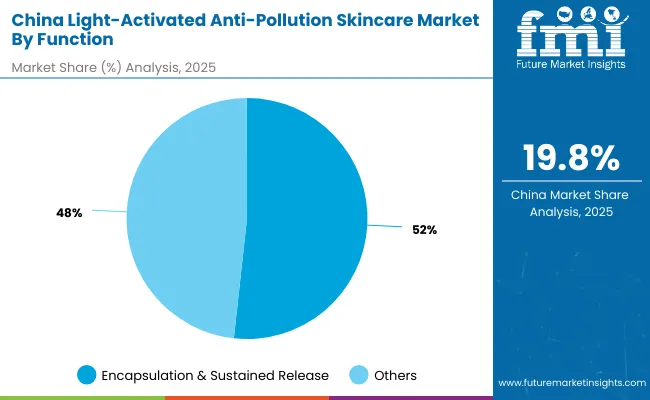
The Light-Activated Anti-Pollution Skincare Market in China is projected at USD 164.12 million in 2025. Encapsulation and sustained-release functions contribute 51.5%, equal to USD 84.5 million, while other functions account for 48.5%, valued at USD 79.57 million. This marginal dominance of encapsulation-based systems highlights consumer preference for advanced technologies that ensure prolonged efficacy and deeper skin protection. Growth in this segment is expected to be reinforced by strong scientific validation, which aligns well with China’s evolving regulatory landscape that prioritizes safety and transparency. Other functions, including standard anti-pollution and blue-light defense, are anticipated to remain important, supported by urban pollution challenges and increased screen exposure.

The market outlook is projected to be shaped by the convergence of technology, science, and consumer demand for multifunctional solutions. Innovation in delivery mechanisms and cross-category integration with wellness products is expected to enhance adoption across urban consumer groups.
  • Encapsulation & sustained-release leads at 51.5% share, valued at USD 84.5 million.
  • Scientific validation and regulatory alignment are reinforcing consumer trust.
  • Blue-light and anti-pollution functions are gaining traction among urban populations.
  • Multifunctional performance is expected to drive long-term competitive advantage.

Competitive Landscape of Light-Activated Anti-Pollution Skincare Market

Light Activated Anti Pollution Skincare Market By Company

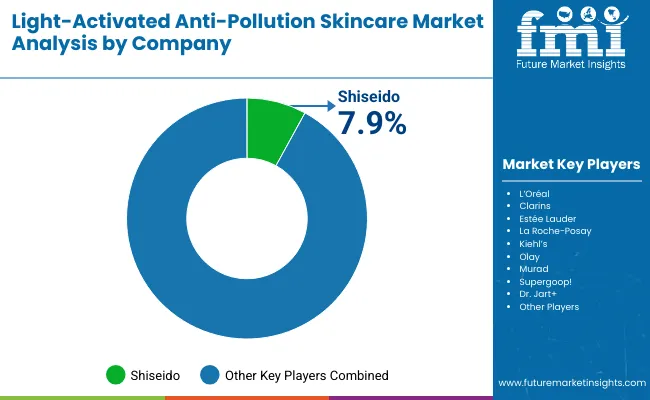
The Light-Activated Anti-Pollution Skincare Market is moderately fragmented, with global beauty leaders, established premium skincare brands, and emerging niche players competing across multiple segments. Shiseido has been identified as the leading player, holding 7.9% of the global market share in 2025, while the rest of the market remains divided among competitors such as L’Oréal, Estée Lauder, Clarins, La Roche-Posay, Kiehl’s, Olay, Murad, Supergoop!, and Dr. Jart+. The competitive advantage of Shiseido is expected to be reinforced by its innovation in light-activated complexes and its strong presence in East Asia, where consumer adoption of anti-pollution skincare is accelerating.

Other multinational brands, including L’Oréal and Estée Lauder, are projected to strengthen their positions by leveraging broad distribution networks and emphasizing multifunctional, dermatologist-tested solutions. Specialized players such as La Roche-Posay and Supergoop! are anticipated to expand rapidly in niche areas like blue-light protection and clinical-grade SPF solutions, appealing strongly to digitally active consumers.

Differentiation in this market is expected to shift away from traditional product lines toward innovation in encapsulation technologies, sustainability-led formulations, and digital-first engagement strategies. Competitive strategies are projected to revolve around clinical validation, clean-label positioning, and personalization, ensuring that global leaders and niche innovators align with evolving consumer expectations.

Key Developments in Light-Activated Anti-Pollution Skincare Market

  • In April 2025, brands such as L’Oréal and others expanded their tinted and invisible SPF offerings, combining high SPF protection with clean finishes suited for all skin tones. These launches were designed to meet rising demand for daily, wear-friendly protection that also defends against blue light and environmental pollutants.
  • In May 2025, skincare companies such as Supergoop! and Medik8 released multifunctional serums that incorporated anti-pollution, blue-light defense, and antioxidant benefits. These serums were clinician-validated and designed for sensitive skin, reflecting an increasing trend toward combining light-activated protection with skin barrier support.

Scope of the Report

Item Value
Quantitative Units USD million;% share; CAGR
Market Size & Outlook USD 1,452.4 million (2025); USD 4,902.6 million (2035); CAGR 12.9% (2025-2035)
Component/Claim SPF-included; Clean-label; Dermatologist-tested; Blue-light protection; Others
Function Anti-pollution shield; Blue-light/IR defense; Detox & decongestion; Repair & barrier support
Product Type Moisturizers with SPF; Serums; Mists/essences; Primers; Others
Distribution Channels Pharmacies; E-commerce; Premium beauty retail; Dermatology clinics
Regions Covered North America; Europe; East Asia; South Asia & Pacific; Latin America; Middle East & Africa
Countries Covered United States; Canada; Germany; France; United Kingdom; China; Japan; India; Brazil; South Africa
Key Companies Profiled Shiseido; L’Oréal; Estée Lauder; La Roche-Posay; Kiehl’s; Olay; Murad; Supergoop!; Dr. Jart+
Additional Attributes Dollar sales by claim, function, product type, and channel; Encapsulation & sustained-release innovation; Clinical-grade and SPF-included leadership; Blue-light/IR defense adoption; Clean-label & dermatologist-tested positioning; E-commerce scale-up; Country growth leaders: India (CAGR 22.7%), China (CAGR 19.8%), Japan (CAGR 16.4%), UK (CAGR 12.9%), Germany (CAGR 9.8%), USA (CAGR 8.8%)

Key Segments

By Photoreactive System:

  • Photolyase complexes
  • Photochromic polymer shields
  • Light-activated microcapsules
  • Blue-light reactive antioxidants

By Function:

  • Anti-pollution shield
  • Blue-light/IR defense
  • Detox & decongestion
  • Repair & barrier support

By Product Type:

  • Moisturizers with SPF
  • Mists/essences
  • Serums
  • Primers

By Channel:

  • Pharmacies
  • E-commerce
  • Premium beauty retail
  • Dermatology clinics

By Claim:

  • SPF-included
  • Blue-light protection
  • Clean-label
  • Dermatologist-tested

By Region:

  • North America
  • Latin America
  • Europe
  • East Asia
  • South Asia & Pacific
  • Middle East and Africa

Table of Content

  1. Executive Summary
    • Global Market Outlook
    • Demand-side Trends
    • Supply-side Trends
    • Technology Roadmap Analysis
    • Analysis and Recommendations
  2. Market Overview
    • Market Coverage / Taxonomy
    • Market Definition / Scope / Limitations
  3. Market Background
    • Market Dynamics
      • Drivers
      • Restraints
      • Opportunity
      • Trends
    • Scenario Forecast
      • Demand in Optimistic Scenario
      • Demand in Likely Scenario
      • Demand in Conservative Scenario
    • Opportunity Map Analysis
    • Product Life Cycle Analysis
    • Supply Chain Analysis
    • Investment Feasibility Matrix
    • Value Chain Analysis
    • PESTLE and Porter’s Analysis
    • Regulatory Landscape
    • Regional Parent Market Outlook
    • Production and Consumption Statistics
    • Import and Export Statistics
  4. Global Market Analysis 2020 to 2024 and Forecast, 2025 to 2035
    • Historical Market Size Value (USD Million) Analysis, 2020 to 2024
    • Current and Future Market Size Value (USD Million) Projections, 2025 to 2035
      • Y-o-Y Growth Trend Analysis
      • Absolute $ Opportunity Analysis
  5. Global Market Pricing Analysis 2020 to 2024 and Forecast 2025 to 2035
  6. Global Market Analysis 2020 to 2024 and Forecast 2025 to 2035, By Photoreactive System
    • Introduction / Key Findings
    • Historical Market Size Value (USD Million) Analysis By Photoreactive System, 2020 to 2024
    • Current and Future Market Size Value (USD Million) Analysis and Forecast By Photoreactive System, 2025 to 2035
      • Photolyase complexes
      • Photochromic polymer shields
      • Light-activated microcapsules
      • Blue-light reactive antioxidants
    • Y-o-Y Growth Trend Analysis By Photoreactive System, 2020 to 2024
    • Absolute $ Opportunity Analysis By Photoreactive System, 2025 to 2035
  7. Global Market Analysis 2020 to 2024 and Forecast 2025 to 2035, By Function
    • Introduction / Key Findings
    • Historical Market Size Value (USD Million) Analysis By Function, 2020 to 2024
    • Current and Future Market Size Value (USD Million) Analysis and Forecast By Function, 2025 to 2035
      • Anti-pollution shield
      • Blue-light/IR defense
      • Detox & decongestion
      • Repair & barrier support
    • Y-o-Y Growth Trend Analysis By Function, 2020 to 2024
    • Absolute $ Opportunity Analysis By Function, 2025 to 2035
  8. Global Market Analysis 2020 to 2024 and Forecast 2025 to 2035, By Product Type
    • Introduction / Key Findings
    • Historical Market Size Value (USD Million) Analysis By Product Type, 2020 to 2024
    • Current and Future Market Size Value (USD Million) Analysis and Forecast By Product Type, 2025 to 2035
      • Moisturizers with SPF
      • Mists/essences
      • Serums
      • Primers
    • Y-o-Y Growth Trend Analysis By Product Type, 2020 to 2024
    • Absolute $ Opportunity Analysis By Product Type, 2025 to 2035
  9. Global Market Analysis 2020 to 2024 and Forecast 2025 to 2035, By Channel
    • Introduction / Key Findings
    • Historical Market Size Value (USD Million) Analysis By Channel, 2020 to 2024
    • Current and Future Market Size Value (USD Million) Analysis and Forecast By Channel, 2025 to 2035
      • Pharmacies
      • E-commerce
      • Premium beauty retail
      • Dermatology clinics
    • Y-o-Y Growth Trend Analysis By Channel, 2020 to 2024
    • Absolute $ Opportunity Analysis By Channel, 2025 to 2035
  10. Global Market Analysis 2020 to 2024 and Forecast 2025 to 2035, By Claim
    • Introduction / Key Findings
    • Historical Market Size Value (USD Million) Analysis By Claim, 2020 to 2024
    • Current and Future Market Size Value (USD Million) Analysis and Forecast By Claim, 2025 to 2035
      • SPF-included
      • Blue-light protection
      • Clean-label
      • Dermatologist-tested
    • Y-o-Y Growth Trend Analysis By Claim, 2020 to 2024
    • Absolute $ Opportunity Analysis By Claim, 2025 to 2035
  11. Global Market Analysis 2020 to 2024 and Forecast 2025 to 2035, By Region
    • Introduction
    • Historical Market Size Value (USD Million) Analysis By Region, 2020 to 2024
    • Current Market Size Value (USD Million) Analysis and Forecast By Region, 2025 to 2035
      • North America
      • Latin America
      • Europe
      • East Asia
      • South Asia & Pacific
      • Middle East and Africa
    • Market Attractiveness Analysis By Region
  12. North America Market Analysis 2020 to 2024 and Forecast 2025 to 2035, By Country
    • Historical Market Size Value (USD Million) Trend Analysis By Market Taxonomy, 2020 to 2024
    • Market Size Value (USD Million) Forecast By Market Taxonomy, 2025 to 2035
      • By Country
        • USA
        • Canada
      • By Photoreactive System
      • By Function
      • By Product Type
      • By Channel
      • By Claim
    • Market Attractiveness Analysis
      • By Country
      • By Photoreactive System
      • By Function
      • By Product Type
      • By Channel
      • By Claim
    • Key Takeaways
  13. Latin America Market Analysis 2020 to 2024 and Forecast 2025 to 2035, By Country
    • Historical Market Size Value (USD Million) Trend Analysis By Market Taxonomy, 2020 to 2024
    • Market Size Value (USD Million) Forecast By Market Taxonomy, 2025 to 2035
      • By Country
        • Brazil
        • Mexico
        • Colombia
        • Rest of Latin America
      • By Photoreactive System
      • By Function
      • By Product Type
      • By Channel
      • By Claim
    • Market Attractiveness Analysis
      • By Country
      • By Photoreactive System
      • By Function
      • By Product Type
      • By Channel
      • By Claim
    • Key Takeaways
  14. Europe Market Analysis 2020 to 2024 and Forecast 2025 to 2035, By Country
    • Historical Market Size Value (USD Million) Trend Analysis By Market Taxonomy, 2020 to 2024
    • Market Size Value (USD Million) Forecast By Market Taxonomy, 2025 to 2035
      • By Country
        • Germany
        • UK
        • France
        • Italy
        • Spain
        • Belgium
        • Netherlands
        • Nordic
        • Switzerland
        • Russia
        • Poland
        • Rest of Europe
      • By Photoreactive System
      • By Function
      • By Product Type
      • By Channel
      • By Claim
    • Market Attractiveness Analysis
      • By Country
      • By Photoreactive System
      • By Function
      • By Product Type
      • By Channel
      • By Claim
    • Key Takeaways
  15. East Asia Market Analysis 2020 to 2024 and Forecast 2025 to 2035, By Country
    • Historical Market Size Value (USD Million) Trend Analysis By Market Taxonomy, 2020 to 2024
    • Market Size Value (USD Million) Forecast By Market Taxonomy, 2025 to 2035
      • By Country
        • China
        • Japan
        • South Korea
      • By Photoreactive System
      • By Function
      • By Product Type
      • By Channel
      • By Claim
    • Market Attractiveness Analysis
      • By Country
      • By Photoreactive System
      • By Function
      • By Product Type
      • By Channel
      • By Claim
    • Key Takeaways
  16. South Asia & Pacific Market Analysis 2020 to 2024 and Forecast 2025 to 2035, By Country
    • Historical Market Size Value (USD Million) Trend Analysis By Market Taxonomy, 2020 to 2024
    • Market Size Value (USD Million) Forecast By Market Taxonomy, 2025 to 2035
      • By Country
        • India
        • Thailand
        • Malaysia
        • Indonesia
        • Singapore
        • Vietnam
        • Australia
        • New Zealand
        • Rest of South Asia
      • By Photoreactive System
      • By Function
      • By Product Type
      • By Channel
      • By Claim
    • Market Attractiveness Analysis
      • By Country
      • By Photoreactive System
      • By Function
      • By Product Type
      • By Channel
      • By Claim
    • Key Takeaways
  17. Middle East and Africa Market Analysis 2020 to 2024 and Forecast 2025 to 2035, By Country
    • Historical Market Size Value (USD Million) Trend Analysis By Market Taxonomy, 2020 to 2024
    • Market Size Value (USD Million) Forecast By Market Taxonomy, 2025 to 2035
      • By Country
        • Turkey
        • UAE
        • Saudi Arabia
        • Israel
        • Other GCC Countries
        • North Africa
        • South Africa
      • By Photoreactive System
      • By Function
      • By Product Type
      • By Channel
      • By Claim
    • Market Attractiveness Analysis
      • By Country
      • By Photoreactive System
      • By Function
      • By Product Type
      • By Channel
      • By Claim
    • Key Takeaways
  18. Key Countries Market Analysis
    • USA
      • Pricing Analysis
      • Market Share Analysis, 2024
        • By Photoreactive System
        • By Function
        • By Product Type
        • By Channel
        • By Claim
    • Canada
      • Pricing Analysis
      • Market Share Analysis, 2024
        • By Photoreactive System
        • By Function
        • By Product Type
        • By Channel
        • By Claim
    • Mexico
      • Pricing Analysis
      • Market Share Analysis, 2024
        • By Photoreactive System
        • By Function
        • By Product Type
        • By Channel
        • By Claim
    • Brazil
      • Pricing Analysis
      • Market Share Analysis, 2024
        • By Photoreactive System
        • By Function
        • By Product Type
        • By Channel
        • By Claim
    • Germany
      • Pricing Analysis
      • Market Share Analysis, 2024
        • By Photoreactive System
        • By Function
        • By Product Type
        • By Channel
        • By Claim
    • UK
      • Pricing Analysis
      • Market Share Analysis, 2024
        • By Photoreactive System
        • By Function
        • By Product Type
        • By Channel
        • By Claim
    • Italy
      • Pricing Analysis
      • Market Share Analysis, 2024
        • By Photoreactive System
        • By Function
        • By Product Type
        • By Channel
        • By Claim
    • Spain
      • Pricing Analysis
      • Market Share Analysis, 2024
        • By Photoreactive System
        • By Function
        • By Product Type
        • By Channel
        • By Claim
    • France
      • Pricing Analysis
      • Market Share Analysis, 2024
        • By Photoreactive System
        • By Function
        • By Product Type
        • By Channel
        • By Claim
    • India
      • Pricing Analysis
      • Market Share Analysis, 2024
        • By Photoreactive System
        • By Function
        • By Product Type
        • By Channel
        • By Claim
    • Australia & New Zealand
      • Pricing Analysis
      • Market Share Analysis, 2024
        • By Photoreactive System
        • By Function
        • By Product Type
        • By Channel
        • By Claim
    • China
      • Pricing Analysis
      • Market Share Analysis, 2024
        • By Photoreactive System
        • By Function
        • By Product Type
        • By Channel
        • By Claim
    • Japan
      • Pricing Analysis
      • Market Share Analysis, 2024
        • By Photoreactive System
        • By Function
        • By Product Type
        • By Channel
        • By Claim
    • South Korea
      • Pricing Analysis
      • Market Share Analysis, 2024
        • By Photoreactive System
        • By Function
        • By Product Type
        • By Channel
        • By Claim
    • Russia
      • Pricing Analysis
      • Market Share Analysis, 2024
        • By Photoreactive System
        • By Function
        • By Product Type
        • By Channel
        • By Claim
    • Poland
      • Pricing Analysis
      • Market Share Analysis, 2024
        • By Photoreactive System
        • By Function
        • By Product Type
        • By Channel
        • By Claim
    • Hungary
      • Pricing Analysis
      • Market Share Analysis, 2024
        • By Photoreactive System
        • By Function
        • By Product Type
        • By Channel
        • By Claim
    • Kingdom of Saudi Arabia
      • Pricing Analysis
      • Market Share Analysis, 2024
        • By Photoreactive System
        • By Function
        • By Product Type
        • By Channel
        • By Claim
    • South Africa
      • Pricing Analysis
      • Market Share Analysis, 2024
        • By Photoreactive System
        • By Function
        • By Product Type
        • By Channel
        • By Claim
  19. Market Structure Analysis
    • Competition Dashboard
    • Competition Benchmarking
    • Market Share Analysis of Top Players
      • By Regional
      • By Photoreactive System
      • By Function
      • By Product Type
      • By Channel
      • By Claim
  20. Competition Analysis
    • Competition Deep Dive
      • Shiseido
        • Overview
        • Product Portfolio
        • Profitability by Market Segments (Product/Age /Sales Channel/Region)
        • Sales Footprint
        • Strategy Overview
        • L’Oréal
        • Clarins
        • Estée Lauder
        • La Roche-Posay
        • Kiehl’s
        • Olay
        • Murad
        • Supergoop!
        • Dr. Jart+
    • Assumptions & Acronyms Used
    • Research Methodology

List of Tables

  • Table 1: Global Market Value (USD Million) Forecast by Region, 2020-2035
  • Table 2: Global Market Value (USD Million) Forecast by Photoreactive System, 2020-2035
  • Table 3: Global Market Value (USD Million) Forecast by Function, 2020-2035
  • Table 4: Global Market Value (USD Million) Forecast by Product Type, 2020-2035
  • Table 5: Global Market Value (USD Million) Forecast by Channel, 2020-2035
  • Table 6: Global Market Value (USD Million) Forecast by Claim, 2020-2035
  • Table 7: North America Market Value (USD Million) Forecast by Country, 2020-2035
  • Table 8: North America Market Value (USD Million) Forecast by Photoreactive System, 2020-2035
  • Table 9: North America Market Value (USD Million) Forecast by Function, 2020-2035
  • Table 10: North America Market Value (USD Million) Forecast by Product Type, 2020-2035
  • Table 11: North America Market Value (USD Million) Forecast by Channel, 2020-2035
  • Table 12: North America Market Value (USD Million) Forecast by Claim, 2020-2035
  • Table 13: Latin America Market Value (USD Million) Forecast by Country, 2020-2035
  • Table 14: Latin America Market Value (USD Million) Forecast by Photoreactive System, 2020-2035
  • Table 15: Latin America Market Value (USD Million) Forecast by Function, 2020-2035
  • Table 16: Latin America Market Value (USD Million) Forecast by Product Type, 2020-2035
  • Table 17: Latin America Market Value (USD Million) Forecast by Channel, 2020-2035
  • Table 18: Latin America Market Value (USD Million) Forecast by Claim, 2020-2035
  • Table 19: Europe Market Value (USD Million) Forecast by Country, 2020-2035
  • Table 20: Europe Market Value (USD Million) Forecast by Photoreactive System, 2020-2035
  • Table 21: Europe Market Value (USD Million) Forecast by Function, 2020-2035
  • Table 22: Europe Market Value (USD Million) Forecast by Product Type, 2020-2035
  • Table 23: Europe Market Value (USD Million) Forecast by Channel, 2020-2035
  • Table 24: Europe Market Value (USD Million) Forecast by Claim, 2020-2035
  • Table 25: East Asia Market Value (USD Million) Forecast by Country, 2020-2035
  • Table 26: East Asia Market Value (USD Million) Forecast by Photoreactive System, 2020-2035
  • Table 27: East Asia Market Value (USD Million) Forecast by Function, 2020-2035
  • Table 28: East Asia Market Value (USD Million) Forecast by Product Type, 2020-2035
  • Table 29: East Asia Market Value (USD Million) Forecast by Channel, 2020-2035
  • Table 30: East Asia Market Value (USD Million) Forecast by Claim, 2020-2035
  • Table 31: South Asia & Pacific Market Value (USD Million) Forecast by Country, 2020-2035
  • Table 32: South Asia & Pacific Market Value (USD Million) Forecast by Photoreactive System, 2020-2035
  • Table 33: South Asia & Pacific Market Value (USD Million) Forecast by Function, 2020-2035
  • Table 34: South Asia & Pacific Market Value (USD Million) Forecast by Product Type, 2020-2035
  • Table 35: South Asia & Pacific Market Value (USD Million) Forecast by Channel, 2020-2035
  • Table 36: South Asia & Pacific Market Value (USD Million) Forecast by Claim, 2020-2035
  • Table 37: Middle East and Africa Market Value (USD Million) Forecast by Country, 2020-2035
  • Table 38: Middle East and Africa Market Value (USD Million) Forecast by Photoreactive System, 2020-2035
  • Table 39: Middle East and Africa Market Value (USD Million) Forecast by Function, 2020-2035
  • Table 40: Middle East and Africa Market Value (USD Million) Forecast by Product Type, 2020-2035
  • Table 41: Middle East and Africa Market Value (USD Million) Forecast by Channel, 2020-2035
  • Table 42: Middle East and Africa Market Value (USD Million) Forecast by Claim, 2020-2035

List of Figures

  • Figure 1: Global Market Pricing Analysis
  • Figure 2: Global Market Value (USD Million) Forecast 2020-2035
  • Figure 3: Global Market Value Share and BPS Analysis by Photoreactive System, 2025 and 2035
  • Figure 4: Global Market Y-o-Y Growth Comparison by Photoreactive System, 2025-2035
  • Figure 5: Global Market Attractiveness Analysis by Photoreactive System
  • Figure 6: Global Market Value Share and BPS Analysis by Function, 2025 and 2035
  • Figure 7: Global Market Y-o-Y Growth Comparison by Function, 2025-2035
  • Figure 8: Global Market Attractiveness Analysis by Function
  • Figure 9: Global Market Value Share and BPS Analysis by Product Type, 2025 and 2035
  • Figure 10: Global Market Y-o-Y Growth Comparison by Product Type, 2025-2035
  • Figure 11: Global Market Attractiveness Analysis by Product Type
  • Figure 12: Global Market Value Share and BPS Analysis by Channel, 2025 and 2035
  • Figure 13: Global Market Y-o-Y Growth Comparison by Channel, 2025-2035
  • Figure 14: Global Market Attractiveness Analysis by Channel
  • Figure 15: Global Market Value Share and BPS Analysis by Claim, 2025 and 2035
  • Figure 16: Global Market Y-o-Y Growth Comparison by Claim, 2025-2035
  • Figure 17: Global Market Attractiveness Analysis by Claim
  • Figure 18: Global Market Value (USD Million) Share and BPS Analysis by Region, 2025 and 2035
  • Figure 19: Global Market Y-o-Y Growth Comparison by Region, 2025-2035
  • Figure 20: Global Market Attractiveness Analysis by Region
  • Figure 21: North America Market Incremental $ Opportunity, 2025-2035
  • Figure 22: Latin America Market Incremental $ Opportunity, 2025-2035
  • Figure 23: Europe Market Incremental $ Opportunity, 2025-2035
  • Figure 24: East Asia Market Incremental $ Opportunity, 2025-2035
  • Figure 25: South Asia & Pacific Market Incremental $ Opportunity, 2025-2035
  • Figure 26: Middle East and Africa Market Incremental $ Opportunity, 2025-2035
  • Figure 27: North America Market Value Share and BPS Analysis by Country, 2025 and 2035
  • Figure 28: North America Market Value Share and BPS Analysis by Photoreactive System, 2025 and 2035
  • Figure 29: North America Market Y-o-Y Growth Comparison by Photoreactive System, 2025-2035
  • Figure 30: North America Market Attractiveness Analysis by Photoreactive System
  • Figure 31: North America Market Value Share and BPS Analysis by Function, 2025 and 2035
  • Figure 32: North America Market Y-o-Y Growth Comparison by Function, 2025-2035
  • Figure 33: North America Market Attractiveness Analysis by Function
  • Figure 34: North America Market Value Share and BPS Analysis by Product Type, 2025 and 2035
  • Figure 35: North America Market Y-o-Y Growth Comparison by Product Type, 2025-2035
  • Figure 36: North America Market Attractiveness Analysis by Product Type
  • Figure 37: North America Market Value Share and BPS Analysis by Channel, 2025 and 2035
  • Figure 38: North America Market Y-o-Y Growth Comparison by Channel, 2025-2035
  • Figure 39: North America Market Attractiveness Analysis by Channel
  • Figure 40: North America Market Value Share and BPS Analysis by Claim, 2025 and 2035
  • Figure 41: North America Market Y-o-Y Growth Comparison by Claim, 2025-2035
  • Figure 42: North America Market Attractiveness Analysis by Claim
  • Figure 43: Latin America Market Value Share and BPS Analysis by Country, 2025 and 2035
  • Figure 44: Latin America Market Value Share and BPS Analysis by Photoreactive System, 2025 and 2035
  • Figure 45: Latin America Market Y-o-Y Growth Comparison by Photoreactive System, 2025-2035
  • Figure 46: Latin America Market Attractiveness Analysis by Photoreactive System
  • Figure 47: Latin America Market Value Share and BPS Analysis by Function, 2025 and 2035
  • Figure 48: Latin America Market Y-o-Y Growth Comparison by Function, 2025-2035
  • Figure 49: Latin America Market Attractiveness Analysis by Function
  • Figure 50: Latin America Market Value Share and BPS Analysis by Product Type, 2025 and 2035
  • Figure 51: Latin America Market Y-o-Y Growth Comparison by Product Type, 2025-2035
  • Figure 52: Latin America Market Attractiveness Analysis by Product Type
  • Figure 53: Latin America Market Value Share and BPS Analysis by Channel, 2025 and 2035
  • Figure 54: Latin America Market Y-o-Y Growth Comparison by Channel, 2025-2035
  • Figure 55: Latin America Market Attractiveness Analysis by Channel
  • Figure 56: Latin America Market Value Share and BPS Analysis by Claim, 2025 and 2035
  • Figure 57: Latin America Market Y-o-Y Growth Comparison by Claim, 2025-2035
  • Figure 58: Latin America Market Attractiveness Analysis by Claim
  • Figure 59: Europe Market Value Share and BPS Analysis by Country, 2025 and 2035
  • Figure 60: Europe Market Value Share and BPS Analysis by Photoreactive System, 2025 and 2035
  • Figure 61: Europe Market Y-o-Y Growth Comparison by Photoreactive System, 2025-2035
  • Figure 62: Europe Market Attractiveness Analysis by Photoreactive System
  • Figure 63: Europe Market Value Share and BPS Analysis by Function, 2025 and 2035
  • Figure 64: Europe Market Y-o-Y Growth Comparison by Function, 2025-2035
  • Figure 65: Europe Market Attractiveness Analysis by Function
  • Figure 66: Europe Market Value Share and BPS Analysis by Product Type, 2025 and 2035
  • Figure 67: Europe Market Y-o-Y Growth Comparison by Product Type, 2025-2035
  • Figure 68: Europe Market Attractiveness Analysis by Product Type
  • Figure 69: Europe Market Value Share and BPS Analysis by Channel, 2025 and 2035
  • Figure 70: Europe Market Y-o-Y Growth Comparison by Channel, 2025-2035
  • Figure 71: Europe Market Attractiveness Analysis by Channel
  • Figure 72: Europe Market Value Share and BPS Analysis by Claim, 2025 and 2035
  • Figure 73: Europe Market Y-o-Y Growth Comparison by Claim, 2025-2035
  • Figure 74: Europe Market Attractiveness Analysis by Claim
  • Figure 75: East Asia Market Value Share and BPS Analysis by Country, 2025 and 2035
  • Figure 76: East Asia Market Value Share and BPS Analysis by Photoreactive System, 2025 and 2035
  • Figure 77: East Asia Market Y-o-Y Growth Comparison by Photoreactive System, 2025-2035
  • Figure 78: East Asia Market Attractiveness Analysis by Photoreactive System
  • Figure 79: East Asia Market Value Share and BPS Analysis by Function, 2025 and 2035
  • Figure 80: East Asia Market Y-o-Y Growth Comparison by Function, 2025-2035
  • Figure 81: East Asia Market Attractiveness Analysis by Function
  • Figure 82: East Asia Market Value Share and BPS Analysis by Product Type, 2025 and 2035
  • Figure 83: East Asia Market Y-o-Y Growth Comparison by Product Type, 2025-2035
  • Figure 84: East Asia Market Attractiveness Analysis by Product Type
  • Figure 85: East Asia Market Value Share and BPS Analysis by Channel, 2025 and 2035
  • Figure 86: East Asia Market Y-o-Y Growth Comparison by Channel, 2025-2035
  • Figure 87: East Asia Market Attractiveness Analysis by Channel
  • Figure 88: East Asia Market Value Share and BPS Analysis by Claim, 2025 and 2035
  • Figure 89: East Asia Market Y-o-Y Growth Comparison by Claim, 2025-2035
  • Figure 90: East Asia Market Attractiveness Analysis by Claim
  • Figure 91: South Asia & Pacific Market Value Share and BPS Analysis by Country, 2025 and 2035
  • Figure 92: South Asia & Pacific Market Value Share and BPS Analysis by Photoreactive System, 2025 and 2035
  • Figure 93: South Asia & Pacific Market Y-o-Y Growth Comparison by Photoreactive System, 2025-2035
  • Figure 94: South Asia & Pacific Market Attractiveness Analysis by Photoreactive System
  • Figure 95: South Asia & Pacific Market Value Share and BPS Analysis by Function, 2025 and 2035
  • Figure 96: South Asia & Pacific Market Y-o-Y Growth Comparison by Function, 2025-2035
  • Figure 97: South Asia & Pacific Market Attractiveness Analysis by Function
  • Figure 98: South Asia & Pacific Market Value Share and BPS Analysis by Product Type, 2025 and 2035
  • Figure 99: South Asia & Pacific Market Y-o-Y Growth Comparison by Product Type, 2025-2035
  • Figure 100: South Asia & Pacific Market Attractiveness Analysis by Product Type
  • Figure 101: South Asia & Pacific Market Value Share and BPS Analysis by Channel, 2025 and 2035
  • Figure 102: South Asia & Pacific Market Y-o-Y Growth Comparison by Channel, 2025-2035
  • Figure 103: South Asia & Pacific Market Attractiveness Analysis by Channel
  • Figure 104: South Asia & Pacific Market Value Share and BPS Analysis by Claim, 2025 and 2035
  • Figure 105: South Asia & Pacific Market Y-o-Y Growth Comparison by Claim, 2025-2035
  • Figure 106: South Asia & Pacific Market Attractiveness Analysis by Claim
  • Figure 107: Middle East and Africa Market Value Share and BPS Analysis by Country, 2025 and 2035
  • Figure 108: Middle East and Africa Market Value Share and BPS Analysis by Photoreactive System, 2025 and 2035
  • Figure 109: Middle East and Africa Market Y-o-Y Growth Comparison by Photoreactive System, 2025-2035
  • Figure 110: Middle East and Africa Market Attractiveness Analysis by Photoreactive System
  • Figure 111: Middle East and Africa Market Value Share and BPS Analysis by Function, 2025 and 2035
  • Figure 112: Middle East and Africa Market Y-o-Y Growth Comparison by Function, 2025-2035
  • Figure 113: Middle East and Africa Market Attractiveness Analysis by Function
  • Figure 114: Middle East and Africa Market Value Share and BPS Analysis by Product Type, 2025 and 2035
  • Figure 115: Middle East and Africa Market Y-o-Y Growth Comparison by Product Type, 2025-2035
  • Figure 116: Middle East and Africa Market Attractiveness Analysis by Product Type
  • Figure 117: Middle East and Africa Market Value Share and BPS Analysis by Channel, 2025 and 2035
  • Figure 118: Middle East and Africa Market Y-o-Y Growth Comparison by Channel, 2025-2035
  • Figure 119: Middle East and Africa Market Attractiveness Analysis by Channel
  • Figure 120: Middle East and Africa Market Value Share and BPS Analysis by Claim, 2025 and 2035
  • Figure 121: Middle East and Africa Market Y-o-Y Growth Comparison by Claim, 2025-2035
  • Figure 122: Middle East and Africa Market Attractiveness Analysis by Claim
  • Figure 123: Global Market - Tier Structure Analysis
  • Figure 124: Global Market - Company Share Analysis

Frequently Asked Questions

How big is the Light-Activated Anti-Pollution Skincare Market in 2025?

The global Light-Activated Anti-Pollution Skincare Market is estimated to be valued at USD 1,452.4 million in 2025.

What will be the size of the Light-Activated Anti-Pollution Skincare Market in 2035?

The market size for the Light-Activated Anti-Pollution Skincare Market is projected to reach USD 4,902.6 million by 2035.

How much will be the Light-Activated Anti-Pollution Skincare Market growth between 2025 and 2035?

The Light-Activated Anti-Pollution Skincare Market is expected to grow at a CAGR of 12.9% between 2025 and 2035.

What are the key product types in the Light-Activated Anti-Pollution Skincare Market?

The key product types in the Light-Activated Anti-Pollution Skincare Market are moisturizers with SPF, serums, mists/essences, and primers.

Which function segment is projected to contribute significant share in the Light-Activated Anti-Pollution Skincare Market in 2025?

In terms of function, the anti-pollution shield segment is projected to command 55% share in the Light-Activated Anti-Pollution Skincare Market in 2025.

Explore Similar Insights

Future Market Insights

Light-Activated Anti-Pollution Skincare Market

Chat With

MaRIA

Hi There, I am MaRIA, Your Market Research Intelligence Assistant. How may I help you?