Buffering Skincare Products Market Size and Share Forecast Outlook 2025 to 2035

The Buffering Skincare Products Market is expected to record a valuation of USD 3,605.4 million in 2025 and USD 7,906.8 million in 2035, with an increase of USD 4,301.4 million, which equals a growth of 193% over the decade. The overall expansion represents a CAGR of 8.2% and a 2X increase in market size.
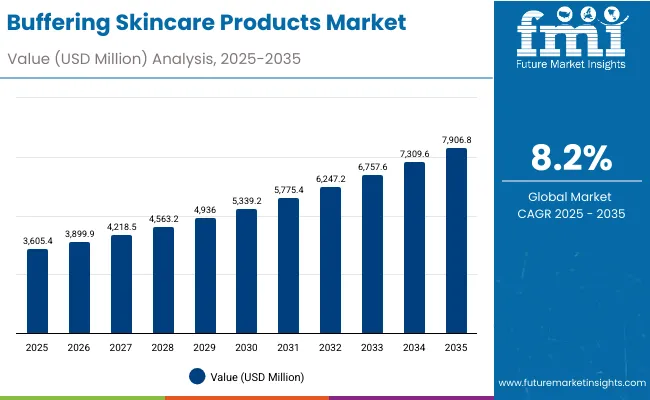
Quick Stats for Buffering Skincare Products Market

  • Buffering Skincare Products Market Value (2025): USD 3,605.4 million
  • Buffering Skincare Products Market Forecast Value (2035): USD 7,906.8 million
  • Buffering Skincare Products Market Forecast CAGR (2025 to 2035): 8.2%
  • Leading Segment in Buffering Skincare Products Market in 2025: pH-balancing creams (highest value share)
  • Key Growth Regions in the Buffering Skincare Products Market: Asia-Pacific, North America, Europe
  • Top Key Players in Buffering Skincare Products Market: La Roche-Posay, Paula’s Choice, CeraVe, Clinique, Bioderma, Avene, Murad, Eucerin, Kiehl’s, Dermalogica

Buffering Skincare Products Market

Buffering Skincare Products Market Key Takeaways

Metric Value
Buffering Skincare Products Market Estimated Value (2025E) USD 3,605.4 million
Buffering Skincare Products Market Forecast Value (2035F) USD 7,906.8 million
Forecast CAGR (2025 to 2035) 8.2%

During the first five-year period from 2025 to 2030, the market increases from USD 3,605.4 million to USD 5,339.2 million, adding USD 1,733.8 million, which accounts for 40% of the total decade growth. This phase records steady adoption of pH-balancing creams and sodium bicarbonate-based formulations, driven by rising awareness of pH restoration and skin barrier repair in premium skincare. Women’s skincare products dominate this period as they cater to over 58% of total market demand.

The second half from 2030 to 2035 contributes USD 2,567.6 million, equal to 60% of total growth, as the market jumps from USD 5,339.2 million to USD 7,906.8 million. This acceleration is powered by wider acceptance of sensitive-skin balance formulations, increased sales through e-commerce channels, and rising demand for amino acid buffer systems in dermatological lines. Asia-Pacific markets, led by China and India, together capture a growing share above 40% by the end of the decade. Product innovation in post-procedure and pH-stabilizing creams continues to drive long-term expansion.

From 2020 to 2024, the Buffering Skincare Products Market witnessed consistent expansion, supported by growing consumer preference for mild, pH-stabilizing, and sensitive-skin formulations. During this period, the competitive landscape was dominated by dermatology-led skincare brands, collectively accounting for nearly 70% of global revenue. Brands such as La Roche-Posay, CeraVe, and Paula’s Choice strengthened their foothold in pharmacy and e-commerce channels, emphasizing dermatologically tested formulations, microbiome protection, and acid mantle repair. The market’s early growth phase relied primarily on cream-based and toning formats, while soothing gels and mist formulations remained niche.

Demand for Buffering Skincare Products is expected to expand to USD 7,906.8 million by 2035, as consumer awareness of skin pH balance and barrier health accelerates globally. The revenue mix is shifting toward amino acid and lactic acid buffer systems, integrated with sensitive-skin and post-procedure care routines. Traditional clinical brands are now facing competition from cosmeceutical startups leveraging AI-driven skin diagnostics, customized formulation platforms, and subscription-based skincare ecosystems. The competitive advantage is moving from single-ingredient innovation toward personalized skin biology mapping, digital skincare monitoring, and long-term treatment adherence models.

Why the Buffering Skincare Products Market is growing?

Growing consumer awareness around maintaining optimal skin pH and strengthening the acid mantle is driving sustained adoption of buffering skincare products. With increasing cases of sensitivity and irritation caused by pollution, stress, and over-exfoliation, consumers are shifting to pH-balanced creams, toners, and cleansers that restore skin equilibrium. Dermatologist-endorsed brands and clinical formulations emphasizing gentle, non-stripping ingredients such as sodium bicarbonate and amino acid buffers are gaining prominence across both premium and mass-market categories globally.

The Asia-Pacific region, particularly China and India, is witnessing rapid growth due to strong online retail penetration and heightened consumer education on skincare science. Affordable access to dermatologist-approved buffering products through e-commerce platforms has significantly widened the consumer base. Furthermore, rising disposable incomes, urbanization, and an expanding middle-class population are fueling demand for clinically tested, pH-stabilizing products designed for sensitive and post-procedure skin care, strengthening long-term market expansion in emerging economies.

Segmental Analysis

The Buffering Skincare Products Market is segmented by product type, key ingredients, skin concern, distribution channel, end user, and region. Product types include pH-balancing creams, toners & mists, face cleansers, and soothing gels each serving distinct skincare routines focused on pH restoration and barrier protection. Key ingredient segmentation covers sodium bicarbonate, amino acid buffers, citrate buffers, and lactic acid blends, representing diverse formulation bases.

By skin concern, the market addresses sensitive-skin balance, post-procedure care, and acid mantle restoration. Major distribution channels include e-commerce, pharmacies/drugstores, specialty beauty retail, and dermatology clinics. End users span women, men, teens, and sensitive-skin consumers, with regional coverage extending across North America, Europe, East Asia, South Asia & Pacific, Latin America, and the Middle East & Africa.
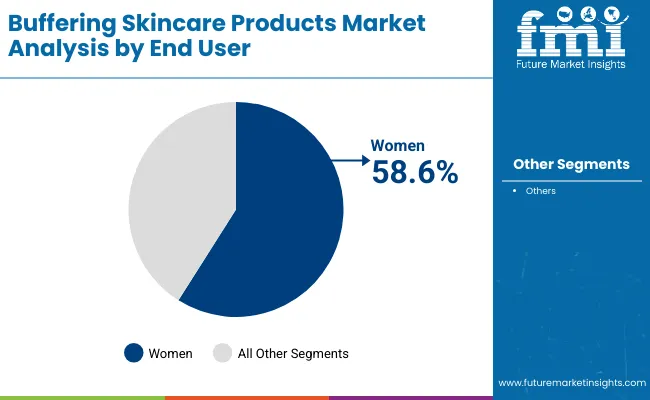
Insights into the End User Segment with Women Leading in Market Share

Buffering Skincare Products Market By End User

End User Value Share% 2025
Women 58.6%
Others 41.4%

The women’s segment is anticipated to command 58.6% of the Buffering Skincare Products Market revenue in 2025, maintaining its dominance throughout the forecast period. Growth is primarily attributed to increasing consumer awareness of skin pH balance, heightened sensitivity concerns, and the growing preference for dermatologically tested, pH-stabilizing formulations. Women are the primary consumers of premium and clinical skincare lines emphasizing acid mantle restoration and post-procedure recovery. E-commerce platforms and social media-driven beauty education have further accelerated adoption, with a noticeable rise in repeat purchases across urban markets.

Manufacturers are increasingly customizing formulations to address hormonal fluctuations, environmental stressors, and ingredient transparency factors influencing purchase behavior. This segment’s leadership is reinforced by strong participation from professional women aged 25-45, who prioritize functional skincare backed by clinical efficacy. Consequently, the women’s category remains the largest and most influential demographic shaping future growth in the buffering skincare landscape.
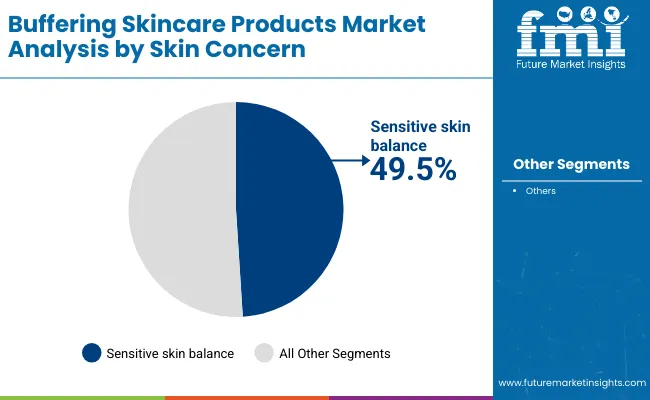
Insights into the Skin Concern Segment with Sensitive Skin Balance Dominating the Demand

Buffering Skincare Products Market By Skin Concern

Skin Concern Value Share% 2025
Sensitive skin balance 49.5%
Others 50.5%

The sensitive-skin balance segment is expected to hold 49.5% of the Buffering Skincare Products Market share in 2025, driven by rising global incidences of sensitivity, dryness, and barrier impairment caused by pollution, stress, and excessive exfoliation. Consumers increasingly seek pH-balanced formulations that restore the skin’s natural equilibrium and prevent irritation, leading to higher adoption of products formulated with amino acid and bicarbonate buffers.

This category’s strength also stems from dermatologists’ recommendations for gentle, non-stripping cleansers, toners, and creams suited for reactive skin types. As awareness of the acid mantle’s role in overall skin health deepens, demand for scientifically formulated buffering products continues to expand. Brands are innovating with lightweight, microbiome-friendly ingredients and post-procedure care solutions tailored for sensitive skin recovery. Consequently, the sensitive-skin balance segment is expected to retain leadership throughout the forecast period, establishing itself as a core growth driver within the global market.
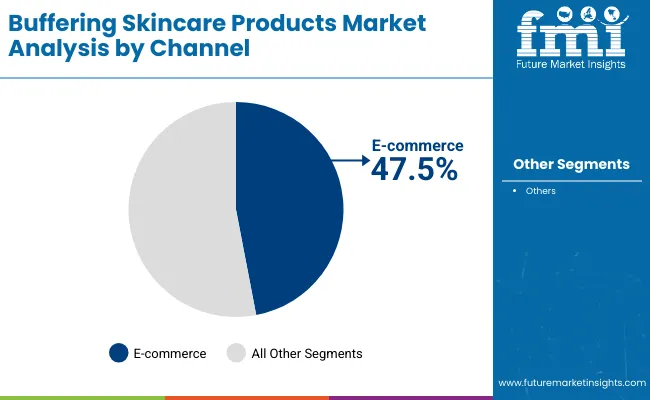
Insights into the Channel Segment with E-commerce Leading Market Expansion

Buffering Skincare Products Market By Channel

Channel Value Share% 2025
E-commerce 47.5%
Others 52.5%

The e-commerce segment is projected to account for 47.5% of the Buffering Skincare Products Market revenue in 2025, establishing it as the fastest-growing distribution channel. This growth is driven by rising consumer preference for online beauty retail platforms, increased accessibility to dermatologist-recommended products, and the availability of detailed ingredient information supporting purchase decisions. Digital-first skincare brands have accelerated adoption through personalized quizzes, subscription models, and influencer-driven awareness campaigns.

Convenience, wider product assortments, and frequent promotional offers have further strengthened consumer migration from traditional retail to online platforms. The segment also benefits from advanced logistics networks that ensure faster deliveries and secure packaging of temperature-sensitive skincare products. With consumers valuing transparency and expert-backed reviews, e-commerce platforms have become a trusted source for premium and clinical-grade buffering skincare lines. Consequently, online channels are expected to maintain strong momentum, driving consistent global growth through 2035.

What are the Drivers, Restraints, and Key Trends of the Buffering Skincare Products Market?

Growing Awareness of Skin pH Balance and Acid Mantle Protection

The rising understanding of skin biology, particularly the importance of maintaining optimal pH levels for barrier integrity, is fueling market growth. Consumers are increasingly aware that harsh cleansers and exfoliants can disrupt the acid mantle, leading to irritation and breakouts. Consequently, demand for buffering skincare products especially those containing mild, pH-balancing ingredients such as amino acid buffers and sodium bicarbonate is surging. Dermatologists and aesthetic clinics are further promoting pH-restoring creams and toners, driving adoption across both premium and mass-market skincare categories globally.

Expansion of Dermatology-Backed and Clinical Skincare Lines

The market is benefiting from the rapid growth of dermatologist-endorsed and clinically formulated skincare brands emphasizing barrier repair and gentle efficacy. Consumers now favor products validated through dermatological testing and minimal-irritation claims. Brands such as La Roche-Posay, CeraVe, and Paula’s Choice are expanding global reach through pharmacies and e-commerce channels, offering formulations with proven acid-buffering technologies. This clinical credibility enhances consumer trust, particularly among sensitive-skin users. As post-procedure and medical skincare become mainstream, buffering formulations are expected to remain integral to advanced dermatological regimens worldwide.

Limited Consumer Understanding of Buffering Ingredients

Despite growing awareness, many consumers remain unfamiliar with the science behind buffering agents and their function in maintaining skin pH stability. Misinterpretations surrounding "acidic" or "alkaline" formulations often discourage purchase decisions, especially among new users. Inadequate labeling transparency and inconsistent ingredient education across brands further limit wider adoption. This knowledge gap hampers demand growth in emerging markets, where consumer preferences still lean toward fragrance-rich or cosmetic skincare rather than functionally balanced formulations. Overcoming this restraint requires focused educational campaigns and clearer on-pack communication about the role of buffering agents in long-term skin health.

Integration of AI and Skin Microbiome Diagnostics in Personalized Skincare

The Buffering Skincare Products Market is witnessing a technological shift toward personalized skincare supported by AI-driven diagnostics and microbiome analysis. Digital skin-mapping tools and smartphone-based pH analyzers are enabling consumers to select products precisely tailored to their skin’s sensitivity and acidity levels. Brands are leveraging this data to design customized buffering formulations that maintain the natural microbiome while restoring barrier function. This convergence of digital diagnostics with dermatological science is transforming skincare from generalized routines to individualized regimens, marking a major step toward intelligent, precision-based skincare solutions.
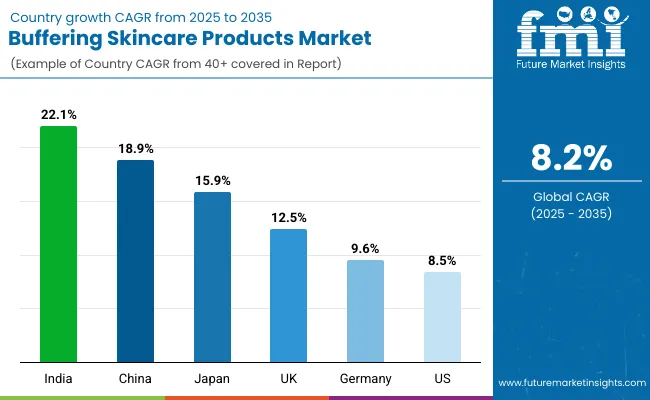
Analysis of Buffering Skincare Products Market By Key Countries

Buffering Skincare Products Market By Country

Countries Estimated CAGR (2025 to 2035)
China 18.9%
USA 8.5%
India 22.1%
UK 12.5%
Germany 9.6%
Japan 15.9%

The global Buffering Skincare Products Market shows strong regional variation in adoption and growth, primarily influenced by consumer awareness, dermatological infrastructure, and product availability. Asia-Pacific emerges as the fastest-growing region, led by India (22.1%) and China (18.9%), driven by rapid skincare market expansion, digital beauty retail penetration, and growing demand for sensitive-skin and pH-balancing formulations. India’s younger demographic and high smartphone usage support accelerated adoption through e-commerce and influencer-driven education.

China benefits from rising disposable incomes, local K-beauty influence, and a preference for clinical-grade formulations. Japan (15.9%) sustains growth through innovations in amino acid buffer systems and probiotic-based skincare. Europe, led by the UK (12.5%) and Germany (9.6%), maintains stable demand supported by established pharmaceutical skincare brands and strict regulatory frameworks. North America, anchored by the USA (8.5%), shows steady expansion through pharmacy-led distribution and clinical endorsement, emphasizing dermatologist-tested, pH-stabilizing products for sensitive skin.
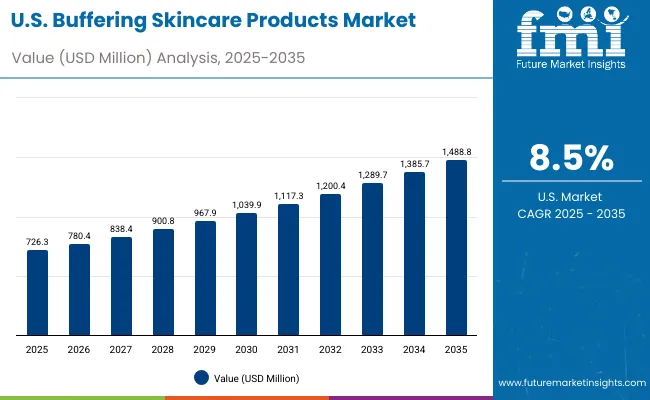
Sales Outlook for Buffering Skincare Products in the United States

Buffering Skincare Products Market Usa

Year USA Buffering Skincare Products Market (USD Million)
2025 726.3
2026 780.4
2027 838.4
2028 900.8
2029 967.9
2030 1039.9
2031 1117.3
2032 1200.4
2033 1289.7
2034 1385.7
2035 1488.8

The Buffering Skincare Products Market in the United States is projected to grow at a CAGR of 8.5% from 2025 to 2035, driven by the increasing consumer preference for dermatologist-approved, pH-stabilizing skincare formulations. Growth is fueled by rising concerns over skin sensitivity, pollution exposure, and barrier disruption caused by over-exfoliation. Dermatology clinics and pharmacy-led brands such as CeraVe, La Roche-Posay, and Clinique are leading with formulations that balance skin pH and restore the acid mantle. The expansion of e-commerce and subscription skincare platforms has further boosted accessibility. Consumers are increasingly adopting daily pH-balancing creams and soothing cleansers as part of minimal, science-backed routines.

  • Post-procedure and barrier-restoring creams are key growth drivers.
  • Dermatology-led brands dominate both retail and professional channels.
  • E-commerce and subscription models enhance customer retention and category visibility.

Growth and Expansion Outlook for Buffering Skincare Products Market in the United Kingdom

The Buffering Skincare Products Market in the United States is projected to grow at a CAGR of 8.5% from 2025 to 2035, supported by a strong preference for dermatologist-approved and clinically tested formulations. Demand is led by rising skin sensitivity awareness, post-procedure care routines, and growing usage of pH-balancing creams in daily skincare. Consumers increasingly favor gentle, barrier-restoring products that prevent irritation caused by environmental stress and over-exfoliation. The expansion of dermatology clinics and pharmacy-led skincare brands such as CeraVe, Clinique, and Paula’s Choice has further enhanced accessibility. The USA market also benefits from digital skincare diagnostics, subscription-based e-commerce models, and influencer-driven awareness campaigns targeting sensitive-skin users.

  • Post-procedure and acid mantle-restoring creams are major use cases driving adoption.
  • Dermatology clinics are integrating buffering products into medical skincare regimens.
  • E-commerce and pharmacy retail channels are expanding distribution reach nationwide.

Growth and Expansion Outlook for Buffering Skincare Products Market in India

India is witnessing one of the fastest growth trajectories in the Buffering Skincare Products Market, forecast to expand at a CAGR of 22.1% through 2035. Rapid urbanization, rising disposable incomes, and increased skincare awareness in tier-2 and tier-3 cities are driving widespread adoption. Consumers are shifting from conventional cosmetics to clinically tested, pH-balancing formulations addressing sensitivity, acne, and pollution-related skin issues.

Domestic and international brands are expanding presence through e-commerce platforms, dermatology clinics, and pharmacy outlets. Educational content on pH balance and barrier care shared via social media influencers is further stimulating consumer engagement. India’s young demographic, strong digital penetration, and preference for affordable premium skincare products continue to accelerate demand.

  • E-commerce growth and influencer-led marketing are expanding skincare accessibility in smaller cities.
  • Dermatology clinics are promoting pH-stabilizing creams and cleansers for sensitive skin.
  • Affordable, clinically proven formulations are boosting adoption among first-time skincare buyers.

Sales Outlook for Buffering Skincare Products in China

The Buffering Skincare Products Market in China is projected to grow at a CAGR of 18.9% from 2025 to 2035, the highest among major economies. Growth is driven by rapid consumer adoption of pH-balancing and sensitive-skin formulations, alongside increasing preference for dermatologist-endorsed and clinically validated skincare products. Local skincare brands are innovating with amino acid and lactic acid buffer systems, offering affordable yet effective solutions for post-procedure and barrier-repair needs.

E-commerce giants such as Tmall and JD.com are reshaping distribution dynamics, with influencer collaborations amplifying brand visibility. Urban consumers are favoring lightweight formulations suitable for humid climates, while younger demographics drive experimentation with hybrid cleansing and toning routines. Rising disposable incomes, improved dermatological access, and growing awareness of acid mantle protection are reinforcing market expansion.
  • E-commerce and social media platforms are accelerating domestic brand reach.
  • Demand for pH-balancing and barrier-restoring creams is rapidly increasing.
  • Affordable, clinically proven formulations are strengthening local market competitiveness.

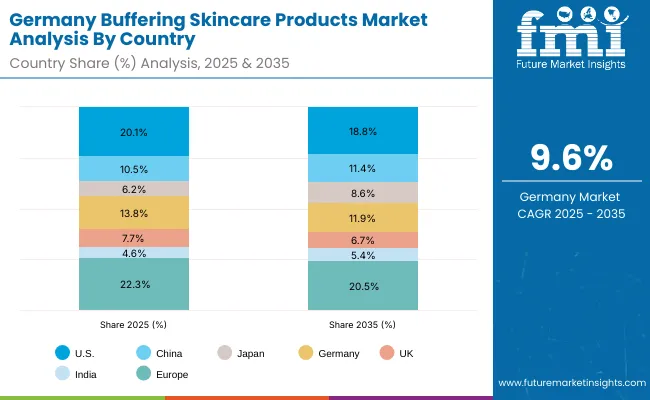
In-depth Analysis of Buffering Skincare Products in Germany

Buffering Skincare Products Market Germany

Countries 2025 Share (%)
USA 20.1%
China 10.5%
Japan 6.2%
Germany 13.8%
UK 7.7%
India 4.6%
Countries 2035 Share (%)
USA 18.8%
China 11.4%
Japan 8.6%
Germany 11.9%
UK 6.7%
India 5.4%

The Buffering Skincare Products Market in Germany is projected to grow at a CAGR of 9.6% from 2025 to 2035, supported by the country’s strong pharmaceutical and dermocosmetic industry. German consumers show a distinct preference for clinically validated, fragrance-free, and dermatologically tested formulations that align with EU cosmetic safety standards. Growth is being reinforced by the dominance of pharmacy and drugstore chains such as DM, Rossmann, and Müller, which serve as key distribution channels for medical skincare brands including Eucerin, La Roche-Posay, and Bioderma.

Awareness of acid mantle protection, pH regulation, and microbiome balance is expanding rapidly through dermatologist education programs and product labeling mandates. The country’s emphasis on sustainability and minimalistic formulations has also fueled the rise of eco-certified, vegan, and pH-stabilizing skincare lines.
  • Pharmacy-led distribution is driving demand for dermocosmetic buffering products.
  • German consumers favor clinically tested, hypoallergenic formulations.
  • Sustainability and ingredient transparency strengthen long-term category growth.

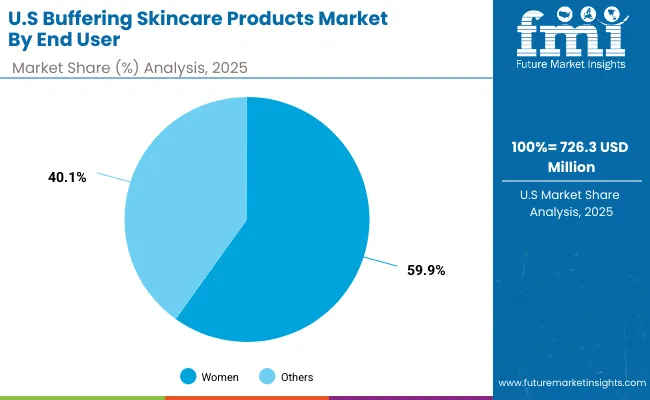
Growth Outlook for Buffering Skincare Products Market in USA

Buffering Skincare Products Market Usa 2

USA by End User Value Share% 2025
Women 59.9%
Others 40.1%

The Buffering Skincare Products Market in the United States is valued at USD 726.3 million in 2025, with women accounting for the dominant 59.9% share of total demand. Market expansion is supported by growing awareness of pH balance, acid mantle protection, and the need for dermatologist-recommended skincare for sensitive and post-procedure conditions. Leading brands such as CeraVe, Paula’s Choice, and Clinique are investing in barrier-repair formulations integrated with ceramides, amino acids, and mild exfoliating buffers.

The strong retail presence of pharmacy-based and clinical skincare brands continues to sustain adoption. Rising integration of AI-enabled skincare diagnostics and subscription-based personalized product lines is also influencing consumer preferences. Over the coming decade, the USA market is expected to witness steady growth through 2035, driven by innovation in ingredient science, expanding e-commerce access, and increased engagement with preventive skincare routines.
  • Women’s segment drives nearly 60% of total market demand.
  • Dermatology-endorsed products dominate pharmacy and online sales.
  • AI and personalized skincare ecosystems are shaping future growth.

Opportunity Analysis of China Buffering Skincare Products Market

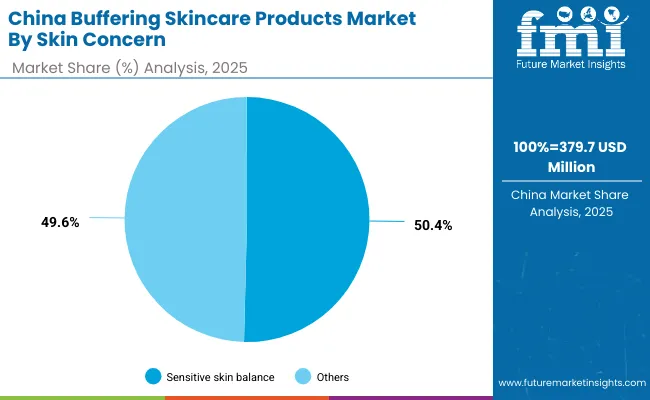
Buffering Skincare Products Market China

China by Skin Concern Value Share% 2025
Sensitive skin balance 50.4%
Others 49.6%

The Buffering Skincare Products Market in China presents strong opportunities, valued at USD 379.7 million in 2025, with sensitive-skin balance products leading at 50.4%. This dominance stems from a rising prevalence of sensitivity and irritation caused by pollution, climate variations, and chemical overuse in cosmetics. Chinese consumers increasingly favor dermatologist-endorsed and clinically validated skincare with pH-balancing formulations that strengthen the acid mantle. The shift toward "functional skincare" is amplified by strong e-commerce platforms such as Tmall, JD.com, and Xiaohongshu, which provide direct access to expert brands like La Roche-Posay and Bioderma. Domestic manufacturers are also leveraging amino acid and lactic acid buffers to create affordable, high-performance formulations suited for humid Asian climates.
  • Sensitive-skin formulations account for more than half of the market value in 2025.
  • E-commerce and influencer-driven awareness are expanding brand visibility.
  • Local innovation in amino acid buffers enhances affordability and accessibility.

Competitive Landscape of Buffering Skincare Products Market

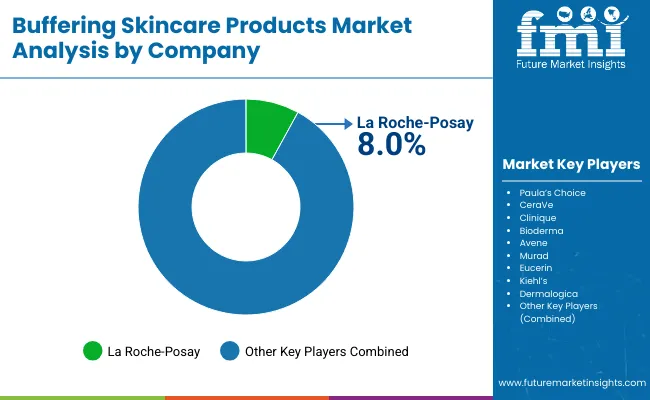
Buffering Skincare Products Market By Company

The Buffering Skincare Products Market is moderately fragmented, featuring a mix of multinational dermatology brands, clinical skincare innovators, and emerging cosmeceutical entrants. Global leaders such as La Roche-Posay, CeraVe, and Bioderma collectively dominate due to their strong dermatological heritage, extensive pharmacy presence, and credibility in pH-balancing formulations.

These brands focus on acid mantle protection, skin microbiome health, and post-procedure care, supported by clinical testing and dermatologist endorsements. Mid-sized brands including Paula’s Choice, Clinique, and Avene are expanding through e-commerce and digital skincare platforms, offering customized solutions for sensitive and reactive skin types. Meanwhile, regional players such as Kiehl’s, Eucerin, and Murad emphasize clean formulations, sustainability, and localized product innovation.

Competitive differentiation is shifting toward science-backed ingredients, personalization, and digital engagement with subscription skincare models, AI-based skin diagnostics, and eco-friendly packaging defining the next phase of competition in the global buffering skincare landscape.

Key Developments in Buffering Skincare Products Market

  • 2024: La Roche-Posay launched its Toleriane Dermallergo Cream+, featuring an enhanced amino acid buffering system designed to stabilize pH for ultra-sensitive and post-procedure skin, expanding its clinical skincare portfolio in Europe and Asia.
  • 2025: CeraVe introduced its Advanced Barrier Repair Range across the USA and China, formulated with bicarbonate and lactic acid buffer complexes to maintain optimal skin pH and restore the acid mantle, backed by dermatologist partnerships and digital skin health campaigns.

Scope of the Report

Item Value
Quantitative Units USD 3,605.4 Million
Product Type Toners & mists, pH-balancing creams, Face cleansers, Soothing gels
Key Ingredients Sodium bicarbonate, Amino acid buffers, Citrate buffers, Lactic acid blends
Skin Concern Acid mantle restoration, Post-procedure care, Sensitive skin balance
Channel E-commerce, Pharmacies/drugstores, Specialty beauty retail, Dermatology clinics
End User Women, Men, Teens, Sensitive-skin users
Regions Covered North America, Europe, Asia-Pacific, Latin America, Middle East & Africa
Country Covered United States, Canada, Germany, France, United Kingdom, China, Japan, India, Brazil, South Africa
Key Companies Profiled La Roche-Posay, Paula’s Choice, CeraVe, Clinique, Bioderma, Avene, Murad, Eucerin, Kiehl’s, Dermalogica
Additional Attributes Dollar sales by product type and end-user category, adoption trends in pH-balancing and sensitive-skin formulations, rising demand for dermatologist-tested and clinically validated buffering products, segment-specific growth across post-procedure care, acid mantle restoration, and sensitive-skin balance applications, revenue segmentation by ingredient type such as sodium bicarbonate, amino acid, and lactic acid buffers, integration of AI-driven skin diagnostics and personalized skincare platforms, regional trends influenced by urbanization and e-commerce expansion, and innovations in microbiome-friendly formulations, clean-label ingredients, and pH-stabilizing delivery systems enhancing long-term skin barrier performance.

Key Segments

By Product Type:

  • Toners & mists
  • pH-balancing creams
  • Face cleansers
  • Soothing gels

By Key Ingredients:

  • Sodium bicarbonate
  • Amino acid buffers
  • Citrate buffers
  • Lactic acid blends

By Skin Concern:

  • Acid mantle restoration
  • Acid mantle restoration
  • Sensitive skin balance

By Channel:

  • Pharmacies & drugstores
  • E-commerce
  • Specialty beauty retail
  • Dermatology clinics

By Region:

  • North America
  • Latin America
  • Europe
  • East Asia
  • South Asia & Pacific
  • Middle East and Africa

Table of Content

  1. Executive Summary
    • Global Market Outlook
    • Demand-side Trends
    • Supply-side Trends
    • Technology Roadmap Analysis
    • Analysis and Recommendations
  2. Market Overview
    • Market Coverage / Taxonomy
    • Market Definition / Scope / Limitations
  3. Market Background
    • Market Dynamics
      • Drivers
      • Restraints
      • Opportunity
      • Trends
    • Scenario Forecast
      • Demand in Optimistic Scenario
      • Demand in Likely Scenario
      • Demand in Conservative Scenario
    • Opportunity Map Analysis
    • Product Life Cycle Analysis
    • Supply Chain Analysis
      • Supply Side Participants and their Roles
        • Producers
        • Mid-Level Participants (Traders/ Agents/ Brokers)
        • Wholesalers and Distributors
      • Value Added and Value Created at Node in the Supply Chain
      • List of Raw Material Suppliers
      • List of Existing and Potential Buyer’s
    • Investment Feasibility Matrix
    • Value Chain Analysis
      • Profit Margin Analysis
      • Wholesalers and Distributors
      • Retailers
    • PESTLE and Porter’s Analysis
    • Regulatory Landscape
      • By Key Regions
      • By Key Countries
    • Regional Parent Market Outlook
    • Production and Consumption Statistics
    • Import and Export Statistics
  4. Global Market Analysis 2020 to 2024 and Forecast, 2025 to 2035
    • Historical Market Size Value (USD Million) & Volume (Units) Analysis, 2020 to 2024
    • Current and Future Market Size Value (USD Million) & Volume (Units) Projections, 2025 to 2035
      • Y-o-Y Growth Trend Analysis
      • Absolute $ Opportunity Analysis
  5. Global Market Analysis 2020 to 2024 and Forecast 2025 to 2035, By Product Type
    • Introduction / Key Findings
    • Historical Market Size Value (USD Million) & Volume (Units) Analysis By Product Type, 2020 to 2024
    • Current and Future Market Size Value (USD Million) & Volume (Units) Analysis and Forecast By Product Type, 2025 to 2035
      • Toners & mists
      • pH-balancing creams
      • Face cleansers
      • Soothing gels
    • Y-o-Y Growth Trend Analysis By Product Type, 2020 to 2024
    • Absolute $ Opportunity Analysis By Product Type, 2025 to 2035
  6. Global Market Analysis 2020 to 2024 and Forecast 2025 to 2035, By Key Ingredients
    • Introduction / Key Findings
    • Historical Market Size Value (USD Million) & Volume (Units) Analysis By Key Ingredients, 2020 to 2024
    • Current and Future Market Size Value (USD Million) & Volume (Units) Analysis and Forecast By Key Ingredients, 2025 to 2035
      • Sodium bicarbonate
      • Amino acid buffers
      • Citrate buffers
      • Lactic acid blends
    • Y-o-Y Growth Trend Analysis By Key Ingredients, 2020 to 2024
    • Absolute $ Opportunity Analysis By Key Ingredients, 2025 to 2035
  7. Global Market Analysis 2020 to 2024 and Forecast 2025 to 2035, By Skin Concern
    • Introduction / Key Findings
    • Historical Market Size Value (USD Million) & Volume (Units) Analysis By Skin Concern, 2020 to 2024
    • Current and Future Market Size Value (USD Million) & Volume (Units) Analysis and Forecast By Skin Concern, 2025 to 2035
      • Acid mantle restoration
      • Acid mantle restoration
      • Sensitive skin balance
    • Y-o-Y Growth Trend Analysis By Skin Concern, 2020 to 2024
    • Absolute $ Opportunity Analysis By Skin Concern, 2025 to 2035
  8. Global Market Analysis 2020 to 2024 and Forecast 2025 to 2035, By Channel
    • Introduction / Key Findings
    • Historical Market Size Value (USD Million) & Volume (Units) Analysis By Channel, 2020 to 2024
    • Current and Future Market Size Value (USD Million) & Volume (Units) Analysis and Forecast By Channel, 2025 to 2035
      • Pharmacies & drugstores
      • E-commerce
      • Specialty beauty retail
      • Dermatology clinics
    • Y-o-Y Growth Trend Analysis By Channel, 2020 to 2024
    • Absolute $ Opportunity Analysis By Channel, 2025 to 2035
  9. Global Market Analysis 2020 to 2024 and Forecast 2025 to 2035, By Region
    • Introduction
    • Historical Market Size Value (USD Million) & Volume (Units) Analysis By Region, 2020 to 2024
    • Current Market Size Value (USD Million) & Volume (Units) Analysis and Forecast By Region, 2025 to 2035
      • North America
      • Latin America
      • Europe
      • East Asia
      • South Asia & Pacific
      • Middle East and Africa
    • Market Attractiveness Analysis By Region
  10. North America Market Analysis 2020 to 2024 and Forecast 2025 to 2035, By Country
    • Historical Market Size Value (USD Million) & Volume (Units) Trend Analysis By Market Taxonomy, 2020 to 2024
    • Market Size Value (USD Million) & Volume (Units) Forecast By Market Taxonomy, 2025 to 2035
      • By Country
        • USA
        • Canada
      • By Product Type
      • By Key Ingredients
      • By Skin Concern
      • By Channel
    • Market Attractiveness Analysis
      • By Country
      • By Product Type
      • By Key Ingredients
      • By Skin Concern
      • By Channel
    • Key Takeaways
  11. Latin America Market Analysis 2020 to 2024 and Forecast 2025 to 2035, By Country
    • Historical Market Size Value (USD Million) & Volume (Units) Trend Analysis By Market Taxonomy, 2020 to 2024
    • Market Size Value (USD Million) & Volume (Units) Forecast By Market Taxonomy, 2025 to 2035
      • By Country
        • Brazil
        • Mexico
        • Colombia
        • Rest of Latin America
      • By Product Type
      • By Key Ingredients
      • By Skin Concern
      • By Channel
    • Market Attractiveness Analysis
      • By Country
      • By Product Type
      • By Key Ingredients
      • By Skin Concern
      • By Channel
    • Key Takeaways
  12. Europe Market Analysis 2020 to 2024 and Forecast 2025 to 2035, By Country
    • Historical Market Size Value (USD Million) & Volume (Units) Trend Analysis By Market Taxonomy, 2020 to 2024
    • Market Size Value (USD Million) & Volume (Units) Forecast By Market Taxonomy, 2025 to 2035
      • By Country
        • Germany
        • UK
        • France
        • Italy
        • Spain
        • Belgium
        • Netherlands
        • Nordic
        • Switzerland
        • Russia
        • Poland
        • Rest of Europe
      • By Product Type
      • By Key Ingredients
      • By Skin Concern
      • By Channel
    • Market Attractiveness Analysis
      • By Country
      • By Product Type
      • By Key Ingredients
      • By Skin Concern
      • By Channel
    • Key Takeaways
  13. East Asia Market Analysis 2020 to 2024 and Forecast 2025 to 2035, By Country
    • Historical Market Size Value (USD Million) & Volume (Units) Trend Analysis By Market Taxonomy, 2020 to 2024
    • Market Size Value (USD Million) & Volume (Units) Forecast By Market Taxonomy, 2025 to 2035
      • By Country
        • China
        • Japan
        • South Korea
      • By Product Type
      • By Key Ingredients
      • By Skin Concern
      • By Channel
    • Market Attractiveness Analysis
      • By Country
      • By Product Type
      • By Key Ingredients
      • By Skin Concern
      • By Channel
    • Key Takeaways
  14. South Asia & Pacific Market Analysis 2020 to 2024 and Forecast 2025 to 2035, By Country
    • Historical Market Size Value (USD Million) & Volume (Units) Trend Analysis By Market Taxonomy, 2020 to 2024
    • Market Size Value (USD Million) & Volume (Units) Forecast By Market Taxonomy, 2025 to 2035
      • By Country
        • India
        • Thailand
        • Malaysia
        • Indonesia
        • Singapore
        • Vietnam
        • Australia
        • New Zealand
        • Rest of South Asia
      • By Product Type
      • By Key Ingredients
      • By Skin Concern
      • By Channel
    • Market Attractiveness Analysis
      • By Country
      • By Product Type
      • By Key Ingredients
      • By Skin Concern
      • By Channel
    • Key Takeaways
  15. Middle East and Africa Market Analysis 2020 to 2024 and Forecast 2025 to 2035, By Country
    • Historical Market Size Value (USD Million) & Volume (Units) Trend Analysis By Market Taxonomy, 2020 to 2024
    • Market Size Value (USD Million) & Volume (Units) Forecast By Market Taxonomy, 2025 to 2035
      • By Country
        • Turkey
        • UAE
        • Saudi Arabia
        • Israel
        • Other GCC Countries
        • North Africa
        • South Africa
      • By Product Type
      • By Key Ingredients
      • By Skin Concern
      • By Channel
    • Market Attractiveness Analysis
      • By Country
      • By Product Type
      • By Key Ingredients
      • By Skin Concern
      • By Channel
    • Key Takeaways
  16. Key Countries Market Analysis
    • USA
      • Pricing Analysis
      • Market Share Analysis, 2024
        • By Product Type
        • By Key Ingredients
        • By Skin Concern
        • By Channel
    • Canada
      • Pricing Analysis
      • Market Share Analysis, 2024
        • By Product Type
        • By Key Ingredients
        • By Skin Concern
        • By Channel
    • Brazil
      • Pricing Analysis
      • Market Share Analysis, 2024
        • By Product Type
        • By Key Ingredients
        • By Skin Concern
        • By Channel
    • Mexico
      • Pricing Analysis
      • Market Share Analysis, 2024
        • By Product Type
        • By Key Ingredients
        • By Skin Concern
        • By Channel
    • Colombia
      • Pricing Analysis
      • Market Share Analysis, 2024
        • By Product Type
        • By Key Ingredients
        • By Skin Concern
        • By Channel
    • Germany
      • Pricing Analysis
      • Market Share Analysis, 2024
        • By Product Type
        • By Key Ingredients
        • By Skin Concern
        • By Channel
    • UK
      • Pricing Analysis
      • Market Share Analysis, 2024
        • By Product Type
        • By Key Ingredients
        • By Skin Concern
        • By Channel
    • France
      • Pricing Analysis
      • Market Share Analysis, 2024
        • By Product Type
        • By Key Ingredients
        • By Skin Concern
        • By Channel
    • Italy
      • Pricing Analysis
      • Market Share Analysis, 2024
        • By Product Type
        • By Key Ingredients
        • By Skin Concern
        • By Channel
    • Spain
      • Pricing Analysis
      • Market Share Analysis, 2024
        • By Product Type
        • By Key Ingredients
        • By Skin Concern
        • By Channel
    • Belgium
      • Pricing Analysis
      • Market Share Analysis, 2024
        • By Product Type
        • By Key Ingredients
        • By Skin Concern
        • By Channel
    • Netherlands
      • Pricing Analysis
      • Market Share Analysis, 2024
        • By Product Type
        • By Key Ingredients
        • By Skin Concern
        • By Channel
    • Nordic
      • Pricing Analysis
      • Market Share Analysis, 2024
        • By Product Type
        • By Key Ingredients
        • By Skin Concern
        • By Channel
    • Switzerland
      • Pricing Analysis
      • Market Share Analysis, 2024
        • By Product Type
        • By Key Ingredients
        • By Skin Concern
        • By Channel
    • Russia
      • Pricing Analysis
      • Market Share Analysis, 2024
        • By Product Type
        • By Key Ingredients
        • By Skin Concern
        • By Channel
    • Poland
      • Pricing Analysis
      • Market Share Analysis, 2024
        • By Product Type
        • By Key Ingredients
        • By Skin Concern
        • By Channel
    • China
      • Pricing Analysis
      • Market Share Analysis, 2024
        • By Product Type
        • By Key Ingredients
        • By Skin Concern
        • By Channel
    • Japan
      • Pricing Analysis
      • Market Share Analysis, 2024
        • By Product Type
        • By Key Ingredients
        • By Skin Concern
        • By Channel
    • South Korea
      • Pricing Analysis
      • Market Share Analysis, 2024
        • By Product Type
        • By Key Ingredients
        • By Skin Concern
        • By Channel
    • India
      • Pricing Analysis
      • Market Share Analysis, 2024
        • By Product Type
        • By Key Ingredients
        • By Skin Concern
        • By Channel
    • Thailand
      • Pricing Analysis
      • Market Share Analysis, 2024
        • By Product Type
        • By Key Ingredients
        • By Skin Concern
        • By Channel
    • Indonesia
      • Pricing Analysis
      • Market Share Analysis, 2024
        • By Product Type
        • By Key Ingredients
        • By Skin Concern
        • By Channel
    • Australia
      • Pricing Analysis
      • Market Share Analysis, 2024
        • By Product Type
        • By Key Ingredients
        • By Skin Concern
        • By Channel
    • New Zealand
      • Pricing Analysis
      • Market Share Analysis, 2024
        • By Product Type
        • By Key Ingredients
        • By Skin Concern
        • By Channel
    • Turkey
      • Pricing Analysis
      • Market Share Analysis, 2024
        • By Product Type
        • By Key Ingredients
        • By Skin Concern
        • By Channel
    • UAE
      • Pricing Analysis
      • Market Share Analysis, 2024
        • By Product Type
        • By Key Ingredients
        • By Skin Concern
        • By Channel
    • Saudi Arabia
      • Pricing Analysis
      • Market Share Analysis, 2024
        • By Product Type
        • By Key Ingredients
        • By Skin Concern
        • By Channel
    • Israel
      • Pricing Analysis
      • Market Share Analysis, 2024
        • By Product Type
        • By Key Ingredients
        • By Skin Concern
        • By Channel
    • North Africa
      • Pricing Analysis
      • Market Share Analysis, 2024
        • By Product Type
        • By Key Ingredients
        • By Skin Concern
        • By Channel
    • South Africa
      • Pricing Analysis
      • Market Share Analysis, 2024
        • By Product Type
        • By Key Ingredients
        • By Skin Concern
        • By Channel
  17. Market Structure Analysis
    • Competition Dashboard
    • Competition Benchmarking
    • Market Share Analysis of Top Players
      • By Regional
      • By Product Type
      • By Key Ingredients
      • By Skin Concern
      • By Channel
  18. Competition Analysis
    • Competition Deep Dive
      • La Roche-Posay
        • Overview
        • Product Portfolio
        • Profitability by Market Segments (Product/Age /Sales Channel/Region)
        • Sales Footprint
        • Strategy Overview
          • Marketing Strategy
          • Product Strategy
          • Channel Strategy
      • Paula’s Choice
        • Overview
        • Product Portfolio
        • Profitability by Market Segments (Product/Age /Sales Channel/Region)
        • Sales Footprint
        • Strategy Overview
          • Marketing Strategy
          • Product Strategy
          • Channel Strategy
      • CeraVe
        • Overview
        • Product Portfolio
        • Profitability by Market Segments (Product/Age /Sales Channel/Region)
        • Sales Footprint
        • Strategy Overview
          • Marketing Strategy
          • Product Strategy
          • Channel Strategy
      • Clinique
        • Overview
        • Product Portfolio
        • Profitability by Market Segments (Product/Age /Sales Channel/Region)
        • Sales Footprint
        • Strategy Overview
          • Marketing Strategy
          • Product Strategy
          • Channel Strategy
      • Bioderma
        • Overview
        • Product Portfolio
        • Profitability by Market Segments (Product/Age /Sales Channel/Region)
        • Sales Footprint
        • Strategy Overview
          • Marketing Strategy
          • Product Strategy
          • Channel Strategy
      • Avene
        • Overview
        • Product Portfolio
        • Profitability by Market Segments (Product/Age /Sales Channel/Region)
        • Sales Footprint
        • Strategy Overview
          • Marketing Strategy
          • Product Strategy
          • Channel Strategy
      • Murad
        • Overview
        • Product Portfolio
        • Profitability by Market Segments (Product/Age /Sales Channel/Region)
        • Sales Footprint
        • Strategy Overview
          • Marketing Strategy
          • Product Strategy
          • Channel Strategy
      • Eucerin
        • Overview
        • Product Portfolio
        • Profitability by Market Segments (Product/Age /Sales Channel/Region)
        • Sales Footprint
        • Strategy Overview
          • Marketing Strategy
          • Product Strategy
          • Channel Strategy
      • Kiehl’s
        • Overview
        • Product Portfolio
        • Profitability by Market Segments (Product/Age /Sales Channel/Region)
        • Sales Footprint
        • Strategy Overview
          • Marketing Strategy
          • Product Strategy
          • Channel Strategy
      • Dermalogica
        • Overview
        • Product Portfolio
        • Profitability by Market Segments (Product/Age /Sales Channel/Region)
        • Sales Footprint
        • Strategy Overview
          • Marketing Strategy
          • Product Strategy
          • Channel Strategy
      • Others
        • Overview
        • Product Portfolio
        • Profitability by Market Segments (Product/Age /Sales Channel/Region)
        • Sales Footprint
        • Strategy Overview
          • Marketing Strategy
          • Product Strategy
          • Channel Strategy
  19. Assumptions & Acronyms Used
  20. Research Methodology

List of Tables

  • Table 1: Global Market Value (USD Million) Forecast by Region, 2020-2035
  • Table 2: Global Market Volume (Units) Forecast by Region, 2020-2035
  • Table 3: Global Market Value (USD Million) Forecast by Product Type, 2020-2035
  • Table 4: Global Market Volume (Units) Forecast by Product Type, 2020-2035
  • Table 5: Global Market Value (USD Million) Forecast by Key Ingredients, 2020-2035
  • Table 6: Global Market Volume (Units) Forecast by Key Ingredients, 2020-2035
  • Table 7: Global Market Value (USD Million) Forecast by Skin Concern, 2020-2035
  • Table 8: Global Market Volume (Units) Forecast by Skin Concern, 2020-2035
  • Table 9: Global Market Value (USD Million) Forecast by Channel, 2020-2035
  • Table 10: Global Market Volume (Units) Forecast by Channel, 2020-2035
  • Table 11: North America Market Value (USD Million) Forecast by Country, 2020-2035
  • Table 12: North America Market Volume (Units) Forecast by Country, 2020-2035
  • Table 13: North America Market Value (USD Million) Forecast by Product Type, 2020-2035
  • Table 14: North America Market Volume (Units) Forecast by Product Type, 2020-2035
  • Table 15: North America Market Value (USD Million) Forecast by Key Ingredients, 2020-2035
  • Table 16: North America Market Volume (Units) Forecast by Key Ingredients, 2020-2035
  • Table 17: North America Market Value (USD Million) Forecast by Skin Concern, 2020-2035
  • Table 18: North America Market Volume (Units) Forecast by Skin Concern, 2020-2035
  • Table 19: North America Market Value (USD Million) Forecast by Channel, 2020-2035
  • Table 20: North America Market Volume (Units) Forecast by Channel, 2020-2035
  • Table 21: Latin America Market Value (USD Million) Forecast by Country, 2020-2035
  • Table 22: Latin America Market Volume (Units) Forecast by Country, 2020-2035
  • Table 23: Latin America Market Value (USD Million) Forecast by Product Type, 2020-2035
  • Table 24: Latin America Market Volume (Units) Forecast by Product Type, 2020-2035
  • Table 25: Latin America Market Value (USD Million) Forecast by Key Ingredients, 2020-2035
  • Table 26: Latin America Market Volume (Units) Forecast by Key Ingredients, 2020-2035
  • Table 27: Latin America Market Value (USD Million) Forecast by Skin Concern, 2020-2035
  • Table 28: Latin America Market Volume (Units) Forecast by Skin Concern, 2020-2035
  • Table 29: Latin America Market Value (USD Million) Forecast by Channel, 2020-2035
  • Table 30: Latin America Market Volume (Units) Forecast by Channel, 2020-2035
  • Table 31: Europe Market Value (USD Million) Forecast by Country, 2020-2035
  • Table 32: Europe Market Volume (Units) Forecast by Country, 2020-2035
  • Table 33: Europe Market Value (USD Million) Forecast by Product Type, 2020-2035
  • Table 34: Europe Market Volume (Units) Forecast by Product Type, 2020-2035
  • Table 35: Europe Market Value (USD Million) Forecast by Key Ingredients, 2020-2035
  • Table 36: Europe Market Volume (Units) Forecast by Key Ingredients, 2020-2035
  • Table 37: Europe Market Value (USD Million) Forecast by Skin Concern, 2020-2035
  • Table 38: Europe Market Volume (Units) Forecast by Skin Concern, 2020-2035
  • Table 39: Europe Market Value (USD Million) Forecast by Channel, 2020-2035
  • Table 40: Europe Market Volume (Units) Forecast by Channel, 2020-2035
  • Table 41: East Asia Market Value (USD Million) Forecast by Country, 2020-2035
  • Table 42: East Asia Market Volume (Units) Forecast by Country, 2020-2035
  • Table 43: East Asia Market Value (USD Million) Forecast by Product Type, 2020-2035
  • Table 44: East Asia Market Volume (Units) Forecast by Product Type, 2020-2035
  • Table 45: East Asia Market Value (USD Million) Forecast by Key Ingredients, 2020-2035
  • Table 46: East Asia Market Volume (Units) Forecast by Key Ingredients, 2020-2035
  • Table 47: East Asia Market Value (USD Million) Forecast by Skin Concern, 2020-2035
  • Table 48: East Asia Market Volume (Units) Forecast by Skin Concern, 2020-2035
  • Table 49: East Asia Market Value (USD Million) Forecast by Channel, 2020-2035
  • Table 50: East Asia Market Volume (Units) Forecast by Channel, 2020-2035
  • Table 51: South Asia & Pacific Market Value (USD Million) Forecast by Country, 2020-2035
  • Table 52: South Asia & Pacific Market Volume (Units) Forecast by Country, 2020-2035
  • Table 53: South Asia & Pacific Market Value (USD Million) Forecast by Product Type, 2020-2035
  • Table 54: South Asia & Pacific Market Volume (Units) Forecast by Product Type, 2020-2035
  • Table 55: South Asia & Pacific Market Value (USD Million) Forecast by Key Ingredients, 2020-2035
  • Table 56: South Asia & Pacific Market Volume (Units) Forecast by Key Ingredients, 2020-2035
  • Table 57: South Asia & Pacific Market Value (USD Million) Forecast by Skin Concern, 2020-2035
  • Table 58: South Asia & Pacific Market Volume (Units) Forecast by Skin Concern, 2020-2035
  • Table 59: South Asia & Pacific Market Value (USD Million) Forecast by Channel, 2020-2035
  • Table 60: South Asia & Pacific Market Volume (Units) Forecast by Channel, 2020-2035
  • Table 61: Middle East and Africa Market Value (USD Million) Forecast by Country, 2020-2035
  • Table 62: Middle East and Africa Market Volume (Units) Forecast by Country, 2020-2035
  • Table 63: Middle East and Africa Market Value (USD Million) Forecast by Product Type, 2020-2035
  • Table 64: Middle East and Africa Market Volume (Units) Forecast by Product Type, 2020-2035
  • Table 65: Middle East and Africa Market Value (USD Million) Forecast by Key Ingredients, 2020-2035
  • Table 66: Middle East and Africa Market Volume (Units) Forecast by Key Ingredients, 2020-2035
  • Table 67: Middle East and Africa Market Value (USD Million) Forecast by Skin Concern, 2020-2035
  • Table 68: Middle East and Africa Market Volume (Units) Forecast by Skin Concern, 2020-2035
  • Table 69: Middle East and Africa Market Value (USD Million) Forecast by Channel, 2020-2035
  • Table 70: Middle East and Africa Market Volume (Units) Forecast by Channel, 2020-2035

List of Figures

  • Figure 1: Global Market Value (USD Million) by Product Type, 2025-2035
  • Figure 2: Global Market Value (USD Million) by Key Ingredients, 2025-2035
  • Figure 3: Global Market Value (USD Million) by Skin Concern, 2025-2035
  • Figure 4: Global Market Value (USD Million) by Channel, 2025-2035
  • Figure 5: Global Market Value (USD Million) by Region, 2025-2035
  • Figure 6: Global Market Value (USD Million) Analysis by Region, 2020-2035
  • Figure 7: Global Market Volume (Units) Analysis by Region, 2020-2035
  • Figure 8: Global Market Value Share (%) and BPS Analysis by Region, 2025-2035
  • Figure 9: Global Market Y-o-Y Growth (%) Projections by Region, 2025-2035
  • Figure 10: Global Market Value (USD Million) Analysis by Product Type, 2020-2035
  • Figure 11: Global Market Volume (Units) Analysis by Product Type, 2020-2035
  • Figure 12: Global Market Value Share (%) and BPS Analysis by Product Type, 2025-2035
  • Figure 13: Global Market Y-o-Y Growth (%) Projections by Product Type, 2025-2035
  • Figure 14: Global Market Value (USD Million) Analysis by Key Ingredients, 2020-2035
  • Figure 15: Global Market Volume (Units) Analysis by Key Ingredients, 2020-2035
  • Figure 16: Global Market Value Share (%) and BPS Analysis by Key Ingredients, 2025-2035
  • Figure 17: Global Market Y-o-Y Growth (%) Projections by Key Ingredients, 2025-2035
  • Figure 18: Global Market Value (USD Million) Analysis by Skin Concern, 2020-2035
  • Figure 19: Global Market Volume (Units) Analysis by Skin Concern, 2020-2035
  • Figure 20: Global Market Value Share (%) and BPS Analysis by Skin Concern, 2025-2035
  • Figure 21: Global Market Y-o-Y Growth (%) Projections by Skin Concern, 2025-2035
  • Figure 22: Global Market Value (USD Million) Analysis by Channel, 2020-2035
  • Figure 23: Global Market Volume (Units) Analysis by Channel, 2020-2035
  • Figure 24: Global Market Value Share (%) and BPS Analysis by Channel, 2025-2035
  • Figure 25: Global Market Y-o-Y Growth (%) Projections by Channel, 2025-2035
  • Figure 26: Global Market Attractiveness by Product Type, 2025-2035
  • Figure 27: Global Market Attractiveness by Key Ingredients, 2025-2035
  • Figure 28: Global Market Attractiveness by Skin Concern, 2025-2035
  • Figure 29: Global Market Attractiveness by Channel, 2025-2035
  • Figure 30: Global Market Attractiveness by Region, 2025-2035
  • Figure 31: North America Market Value (USD Million) by Product Type, 2025-2035
  • Figure 32: North America Market Value (USD Million) by Key Ingredients, 2025-2035
  • Figure 33: North America Market Value (USD Million) by Skin Concern, 2025-2035
  • Figure 34: North America Market Value (USD Million) by Channel, 2025-2035
  • Figure 35: North America Market Value (USD Million) by Country, 2025-2035
  • Figure 36: North America Market Value (USD Million) Analysis by Country, 2020-2035
  • Figure 37: North America Market Volume (Units) Analysis by Country, 2020-2035
  • Figure 38: North America Market Value Share (%) and BPS Analysis by Country, 2025-2035
  • Figure 39: North America Market Y-o-Y Growth (%) Projections by Country, 2025-2035
  • Figure 40: North America Market Value (USD Million) Analysis by Product Type, 2020-2035
  • Figure 41: North America Market Volume (Units) Analysis by Product Type, 2020-2035
  • Figure 42: North America Market Value Share (%) and BPS Analysis by Product Type, 2025-2035
  • Figure 43: North America Market Y-o-Y Growth (%) Projections by Product Type, 2025-2035
  • Figure 44: North America Market Value (USD Million) Analysis by Key Ingredients, 2020-2035
  • Figure 45: North America Market Volume (Units) Analysis by Key Ingredients, 2020-2035
  • Figure 46: North America Market Value Share (%) and BPS Analysis by Key Ingredients, 2025-2035
  • Figure 47: North America Market Y-o-Y Growth (%) Projections by Key Ingredients, 2025-2035
  • Figure 48: North America Market Value (USD Million) Analysis by Skin Concern, 2020-2035
  • Figure 49: North America Market Volume (Units) Analysis by Skin Concern, 2020-2035
  • Figure 50: North America Market Value Share (%) and BPS Analysis by Skin Concern, 2025-2035
  • Figure 51: North America Market Y-o-Y Growth (%) Projections by Skin Concern, 2025-2035
  • Figure 52: North America Market Value (USD Million) Analysis by Channel, 2020-2035
  • Figure 53: North America Market Volume (Units) Analysis by Channel, 2020-2035
  • Figure 54: North America Market Value Share (%) and BPS Analysis by Channel, 2025-2035
  • Figure 55: North America Market Y-o-Y Growth (%) Projections by Channel, 2025-2035
  • Figure 56: North America Market Attractiveness by Product Type, 2025-2035
  • Figure 57: North America Market Attractiveness by Key Ingredients, 2025-2035
  • Figure 58: North America Market Attractiveness by Skin Concern, 2025-2035
  • Figure 59: North America Market Attractiveness by Channel, 2025-2035
  • Figure 60: North America Market Attractiveness by Country, 2025-2035
  • Figure 61: Latin America Market Value (USD Million) by Product Type, 2025-2035
  • Figure 62: Latin America Market Value (USD Million) by Key Ingredients, 2025-2035
  • Figure 63: Latin America Market Value (USD Million) by Skin Concern, 2025-2035
  • Figure 64: Latin America Market Value (USD Million) by Channel, 2025-2035
  • Figure 65: Latin America Market Value (USD Million) by Country, 2025-2035
  • Figure 66: Latin America Market Value (USD Million) Analysis by Country, 2020-2035
  • Figure 67: Latin America Market Volume (Units) Analysis by Country, 2020-2035
  • Figure 68: Latin America Market Value Share (%) and BPS Analysis by Country, 2025-2035
  • Figure 69: Latin America Market Y-o-Y Growth (%) Projections by Country, 2025-2035
  • Figure 70: Latin America Market Value (USD Million) Analysis by Product Type, 2020-2035
  • Figure 71: Latin America Market Volume (Units) Analysis by Product Type, 2020-2035
  • Figure 72: Latin America Market Value Share (%) and BPS Analysis by Product Type, 2025-2035
  • Figure 73: Latin America Market Y-o-Y Growth (%) Projections by Product Type, 2025-2035
  • Figure 74: Latin America Market Value (USD Million) Analysis by Key Ingredients, 2020-2035
  • Figure 75: Latin America Market Volume (Units) Analysis by Key Ingredients, 2020-2035
  • Figure 76: Latin America Market Value Share (%) and BPS Analysis by Key Ingredients, 2025-2035
  • Figure 77: Latin America Market Y-o-Y Growth (%) Projections by Key Ingredients, 2025-2035
  • Figure 78: Latin America Market Value (USD Million) Analysis by Skin Concern, 2020-2035
  • Figure 79: Latin America Market Volume (Units) Analysis by Skin Concern, 2020-2035
  • Figure 80: Latin America Market Value Share (%) and BPS Analysis by Skin Concern, 2025-2035
  • Figure 81: Latin America Market Y-o-Y Growth (%) Projections by Skin Concern, 2025-2035
  • Figure 82: Latin America Market Value (USD Million) Analysis by Channel, 2020-2035
  • Figure 83: Latin America Market Volume (Units) Analysis by Channel, 2020-2035
  • Figure 84: Latin America Market Value Share (%) and BPS Analysis by Channel, 2025-2035
  • Figure 85: Latin America Market Y-o-Y Growth (%) Projections by Channel, 2025-2035
  • Figure 86: Latin America Market Attractiveness by Product Type, 2025-2035
  • Figure 87: Latin America Market Attractiveness by Key Ingredients, 2025-2035
  • Figure 88: Latin America Market Attractiveness by Skin Concern, 2025-2035
  • Figure 89: Latin America Market Attractiveness by Channel, 2025-2035
  • Figure 90: Latin America Market Attractiveness by Country, 2025-2035
  • Figure 91: Europe Market Value (USD Million) by Product Type, 2025-2035
  • Figure 92: Europe Market Value (USD Million) by Key Ingredients, 2025-2035
  • Figure 93: Europe Market Value (USD Million) by Skin Concern, 2025-2035
  • Figure 94: Europe Market Value (USD Million) by Channel, 2025-2035
  • Figure 95: Europe Market Value (USD Million) by Country, 2025-2035
  • Figure 96: Europe Market Value (USD Million) Analysis by Country, 2020-2035
  • Figure 97: Europe Market Volume (Units) Analysis by Country, 2020-2035
  • Figure 98: Europe Market Value Share (%) and BPS Analysis by Country, 2025-2035
  • Figure 99: Europe Market Y-o-Y Growth (%) Projections by Country, 2025-2035
  • Figure 100: Europe Market Value (USD Million) Analysis by Product Type, 2020-2035
  • Figure 101: Europe Market Volume (Units) Analysis by Product Type, 2020-2035
  • Figure 102: Europe Market Value Share (%) and BPS Analysis by Product Type, 2025-2035
  • Figure 103: Europe Market Y-o-Y Growth (%) Projections by Product Type, 2025-2035
  • Figure 104: Europe Market Value (USD Million) Analysis by Key Ingredients, 2020-2035
  • Figure 105: Europe Market Volume (Units) Analysis by Key Ingredients, 2020-2035
  • Figure 106: Europe Market Value Share (%) and BPS Analysis by Key Ingredients, 2025-2035
  • Figure 107: Europe Market Y-o-Y Growth (%) Projections by Key Ingredients, 2025-2035
  • Figure 108: Europe Market Value (USD Million) Analysis by Skin Concern, 2020-2035
  • Figure 109: Europe Market Volume (Units) Analysis by Skin Concern, 2020-2035
  • Figure 110: Europe Market Value Share (%) and BPS Analysis by Skin Concern, 2025-2035
  • Figure 111: Europe Market Y-o-Y Growth (%) Projections by Skin Concern, 2025-2035
  • Figure 112: Europe Market Value (USD Million) Analysis by Channel, 2020-2035
  • Figure 113: Europe Market Volume (Units) Analysis by Channel, 2020-2035
  • Figure 114: Europe Market Value Share (%) and BPS Analysis by Channel, 2025-2035
  • Figure 115: Europe Market Y-o-Y Growth (%) Projections by Channel, 2025-2035
  • Figure 116: Europe Market Attractiveness by Product Type, 2025-2035
  • Figure 117: Europe Market Attractiveness by Key Ingredients, 2025-2035
  • Figure 118: Europe Market Attractiveness by Skin Concern, 2025-2035
  • Figure 119: Europe Market Attractiveness by Channel, 2025-2035
  • Figure 120: Europe Market Attractiveness by Country, 2025-2035
  • Figure 121: East Asia Market Value (USD Million) by Product Type, 2025-2035
  • Figure 122: East Asia Market Value (USD Million) by Key Ingredients, 2025-2035
  • Figure 123: East Asia Market Value (USD Million) by Skin Concern, 2025-2035
  • Figure 124: East Asia Market Value (USD Million) by Channel, 2025-2035
  • Figure 125: East Asia Market Value (USD Million) by Country, 2025-2035
  • Figure 126: East Asia Market Value (USD Million) Analysis by Country, 2020-2035
  • Figure 127: East Asia Market Volume (Units) Analysis by Country, 2020-2035
  • Figure 128: East Asia Market Value Share (%) and BPS Analysis by Country, 2025-2035
  • Figure 129: East Asia Market Y-o-Y Growth (%) Projections by Country, 2025-2035
  • Figure 130: East Asia Market Value (USD Million) Analysis by Product Type, 2020-2035
  • Figure 131: East Asia Market Volume (Units) Analysis by Product Type, 2020-2035
  • Figure 132: East Asia Market Value Share (%) and BPS Analysis by Product Type, 2025-2035
  • Figure 133: East Asia Market Y-o-Y Growth (%) Projections by Product Type, 2025-2035
  • Figure 134: East Asia Market Value (USD Million) Analysis by Key Ingredients, 2020-2035
  • Figure 135: East Asia Market Volume (Units) Analysis by Key Ingredients, 2020-2035
  • Figure 136: East Asia Market Value Share (%) and BPS Analysis by Key Ingredients, 2025-2035
  • Figure 137: East Asia Market Y-o-Y Growth (%) Projections by Key Ingredients, 2025-2035
  • Figure 138: East Asia Market Value (USD Million) Analysis by Skin Concern, 2020-2035
  • Figure 139: East Asia Market Volume (Units) Analysis by Skin Concern, 2020-2035
  • Figure 140: East Asia Market Value Share (%) and BPS Analysis by Skin Concern, 2025-2035
  • Figure 141: East Asia Market Y-o-Y Growth (%) Projections by Skin Concern, 2025-2035
  • Figure 142: East Asia Market Value (USD Million) Analysis by Channel, 2020-2035
  • Figure 143: East Asia Market Volume (Units) Analysis by Channel, 2020-2035
  • Figure 144: East Asia Market Value Share (%) and BPS Analysis by Channel, 2025-2035
  • Figure 145: East Asia Market Y-o-Y Growth (%) Projections by Channel, 2025-2035
  • Figure 146: East Asia Market Attractiveness by Product Type, 2025-2035
  • Figure 147: East Asia Market Attractiveness by Key Ingredients, 2025-2035
  • Figure 148: East Asia Market Attractiveness by Skin Concern, 2025-2035
  • Figure 149: East Asia Market Attractiveness by Channel, 2025-2035
  • Figure 150: East Asia Market Attractiveness by Country, 2025-2035
  • Figure 151: South Asia & Pacific Market Value (USD Million) by Product Type, 2025-2035
  • Figure 152: South Asia & Pacific Market Value (USD Million) by Key Ingredients, 2025-2035
  • Figure 153: South Asia & Pacific Market Value (USD Million) by Skin Concern, 2025-2035
  • Figure 154: South Asia & Pacific Market Value (USD Million) by Channel, 2025-2035
  • Figure 155: South Asia & Pacific Market Value (USD Million) by Country, 2025-2035
  • Figure 156: South Asia & Pacific Market Value (USD Million) Analysis by Country, 2020-2035
  • Figure 157: South Asia & Pacific Market Volume (Units) Analysis by Country, 2020-2035
  • Figure 158: South Asia & Pacific Market Value Share (%) and BPS Analysis by Country, 2025-2035
  • Figure 159: South Asia & Pacific Market Y-o-Y Growth (%) Projections by Country, 2025-2035
  • Figure 160: South Asia & Pacific Market Value (USD Million) Analysis by Product Type, 2020-2035
  • Figure 161: South Asia & Pacific Market Volume (Units) Analysis by Product Type, 2020-2035
  • Figure 162: South Asia & Pacific Market Value Share (%) and BPS Analysis by Product Type, 2025-2035
  • Figure 163: South Asia & Pacific Market Y-o-Y Growth (%) Projections by Product Type, 2025-2035
  • Figure 164: South Asia & Pacific Market Value (USD Million) Analysis by Key Ingredients, 2020-2035
  • Figure 165: South Asia & Pacific Market Volume (Units) Analysis by Key Ingredients, 2020-2035
  • Figure 166: South Asia & Pacific Market Value Share (%) and BPS Analysis by Key Ingredients, 2025-2035
  • Figure 167: South Asia & Pacific Market Y-o-Y Growth (%) Projections by Key Ingredients, 2025-2035
  • Figure 168: South Asia & Pacific Market Value (USD Million) Analysis by Skin Concern, 2020-2035
  • Figure 169: South Asia & Pacific Market Volume (Units) Analysis by Skin Concern, 2020-2035
  • Figure 170: South Asia & Pacific Market Value Share (%) and BPS Analysis by Skin Concern, 2025-2035
  • Figure 171: South Asia & Pacific Market Y-o-Y Growth (%) Projections by Skin Concern, 2025-2035
  • Figure 172: South Asia & Pacific Market Value (USD Million) Analysis by Channel, 2020-2035
  • Figure 173: South Asia & Pacific Market Volume (Units) Analysis by Channel, 2020-2035
  • Figure 174: South Asia & Pacific Market Value Share (%) and BPS Analysis by Channel, 2025-2035
  • Figure 175: South Asia & Pacific Market Y-o-Y Growth (%) Projections by Channel, 2025-2035
  • Figure 176: South Asia & Pacific Market Attractiveness by Product Type, 2025-2035
  • Figure 177: South Asia & Pacific Market Attractiveness by Key Ingredients, 2025-2035
  • Figure 178: South Asia & Pacific Market Attractiveness by Skin Concern, 2025-2035
  • Figure 179: South Asia & Pacific Market Attractiveness by Channel, 2025-2035
  • Figure 180: South Asia & Pacific Market Attractiveness by Country, 2025-2035
  • Figure 181: Middle East and Africa Market Value (USD Million) by Product Type, 2025-2035
  • Figure 182: Middle East and Africa Market Value (USD Million) by Key Ingredients, 2025-2035
  • Figure 183: Middle East and Africa Market Value (USD Million) by Skin Concern, 2025-2035
  • Figure 184: Middle East and Africa Market Value (USD Million) by Channel, 2025-2035
  • Figure 185: Middle East and Africa Market Value (USD Million) by Country, 2025-2035
  • Figure 186: Middle East and Africa Market Value (USD Million) Analysis by Country, 2020-2035
  • Figure 187: Middle East and Africa Market Volume (Units) Analysis by Country, 2020-2035
  • Figure 188: Middle East and Africa Market Value Share (%) and BPS Analysis by Country, 2025-2035
  • Figure 189: Middle East and Africa Market Y-o-Y Growth (%) Projections by Country, 2025-2035
  • Figure 190: Middle East and Africa Market Value (USD Million) Analysis by Product Type, 2020-2035
  • Figure 191: Middle East and Africa Market Volume (Units) Analysis by Product Type, 2020-2035
  • Figure 192: Middle East and Africa Market Value Share (%) and BPS Analysis by Product Type, 2025-2035
  • Figure 193: Middle East and Africa Market Y-o-Y Growth (%) Projections by Product Type, 2025-2035
  • Figure 194: Middle East and Africa Market Value (USD Million) Analysis by Key Ingredients, 2020-2035
  • Figure 195: Middle East and Africa Market Volume (Units) Analysis by Key Ingredients, 2020-2035
  • Figure 196: Middle East and Africa Market Value Share (%) and BPS Analysis by Key Ingredients, 2025-2035
  • Figure 197: Middle East and Africa Market Y-o-Y Growth (%) Projections by Key Ingredients, 2025-2035
  • Figure 198: Middle East and Africa Market Value (USD Million) Analysis by Skin Concern, 2020-2035
  • Figure 199: Middle East and Africa Market Volume (Units) Analysis by Skin Concern, 2020-2035
  • Figure 200: Middle East and Africa Market Value Share (%) and BPS Analysis by Skin Concern, 2025-2035
  • Figure 201: Middle East and Africa Market Y-o-Y Growth (%) Projections by Skin Concern, 2025-2035
  • Figure 202: Middle East and Africa Market Value (USD Million) Analysis by Channel, 2020-2035
  • Figure 203: Middle East and Africa Market Volume (Units) Analysis by Channel, 2020-2035
  • Figure 204: Middle East and Africa Market Value Share (%) and BPS Analysis by Channel, 2025-2035
  • Figure 205: Middle East and Africa Market Y-o-Y Growth (%) Projections by Channel, 2025-2035
  • Figure 206: Middle East and Africa Market Attractiveness by Product Type, 2025-2035
  • Figure 207: Middle East and Africa Market Attractiveness by Key Ingredients, 2025-2035
  • Figure 208: Middle East and Africa Market Attractiveness by Skin Concern, 2025-2035
  • Figure 209: Middle East and Africa Market Attractiveness by Channel, 2025-2035
  • Figure 210: Middle East and Africa Market Attractiveness by Country, 2025-2035

Frequently Asked Questions

How big is the Buffering Skincare Products Market in 2025?

The global Buffering Skincare Products Market is estimated to be valued at USD 3,605.4 million in 2025.

What will be the size of Buffering Skincare Products Market in 2035?

The market size for the Buffering Skincare Products Market is projected to reach USD 7,906.8 million by 2035.

How much will be the Buffering Skincare Products Market growth between 2025 and 2035?

The Buffering Skincare Products Market is expected to grow at a 8.2% CAGR between 2025 and 2035.

What are the key product types in the Buffering Skincare Products Market?

The key product types in the Buffering Skincare Products Market are pH-balancing creams, toners & mists, face cleansers, and soothing gels, each formulated to maintain skin pH, restore the acid mantle, and support sensitive-skin balance.

Which range segment to contribute significant share in the Buffering Skincare Products Market in 2025?

In terms of skin concern, the sensitive-skin balance segment is projected to command a 49.5% share of the Buffering Skincare Products Market in 2025, driven by growing awareness of skin sensitivity, barrier repair, and dermatologist-recommended formulations designed for daily pH stabilization.

Explore Similar Insights

Future Market Insights

Buffering Skincare Products Market

Chat With MaRIA

Chat With

MaRIA

Hi There, I am MaRIA, Your Market Research Intelligence Assistant. How may I help you?