Reports

- Global Locations -

Headquarters

Future Market Insights, Inc.

Christiana Corporate, 200
Continental Drive, Suite 401,
Newark, Delaware - 19713,
United States

T: +1-845-579-5705

Americas

Future Market Insights, Inc.

616 Corporate Way, Suite 2-9018,
Valley Cottage, NY 10989, United States

T: +1-347-918-3531

MEA

Future Market Insights

1602-6 Jumeirah Bay X2 Tower, Plot No: JLT-PH2-X2A,
Jumeirah Lakes Towers, Dubai,
United Arab Emirates

Europe

Future Market Insights

3rd Floor, 207 Regent Street,
W1B 3HH London
United Kingdom

T: + 44 (0) 20 8123 9659
D: +44 (0) 20 3287 4268

Asia Pacific

Future Market Insights

IndiaLand Global Tech Park, Unit UG-1, Behind Grand HighStreet, Phase 1, Hinjawadi, MH, Pune – 411057, India

Skincare Packaging Market Outlook from 2024 to 2034

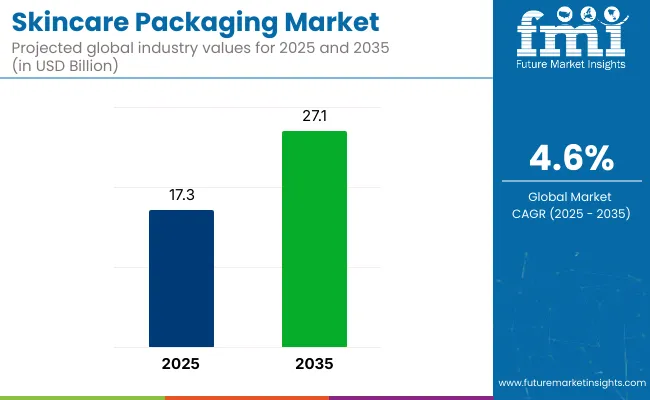
Global sales of skincare packaging are estimated to be valued at US$ 17,270.5 million in 2024 and further surge at 4.0% during the next ten years. By 2034, the global skincare packaging market size is forecast to reach US$ 25,590.3 million, highlighting the growth potential that this industry can offer to companies.

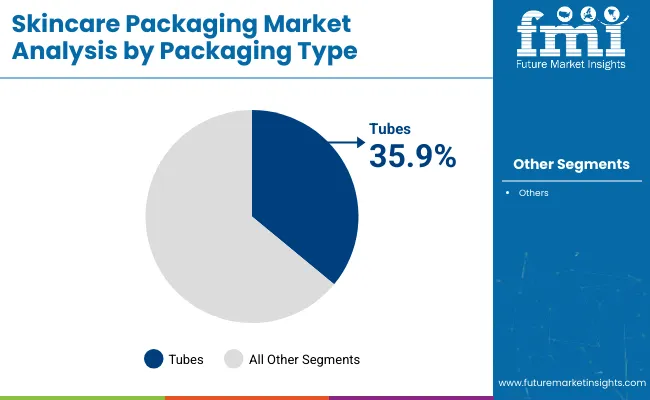
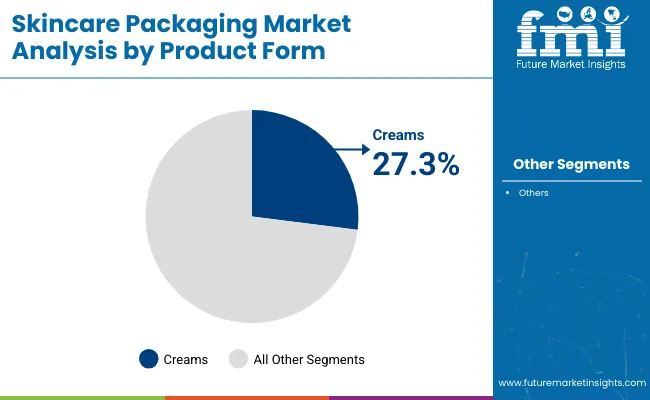
Tubes are significantly used in skincare product packaging, holding around 46% of the value share in 2024. Cleansers and toners are set to capture 35% of the value share in 2034 and grow 1.5 times its current market value during the forecast period. Liquid products dominate the industry, with more than 44% of the value share.

Attributes Key Insights
Base Market Value in 2023 US$ 16,593.3 million
Skincare Product Packaging Market Size in 2024 US$ 17,270.5 million
Market Value in 2034 US$ 25,590.3 million
Value CAGR (2024 to 2034) 4.0%

Don't pay for what you don't need

Customize your report by selecting specific countries or regions and save 30%!

Historical Performance Vs. Global Skincare Packaging Demand Outlook

Global skincare packaging sales recorded a CAGR of 2.2% during the historical period, with total market valuation reaching US$ 16,593.3 million in 2023. In the forecast period, the target industry is forecast to grow at 4.0% CAGR through 2034.

The skincare market is booming with professional skincare products containing natural and exotic ingredients taking the spotlight. This, in turn, is creating lucrative growth opportunities for skincare packaging companies.

Growing focus on self-care and the rising popularity of organic products are propelling demand for organic professional skin care products. Consumers have become more aware of their skincare and hygiene, resulting in higher demand for skincare products and packaging.

Global beauty and personal care brands are developing products for different skincare needs and utilizing exotic ingredients. This will further accelerate growth of skincare packaging market through 2034.

Consumers of all genders are becoming aware of personal grooming and using skincare products to maintain their skin conditions. The personal care industry is experiencing substantial growth, thereby creating demand for skincare packaging. The development of new products is also propelling demand for attractive and efficient skincare and cosmetic packaging solutions.

The development of innovative packaging solutions, such as droppers, airless pumps, and dispensers, will further boost market growth. Subsequently, growing popularity of sustainable packaging with minimalistic designs is set to benefit the market.

Key Factors Impacting Global Skincare Packaging Market Growth

Growing Demand for Beauty Packaging

Beauty packaging is preferred for its physical appearance that maintains and packages the different beauty items such as skin care, hair care, color cosmetics, fragrances, and personal care. The appearance of the skin care packaging is essential to maintain a long-lasting impression on consumers.

Packaging for skincare products must be flexible to accommodate any product type without limitations. Branding has become an important factor in differentiating the products off the shelf, and it has become a priority for cosmetics brands to stand out.

Companies and brands are focusing on gaining complete features, including material, printing, shape, and texture, to make the optimum packaging design for the products to gain attention. Skincare packaging that suits aesthetic purposes and ensures the product's complete integrity, convenience, and safety will witness higher demand through 2034.

Increasing Awareness of Organic Skincare Products

Consumers have become increasingly aware of their health and the products they are consuming especially after the pandemic. Rising awareness has resulted in choosing skincare and beauty products, creating growth prospects for the skincare product packaging market.

More and more consumers are inclined to the usages or organic skincare products compared to other items. This will open new growth windows for the skincare packaging brands during the assessment period.

Ismail Sutaria
Ismail Sutaria

Principal Consultant

Talk to Analyst

Find your sweet spots for generating winning opportunities in this market.

Overview of Adjacent Markets

The section comprehensively evaluates three interrelated markets: the global skincare packaging industry, the personal care packaging market, and the anti-counterfeit cosmetic packaging industry. It provides distinctive characteristics of each market, including their CAGRs, while delving into the pivotal factors that influence their growth trajectories.

Global Skincare Packaging Market Analysis:

Attributes Global Beauty Packaging Market Forecast
CAGR (2024 to 2034) 4.0%
Growth Factor Rising interest in personal grooming and wellness will boost growth of the beauty product packaging market.
Key Trends in the Skincare Packaging Market Simplified and functional packaging designs to reduce waste and appeal to minimalist aesthetics are gaining traction.

Overview of Personal Care Packaging Solution Industry:

Attributes Global Personal Care Packaging Sales Forecast
CAGR (2024 to 2034) 4.5%
Growth Factor Rising consumption of personal care products is set to increase the personal care packaging market size.
Key Trends in the Personal Care Packaging Market Growing popularity of intelligent packaging is a key trend observed in the market.

Global Anti-counterfeit Cosmetic Packaging Market:

Attributes Global Anti-counterfeit Cosmetic Packaging Industry Analysis
CAGR (2024 to 2034) 8.9%
Growth Factor Rising spending on skincare and cosmetic products is set to boost market growth.
Key Trend High adoption of digital authentication solutions is a key trend observed in the market.

Country-wise Insights

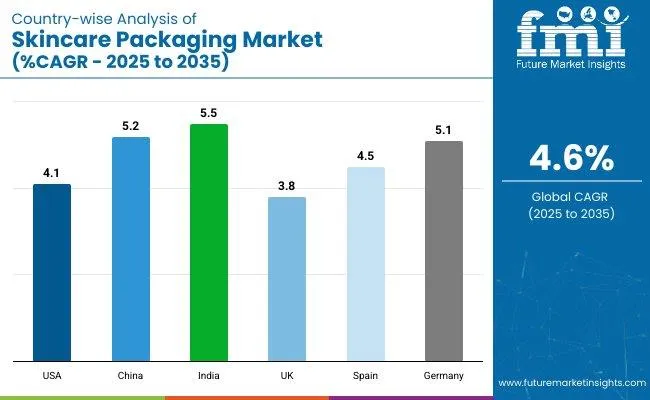
The table below shows the estimated growth projection of the top nations. India and Japan are set to emerge as lucrative markets for skincare packaging manufacturers, recording CAGRs of 7.4% and 5.4%, respectively, through 2034.

Countries Value (CAGR)
United States 2.2%
Canada 2.9%
Brazil 3.3%
Mexico 2.5%
Germany 1.3%
France 1.9%
United Kingdom 2.4%
China 4.8%
India 7.4%
Japan 5.4%
GCC Countries 4.8%
South Africa 4.3%

Booming Cosmetics Industry in Germany Propelling Demand

Germany is one of the leading skincare packaging markets across Europe and is poised to grow at 1.3% CAGR through 2034. This is attributable to flourishing cosmetics industry in the country, booming e-commerce, and growing popularity of natural and organic skincare products.

According to the Cosmetics Europe Personal Care Association, Europe is one of the leading markets for cosmetic products, with Germany accounting for US$ 15.5 billion in 2022 after France and Italy. This thriving sector is generating substantial demand for skincare packaging.

Consumers in Germany are focusing on self-care and personal well-being, resulting in rising demand for skincare products. This, in turn, is fueling demand for skincare packaging.

Strong presence of prominent cosmetic and skincare brands in the country is also playing a key role in boosting sales. These brands are increasingly looking for high-quality packaging solutions, creating lucrative growth opportunities for manufacturers.

China’s Thriving Personal Care Sector Fueling Sales Growth

China is set to create lucrative growth opportunities for the skincare and cosmetic packaging industry, with sales rising at 4.8% CAGR. This can be attributed to booming personal care sector and increasing consumer spending on several skincare items.

As per the International Trade Administration, the beauty and personal care industry in China recorded sales worth US$ 88 billion in 2021. Color cosmetics and fragrances have specifically shown impressive growth in China, resulting in higher demand for skincare packaging.

The evolution of the e-commerce sector, social media, and digitization in China has been increasingly influencing Chinese consumers to buy more beauty products. This will continue to provide impetus for the growth of skincare packaging market in China.

Top skincare brands in China are incorporating eye-catching and aesthetically pleasing packaging to attract customers on social media platforms. This is anticipated to positively impact sales of skincare packaging solutions in the country.

Get the data you need at a Fraction of the cost

Personalize your report by choosing insights you need
and save 40%!

Category-wise Insights

The section below sheds some light on leading segments along with their projected growth rates. Companies can use this information to invest in popular packaging formats and materials to solidify their positions in the global industry.

Based on packaging type, the tubes segment is predicted to maintain its market dominance, holding a share of 44.0% in 2034. By application, the cleansers and toners segment is forecast to account for a market share of 35.3% by 2034.

Tubes Remain Highly Sought-after Packaging Type

Packaging Type Value CAGR
Tubes 3.5%
Bottles & Jars 4.3%

Tubes are predicted to remain a widely used cosmetic packaging type, accounting for a revenue share of around 46% in 2024. Over the projection period, demand for tunes is predicted to rise at 3.5% CAGR.

Tubes are increasingly used for packaging skincare products, such as gels, creams, lotions, and serums, because of their convenience, customization, and eco-friendly features. Brands and skincare companies are using tubes over other packaging formats because of their easy filling and shipping process.

Tubes are highly customized and help companies differentiate their products. They also offer controlled dispensing. These benefits of tubes collectively make them a popular and practical choice for skin care products, meeting the needs of both manufacturers and consumers effectively.

On the other hand, the flexible pouches category is anticipated to record a higher 4.8% CAGR during the forecast period. This can be attributed to rising usage of their packaging solutions for packaging several skincare products due to their convenience and cost-effectiveness.

Skin Care Packaging Demand Remains High in Cleaners and Toners Category

Application Value CAGR
Cleanser & Toners 4.2%
Moisturizer 4.5%

As per the latest analysis, skincare packaging usage remains high in the cleanser and toners category, increasing at 4.2% CAGR through 2034. The target segment is set to generate revenue worth US$ 9,044.7 million by 2034. On the other hand, the moisturizers segment will grow at a higher CAGR of 4.5% from 2024 to 2034.

Cleansers and toners are prominently used by consumers because of their effectiveness in skincare. Cleansers remove dirt, oil, and impurities, while toners maintain skin PH. These products use containers such as pumps, bottles, plastic bottles, and tubes that help in easy dispensing and application for the products.

Growing focus on skincare and high usage of cleansers & toners are predicted to boost growth of the target segment through 2034. Similarly, flourishing facial cleaners and toners market will continue to propel demand for skincare packaging solutions.

Competition Landscape

Leading manufacturers of skincare packaging are focusing on developing innovative solutions from biodegradable and recycled materials to woo eco-conscious customers. They are also experimenting with interactive packaging by incorporating features like QR codes.

Several companies are working on aesthetics of their packaging formats to make them more appealing. Similarly, they are employing strategies like partnerships, distribution agreements, mergers, new facility establishments, and acquisitions to stay ahead of the competition.

Recent Developments

  • In November 2023, European packaging company Coveris Holdings developed a new recyclable solution, MonoFlex Thermoform.
  • In October 2023, the United States-based Aptar Beauty and Quadpack launched a refillable lipstick encased in wood.
  • In February 2023, Gerresheimer AG, a prominent Germany-based packaging company, collaborated with Medicos Beauty Group to present a sustainable and easy-to-use clickable refill system for cosmetics.
  • In April 2022, Albea SA, a leading France-based cosmetic packaging supplier, collaborated with Garnier to develop a cardboard-based tube with a single-component open-and-close system, which is a market-first solution.

Key Coverage in Global Skincare Packaging Market Research Report

  • Adjacent Study on Global Cosmetic Containers Market, Luxury Skincare Packaging Market, and Sustainable Skincare Packaging Market
  • Factors Boosting Innovative Skincare Packaging Market
  • Analysis of Cosmetic Packaging Industry in Developing Regions
  • Market Dynamics of Beauty Packaging in India
  • Expected Cosmetic Packaging Market Size in the United States
  • Emerging Trends in Luxury Skincare Packaging
  • Impact of Sustainable Packaging in Skincare Sector

Report Scope

Attribute Details
Market Value in 2024 US$ 17,270.5 million
Market Size in 2034 US$ 25,590.3 million
Growth Rate (2024 to 2034) 4.0% CAGR
Historical Data 2019 to 2023
Forecast Period 2024 to 2034
Quantitative Units Revenue in US$ million, Volume in Units, and CAGR from 2024 to 2034
Report Coverage Revenue Forecast, Volume Forecast, Company Ranking, Competitive Landscape, Growth Factors, Trends and Pricing Analysis
Segments Covered
  • Packaging Type
  • Order Type
  • Product Form
  • Distribution Channel
  • Application
  • Region
Key Regions Covered
  • North America
  • Latin America
  • East Asia
  • South Asia & Pacific
  • Western Europe
  • Eastern Europe
  • Middle East & Africa
Key Companies Profiled
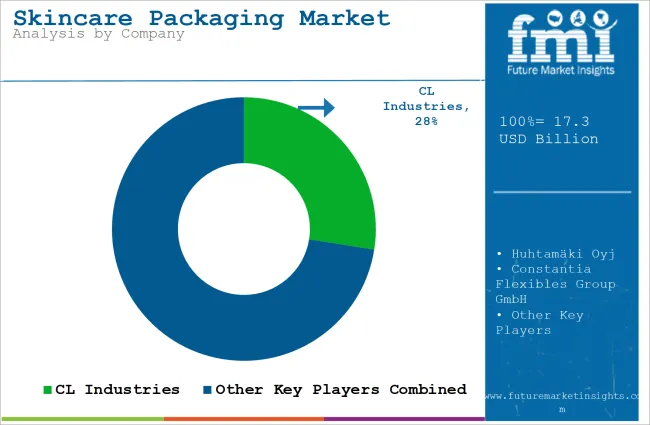
  • CCL Industries
  • Huhtamäki Oyj.
  • Constantia Flexibles Group GmbH
  • Mondi Plc
  • Uflex Ltd
  • Coveris Holdings S.A
  • AptarGroup, Inc.
  • Proampac Llc
  • Gerresheimer Ag
  • Epl Limited
  • Berry Global Group, Inc.
  • Albéa S.A
  • Hoffman Neopac Ag
  • Amcor Plc
  • Alpla Group
  • Comar Llc
  • Montebello Packaging Inc.
  • Klockner Pentaplast Group
  • Owens-Illinois, Inc.
  • Glenroy, Inc.
  • Andpak Inc.
  • Ets Bugnon
  • Apackaging Group Llc
  • Plastube Inc
  • Linhardt Gmbh & Co. Kg
  • Ctl Pack
  • Alltub Group
  • Tubopress Italia S.R.L.
  • Quad Pack Company
  • Burhani Packaging
  • Viva Packaging

Global Skincare Packaging Market Segmentation

By Packaging Type:

  • Tubes
    • Plastic Barrier Laminated Tube (PBL)
    • Aluminum Barrier Laminated Tube (ABL)
    • COEX Tube
  • Bottles & Jars
  • Flexible Pouches

By Product Form:

  • Ointments
  • Creams
  • Gels and Sols
  • Liquids

By Order Type:

  • OTC
  • Prescription

By Distribution Channel:

  • Institutional Sales
    • Hospitals / Clinics
    • Public Health Agencies
    • Veterinary Hospitals & Clinics
  • Retail Sales
    • Retail Pharmacies / Supermarkets
    • Drug Stores
  • E-commerce

By Application:

  • Cleanser & Toners
  • Moisturizer
  • Sunscreen
  • Serum & Tonics

By Region:

  • North America
  • Latin America
  • East Asia
  • South Asia & Pacific
  • Western Europe
  • Eastern Europe
  • Middle East & Africa

Frequently Asked Questions

How big is the skincare packaging market?

The global market value is set to total US$ 17,270.5 million in 2024.

What is the demand outlook for skin care packaging?

Global skincare packaging demand is forecast to rise at 4.0% CAGR.

What is the projected market size for 2034?

In 2034, the skincare packaging market size is anticipated to reach US$ 25,590.3 million.

Who are the top players in the skincare packaging industry?

Amcor Plc, Gerresheimer AG, Berry Global, and CCL Industries.

What is the best packaging for skincare products?

Jars, compacts, sprayers, and collapsible tubes, among others.

What is the size of the skincare market?

The global skincare market value reached US$ 16,593.3 million in 2023.

Why is skincare packaging important?

Skincare formulations are sensitive and hence require packaging to protect them from external environment.

What is the primary packaging of beauty products?

Generally, plastic and glass materials are used for packaging beauty products.

Table of Content

1. Executive Summary

    1.1. Global Market Outlook

    1.2. Market Analysis

    1.3. Future Market Insights (FMI) Analysis and Recommendations

2. Market Overview

    2.1. Market Coverage / Taxonomy

    2.2. Market Definition / Scope / Limitations

3. Key Market Trends

    3.1. Key Trends Impacting the Market

    3.2. Sustainable Trends

    3.3. Product Innovation / Development Trends

    3.4. Regulations/Regulatory Scenario

4. Key Success Factors

    4.1. Product Adoption / Usage Analysis

    4.2. Product USP’s / Features

    4.3. Strategic Promotional Strategies

    4.4. PESTLE Analysis

    4.5. Porter’s Five Forces Analysis

    4.6. Go-to-market Strategies

5. Global Market Demand Analysis 2019 to 2023 and Forecast, 2024 to 2034

    5.1. Historical Market Volume (Units) Analysis, 2019 to 2023

    5.2. Current and Future Market Volume (Units) Projections, 2024 to 2034

    5.3. Y-o-Y Growth Trend Analysis

6. Global Market - Pricing Analysis

    6.1. Country Level Pricing Analysis

    6.2. Regional Pricing Analysis

    6.3. Global Average Pricing Analysis Benchmark

7. Global Market Demand (in Value or Size in US$ million) Analysis 2019 to 2023 and Forecast, 2024 to 2034

    7.1. Historical Market Value (US$ million) Analysis, 2019 to 2023

    7.2. Current and Future Market Value (US$ million) Projections, 2024 to 2034

        7.2.1. Y-o-Y Growth Trend Analysis

        7.2.2. Absolute $ Opportunity Analysis

8. Market Background

    8.1. Global Packaging Market Overview

    8.2. Forecast Factors - Relevance & Impact

    8.3. In-house and Contract Distribution Channel for Market Analysis

    8.4. Primary and Secondary Packaging for Market

    8.5. Value Chain Analysis

        8.5.1. Exhaustive List of Raw Material Suppliers

        8.5.2. Exhaustive List of Manufacturers/Distributor

        8.5.3. Exhaustive List of End Users / Brands (Potential Customers)

    8.6. Who Supplies Whom in Supply Chain

    8.7. Case-based Scenario – Impact Assessment

        8.7.1. Current Statistics

        8.7.2. Short-Mid-Long Term Outlook

        8.7.3. Likely Rebound

    8.8. Market Dynamics

        8.8.1. Drivers

        8.8.2. Restraints

        8.8.3. Opportunity Analysis

    8.9. Supply Demand Analysis

        8.9.1. Import Data

        8.9.2. Export Data

        8.9.3. Production Data

9. Global Market Analysis 2019 to 2023 and Forecast 2024 to 2034, By Packaging Type

    9.1. Introduction / Key Findings

    9.2. Historical Market Size (US$ million) and Volume (Units) Analysis, By Packaging Type, 2019 to 2023

    9.3. Current and Future Market Size (US$ million) and Volume (Units) Analysis and Forecast, By Packaging Type, 2024 to 2034

        9.3.1. Tubes

            9.3.1.1. Plastic Barrier Laminated Tube (PBL)

            9.3.1.2. Aluminum Barrier Laminated Tube (ABL)

            9.3.1.3. COEX Tube

        9.3.2. Bottles & Jars

        9.3.3. Flexible Pouches

    9.4. Market Attractiveness Analysis, By Packaging Type

10. Global Market Analysis 2019 to 2023 and Forecast 2024 to 2034, By Order Type

    10.1. Introduction / Key Findings

    10.2. Historical Market Size (US$ million) and Volume (Units) Analysis, By Order Type, 2019 to 2023

    10.3. Current and Future Market Size (US$ million) and Volume (Units) Analysis and Forecast, By Order Type, 2024 to 2034

        10.3.1. OTC (Over-the-counter)

        10.3.2. Prescription

    10.4. Market Attractiveness Analysis, By Order Type

11. Global Market Analysis 2019 to 2023 and Forecast 2024 to 2034, By Product Form

    11.1. Introduction / Key Findings

    11.2. Historical Market Size (US$ million) and Volume (Units) Analysis, By Product Form, 2019 to 2023

    11.3. Current and Future Market Size (US$ million) and Volume (Units) Analysis and Forecast, By Product Form, 2024 to 2034

        11.3.1. Ointments

        11.3.2. Creams

        11.3.3. Gels and Sols

        11.3.4. Liquids

    11.4. Market Attractiveness Analysis, By Product Form

12. Global Market Analysis 2019 to 2023 and Forecast 2024 to 2034, By Distribution Channel

    12.1. Introduction / Key Findings

    12.2. Historical Market Size (US$ million) and Volume (Units) Analysis, By Distribution Channel, 2019 to 2023

    12.3. Current and Future Market Size (US$ million) and Volume (Units) Analysis and Forecast, By Distribution Channel, 2024 to 2034

        12.3.1. Institutional Sales

            12.3.1.1. Hospitals / Clinics

            12.3.1.2. Public Health Agencies

            12.3.1.3. Veterinary Hospitals & Clinics

        12.3.2. Retail Sales

            12.3.2.1. Retail Pharmacies / Supermarkets

            12.3.2.2. Drug Stores

        12.3.3. E-commerce

    12.4. Market Attractiveness Analysis, By Distribution Channel

13. Global Market Analysis 2019 to 2023 and Forecast 2024 to 2034, By Application

    13.1. Introduction / Key Findings

    13.2. Historical Market Size (US$ million) and Volume (Units) Analysis, By Application, 2019 to 2023

    13.3. Current and Future Market Size (US$ million) and Volume (Units) Analysis and Forecast, By Application, 2024 to 2034

        13.3.1. Cleanser & Toners

        13.3.2. Moisturizer

        13.3.3. Sunscreen

        13.3.4. Serum & Tonics

    13.4. Market Attractiveness Analysis, By Application

14. Global Market Analysis 2019 to 2023 and Forecast 2024 to 2034, by Region

    14.1. Introduction / Key Findings

    14.2. Historical Market Size (US$ million) and Volume (Units) Analysis, By Region, 2019 to 2023

    14.3. Current and Future Market Size (US$ million) and Volume (Units) Analysis and Forecast, By Region, 2024 to 2034

        14.3.1. North America

        14.3.2. Latin America

        14.3.3. East Asia

        14.3.4. South Asia & Pacific

        14.3.5. Western Europe

        14.3.6. Eastern Europe

        14.3.7. Middle East and Africa

    14.4. Market Attractiveness Analysis, By Region

15. North America Market Analysis 2019 to 2023 and Forecast 2024 to 2034

    15.1. Introduction / Key Findings

    15.2. Historical Market Size (US$ million) and Volume (Units) Analysis by Market Taxonomy, 2019 to 2023

    15.3. Current Market Size (US$ million) and Volume (Units) Analysis and Forecast by Market Taxonomy, 2024 to 2034

        15.3.1. By Country

            15.3.1.1. United States

            15.3.1.2. Canada

            15.3.1.3. Mexico

        15.3.2. By Packaging Type

        15.3.3. By Packaging Format

        15.3.4. By Order Type

        15.3.5. By Distribution Channel

        15.3.6. By Application

    15.4. Market Attractiveness Analysis

        15.4.1. By Country

        15.4.2. By Packaging Type

        15.4.3. By Packaging Format

        15.4.4. By Order Type

        15.4.5. By Distribution Channel

        15.4.6. By Application

    15.5. Cross Section Analysis by Segments

16. Latin America Market Analysis 2019 to 2023 and Forecast 2024 to 2034

    16.1. Introduction / Key Findings

    16.2. Historical Market Size (US$ million) and Volume (Units) Analysis by Market Taxonomy, 2019 to 2023

    16.3. Current Market Size (US$ million) and Volume (Units) Analysis and Forecast by Market Taxonomy, 2024 to 2034

        16.3.1. By Country

            16.3.1.1. Brazil

            16.3.1.2. Columbia

            16.3.1.3. Argentina

            16.3.1.4. Rest of Latin America

        16.3.2. By Packaging Type

        16.3.3. By Packaging Format

        16.3.4. By Order Type

        16.3.5. By Distribution Channel

        16.3.6. By Application

    16.4. Market Attractiveness Analysis

        16.4.1. By Country

        16.4.2. By Packaging Type

        16.4.3. By Packaging Format

        16.4.4. By Order Type

        16.4.5. By Distribution Channel

        16.4.6. By Application

    16.5. Cross Section Analysis by Segments

17. East Asia Market Analysis 2019 to 2023 and Forecast 2024 to 2034

    17.1. Introduction / Key Findings

    17.2. Historical Market Size (US$ million) and Volume (Units) Analysis by Market Taxonomy, 2019 to 2023

    17.3. Current Market Size (US$ million) and Volume (Units) Analysis and Forecast by Market Taxonomy, 2024 to 2034

        17.3.1. By Country

            17.3.1.1. China

            17.3.1.2. Japan

            17.3.1.3. South Korea

        17.3.2. By Packaging Type

        17.3.3. By Packaging Format

        17.3.4. By Order Type

        17.3.5. By Distribution Channel

        17.3.6. By Application

    17.4. Market Attractiveness Analysis

        17.4.1. By Country

        17.4.2. By Packaging Type

        17.4.3. By Packaging Format

        17.4.4. By Order Type

        17.4.5. By Distribution Channel

        17.4.6. By Application

    17.5. Cross Section Analysis by Segments

18. South Asia & Pacific Market Analysis 2019 to 2023 and Forecast 2024 to 2034

    18.1. Introduction / Key Findings

    18.2. Historical Market Size (US$ million) and Volume (Units) Analysis by Market Taxonomy, 2019 to 2023

    18.3. Current Market Size (US$ million) and Volume (Units) Analysis and Forecast by Market Taxonomy, 2024 to 2034

        18.3.1. By Country

            18.3.1.1. India

            18.3.1.2. ASEAN Countries

            18.3.1.3. Australia & New Zealand

        18.3.2. By Packaging Type

        18.3.3. By Packaging Format

        18.3.4. By Order Type

        18.3.5. By Distribution Channel

        18.3.6. By Application

    18.4. Market Attractiveness Analysis

        18.4.1. By Country

        18.4.2. By Packaging Type

        18.4.3. By Packaging Format

        18.4.4. By Order Type

        18.4.5. By Distribution Channel

        18.4.6. By Application

    18.5. Cross Section Analysis by Segments

19. Western Europe Market Analysis 2019 to 2023 and Forecast 2024 to 2034

    19.1. Introduction / Key Findings

    19.2. Historical Market Size (US$ million) and Volume (Units) Analysis by Market Taxonomy, 2019 to 2023

    19.3. Current Market Size (US$ million) and Volume (Units) Analysis and Forecast by Market Taxonomy, 2024 to 2034

        19.3.1. By Country

            19.3.1.1. Germany

            19.3.1.2. France

            19.3.1.3. Spain

            19.3.1.4. Italy

            19.3.1.5. United Kingdom

            19.3.1.6. BENELUX

            19.3.1.7. Nordics

            19.3.1.8. Rest of Western Europe

        19.3.2. By Packaging Type

        19.3.3. By Packaging Format

        19.3.4. By Order Type

        19.3.5. By Distribution Channel

        19.3.6. By Application

    19.4. Market Attractiveness Analysis

        19.4.1. By Country

        19.4.2. By Packaging Type

        19.4.3. By Packaging Format

        19.4.4. By Order Type

        19.4.5. By Distribution Channel

        19.4.6. By Application

    19.5. Cross Section Analysis by Segments

20. Eastern Europe Market Analysis 2019 to 2023 and Forecast 2024 to 2034

    20.1. Introduction / Key Findings

    20.2. Historical Market Size (US$ million) and Volume (Units) Analysis by Market Taxonomy, 2019 to 2023

    20.3. Current Market Size (US$ million) and Volume (Units) Analysis and Forecast by Market Taxonomy, 2024 to 2034

        20.3.1. By Country

            20.3.1.1. Russia

            20.3.1.2. Poland

            20.3.1.3. Hungary

            20.3.1.4. Austria

            20.3.1.5. Czech Republic

            20.3.1.6. Rest of Eastern Europe

        20.3.2. By Packaging Type

        20.3.3. By Packaging Format

        20.3.4. By Order Type

        20.3.5. By Distribution Channel

        20.3.6. By Application

    20.4. Market Attractiveness Analysis

        20.4.1. By Country

        20.4.2. By Packaging Type

        20.4.3. By Packaging Format

        20.4.4. By Order Type

        20.4.5. By Distribution Channel

        20.4.6. By Application

    20.5. Cross Section Analysis by Segments

21. Middle East & Africa Market Analysis 2019 to 2023 and Forecast 2024 to 2034

    21.1. Introduction / Key Findings

    21.2. Historical Market Size (US$ million) and Volume (Units) Analysis by Market Taxonomy, 2019 to 2023

    21.3. Current Market Size (US$ million) and Volume (Units) Analysis and Forecast by Market Taxonomy, 2024 to 2034

        21.3.1. By Country

            21.3.1.1. GCC Countries

            21.3.1.2. Turkiye

            21.3.1.3. Northern Africa

            21.3.1.4. South Africa

            21.3.1.5. Israel

        21.3.2. By Packaging Type

        21.3.3. By Packaging Format

        21.3.4. By Order Type

        21.3.5. By Distribution Channel

        21.3.6. By Application

    21.4. Market Attractiveness Analysis

        21.4.1. By Country

        21.4.2. By Packaging Type

        21.4.3. By Packaging Format

        21.4.4. By Order Type

        21.4.5. By Distribution Channel

        21.4.6. By Application

    21.5. Cross Section Analysis by Segments

22. Country wise Market Analysis 2024 to 2034

    22.1. United States Market Analysis

        22.1.1. By Packaging Type

        22.1.2. By Packaging Format

        22.1.3. By Order Type

        22.1.4. By Distribution Channel

        22.1.5. By Application

    22.2. Canada Market Analysis

        22.2.1. By Packaging Type

        22.2.2. By Packaging Format

        22.2.3. By Order Type

        22.2.4. By Distribution Channel

        22.2.5. By Application

    22.3. Brazil Market Analysis

        22.3.1. By Packaging Type

        22.3.2. By Packaging Format

        22.3.3. By Order Type

        22.3.4. By Distribution Channel

        22.3.5. By Application

    22.4. Mexico Market Analysis

        22.4.1. By Packaging Type

        22.4.2. By Packaging Format

        22.4.3. By Order Type

        22.4.4. By Distribution Channel

        22.4.5. By Application

    22.5. Germany Market Analysis

        22.5.1. By Packaging Type

        22.5.2. By Packaging Format

        22.5.3. By Order Type

        22.5.4. By Distribution Channel

        22.5.5. By Application

    22.6. United Kingdom Market Analysis

        22.6.1. By Packaging Type

        22.6.2. By Packaging Format

        22.6.3. By Order Type

        22.6.4. By Distribution Channel

        22.6.5. By Application

    22.7. Spain Market Analysis

        22.7.1. By Packaging Type

        22.7.2. By Packaging Format

        22.7.3. By Order Type

        22.7.4. By Distribution Channel

        22.7.5. By Application

    22.8. France Market Analysis

        22.8.1. By Packaging Type

        22.8.2. By Packaging Format

        22.8.3. By Order Type

        22.8.4. By Distribution Channel

        22.8.5. By Application

    22.9. Italy Market Analysis

        22.9.1. By Packaging Type

        22.9.2. By Packaging Format

        22.9.3. By Order Type

        22.9.4. By Distribution Channel

        22.9.5. By Application

    22.10. China Market Analysis

        22.10.1. By Packaging Type

        22.10.2. By Packaging Format

        22.10.3. By Order Type

        22.10.4. By Distribution Channel

    22.11. Japan Market Analysis

        22.11.1. By Packaging Type

        22.11.2. By Packaging Format

        22.11.3. By Order Type

        22.11.4. By Distribution Channel

        22.11.5. By Application

    22.12. India Market Analysis

        22.12.1. By Packaging Type

        22.12.2. By Packaging Format

        22.12.3. By Order Type

        22.12.4. By Distribution Channel

        22.12.5. By Application

    22.13. Australia Market Analysis

        22.13.1. By Packaging Type

        22.13.2. By Packaging Format

        22.13.3. By Order Type

        22.13.4. By Distribution Channel

        22.13.5. By Application

    22.14. GCC Countries Market Analysis

        22.14.1. By Packaging Type

        22.14.2. By Packaging Format

        22.14.3. By Order Type

        22.14.4. By Distribution Channel

        22.14.5. By Application

    22.15. Türkiye Countries Market Analysis

        22.15.1. By Packaging Type

        22.15.2. By Packaging Format

        22.15.3. By Order Type

        22.15.4. By Distribution Channel

        22.15.5. By Application

    22.16. Colombia Countries Market Analysis

        22.16.1. By Packaging Type

        22.16.2. By Packaging Format

        22.16.3. By Order Type

        22.16.4. By Distribution Channel

        22.16.5. By Application

    22.17. South Africa Market Analysis

        22.17.1. By Packaging Type

        22.17.2. By Packaging Format

        22.17.3. By Order Type

        22.17.4. By Distribution Channel

        22.17.5. By Application

23. Brand Share Analysis

    23.1. Key Available Brands in the Market

        23.1.1. Johnson & Johnson

            23.1.1.1. Product Portfolio

            23.1.1.2. Market Share (%)

            23.1.1.3. Investment in Packaging

            23.1.1.4. Sales/Turnover

            23.1.1.5. Strategy

            23.1.1.6. Go-to Market

            23.1.1.7. Preferred Channel Partners and Suppliers (The same will be provided for all the companies)

        23.1.2. The Estee Lauder

        23.1.3. Unilever

        23.1.4. New Avon

        23.1.5. Loreal

        23.1.6. Kao Group

        23.1.7. Colgate-Palmolive

        23.1.8. Shiseido

        23.1.9. Beiersdorf

        23.1.10. P&G

24. Market Structure Analysis

    24.1. Market Analysis by Tier of Companies

    24.2. Market Share Analysis of Top Players

    24.3. Market Presence Analysis

25. Competition Analysis

    25.1. Competition Dashboard

    25.2. Competition Benchmarking

    25.3. Competition Deep Dive/ Portfolio Analysis (Key Global Market Players)

        25.3.1. CCL Industries

            25.3.1.1. Overview

            25.3.1.2. Product Portfolio

            25.3.1.3. Profitability by Market Segments (Packaging Type/Product Form/Order Type/Distribution Channel/Application/Region)

            25.3.1.4. Sales Footprint

            25.3.1.5. Strategy Overview

        25.3.2. Huhtamäki Oyj.

        25.3.3. Constantia Flexibles Group GmbH

        25.3.4. Mondi Plc

        25.3.5. Uflex Ltd

        25.3.6. Coveris Holdings S.A

        25.3.7. Aptar Group, Inc.

        25.3.8. Proampac Llc

        25.3.9. Gerresheimer Ag

        25.3.10. Epl Limited

        25.3.11. Berry Global Group, Inc

        25.3.12. Albéa S.A

        25.3.13. Hoffman Neopac Ag

        25.3.14. Amcor Plc

        25.3.15. Alpla Group

        25.3.16. Comar Llc

        25.3.17. Montebello Packaging Inc

        25.3.18. Klockner Pentaplast Group

        25.3.19. Owens-Illinois, Inc

        25.3.20. Glenroy, Inc

        25.3.21. Andpak Inc

        25.3.22. Ets Bugnon

        25.3.23. Apackaging Group Llc

        25.3.24. Plastube Inc

        25.3.25. Linhardt Gmbh & Co. Kg

        25.3.26. Ctl Pack

        25.3.27. Alltub Group

        25.3.28. Tubopress Italia S.R.L.

        25.3.29. Quad Pack Company

        25.3.30. Burhani Packaging

        25.3.31. Viva Packaging

*The above list is indicative in nature and is subject to change during the course of research

26. Assumptions and Acronyms Used

27. Research Methodology

List of Tables

Table 01: Global Market Value (US$ million) by Packaging Type, 2019H to 2034F

Table 02: Global Market Volume (Units) by Packaging Type, 2019H to 2034F

Table 03: Global Market Value (US$ million) by Order Type, 2019H to 2034F

Table 04: Global Market Volume (Units) by Order Type, 2019H to 2034F

Table 05: Global Market Value (US$ million) by Product Form, 2019H to 2034F

Table 06: Global Market Volume (Units) by Product Form, 2019H to 2034F

Table 07: Global Market Value (US$ million) by Distribution Channel, 2019H to 2034F

Table 08: Global Market Volume (US$ million) by Distribution Channel, 2019H to 2034F

Table 07: Global Market Value (US$ million) by Application, 2019H to 2034F

Table 08: Global Market Volume (US$ million) by Application, 2019H to 2034F

Table 09: Global Market Value (US$ million) by Region, 2019H to 2034F

Table 10: Global Market Volume (Units) by Region, 2019H to 2034F

Table 11: North America Market Value (US$ million) by Packaging Type, 2019H to 2034F

Table 12: North America Market Volume (Units) by Packaging Type, 2019H to 2034F

Table 13: North America Market Value (US$ million) by Order Type, 2019H to 2034F

Table 14: North America Market Volume (Units) by Order Type, 2019H to 2034F

Table 15: North America Market Value (US$ million) by Product Form, 2019H to 2034F

Table 16: North America Market Volume (Units) by Product Form, 2019H to 2034F

Table 17: North America Market Value (US$ million) by Distribution Channel, 2019H to 2034F

Table 18: North America Market Volume (Units) by Distribution Channel, 2019H to 2034F

Table 19: North America Market Value (US$ million) by Application, 2019H to 2034F

Table 20: North America Market Volume (Units) by Application, 2019H to 2034F

Table 21: North America Market Value (US$ million) by Country, 2019H to 2034F

Table 22: North America Market Volume (Units) by Country, 2019H to 2034F

Table 23: Latin America Market Value (US$ million) by Packaging Type, 2019H to 2034F

Table 24: Latin America Market Volume (Units) by Packaging Type, 2019H to 2034F

Table 25: Latin America Market Value (US$ million) by Order Type, 2019H to 2034F

Table 26: Latin America Market Volume (Units) by Order Type, 2019H to 2034F

Table 27: Latin America Market Value (US$ million) by Product Form, 2019H to 2034F

Table 28: Latin America Market Volume (Units) by Product Form, 2019H to 2034F

Table 29: Latin America Market Value (US$ million) by Distribution Channel, 2019H to 2034F

Table 30: Latin America Market Volume (Units) by Distribution Channel, 2019H to 2034F

Table 31: Latin America Market Value (US$ million) by Application, 2019H to 2034F

Table 32: Latin America Market Volume (Units) by Application, 2019H to 2034F

Table 33: Latin America Market Value (US$ million) by Country, 2019H to 2034F

Table 34: Latin America Market Volume (Units) by Country, 2019H to 2034F

Table 35: East Asia Market Value (US$ million) by Packaging Type, 2019H to 2034F

Table 36: East Asia Market Volume (Units) by Packaging Type, 2019H to 2034F

Table 37: East Asia Market Value (US$ million) by Order Type, 2019H to 2034F

Table 38: East Asia Market Volume (Units) by Order Type, 2019H to 2034F

Table 39: East Asia Market Value (US$ million) by Product Form, 2019H to 2034F

Table 40: East Asia Market Volume (Units) by Product Form, 2019H to 2034F

Table 41: East Asia Market Value (US$ million) by Distribution Channel, 2019H to 2034F

Table 42: East Asia Market Volume (Units) by Distribution Channel, 2019H to 2034F

Table 43: East Asia Market Value (US$ million) by Application, 2019H to 2034F

Table 44: East Asia Market Volume (Units) by Application, 2019H to 2034F

Table 45: East Asia Market Value (US$ million) by Country, 2019H to 2034F

Table 46: East Asia Market Volume (Units) by Country, 2019H to 2034F

Table 47: South Asia & Pacific Market Value (US$ million) by Packaging Type, 2019H to 2034F

Table 48: South Asia & Pacific Market Volume (Units) by Packaging Type, 2019H to 2034F

Table 49: South Asia & Pacific Market Value (US$ million) by Order Type, 2019H to 2034F

Table 50: South Asia & Pacific Market Volume (Units) by Order Type, 2019H to 2034F

Table 51: South Asia & Pacific Market Value (US$ million) by Product Form, 2019H to 2034F

Table 52: South Asia & Pacific Market Volume (Units) by Product Form, 2019H to 2034F

Table 53: South Asia & Pacific Market Value (US$ million) by Distribution Channel, 2019H to 2034F

Table 54: South Asia & Pacific Market Volume (Units) by Distribution Channel, 2019H to 2034F

Table 55: South Asia & Pacific Market Value (US$ million) by Application, 2019H to 2034F

Table 56: South Asia & Pacific Market Volume (Units) by Application, 2019H to 2034F

Table 57: South Asia & Pacific Market Value (US$ million) by Country, 2019H to 2034F

Table 58: South Asia & Pacific Market Volume (Units) by Country, 2019H to 2034F

Table 59: Western Europe Market Value (US$ million) by Packaging Type, 2019H to 2034F

Table 60: Western Europe Market Volume (Units) by Packaging Type, 2019H to 2034F

Table 61: Western Europe Market Value (US$ million) by Order Type, 2019H to 2034F

Table 62: Western Europe Market Volume (Units) by Order Type, 2019H to 2034F

Table 63: Western Europe Market Value (US$ million) by Product Form, 2019H to 2034F

Table 64: Western Europe Market Volume (Units) by Product Form, 2019H to 2034F

Table 65: Western Europe Market Value (US$ million) by Distribution Channel, 2019H to 2034F

Table 66: Western Europe Market Volume (Units) by Distribution Channel, 2019H to 2034F

Table 67: Western Europe Market Value (US$ million) by Application, 2019H to 2034F

Table 68: Western Europe Market Volume (Units) by Application, 2019H to 2034F

Table 69: Western Europe Market Value (US$ million) by Country, 2019H to 2034F

Table 70: Western Europe Market Volume (Units) by Country, 2019H to 2034F

Table 71: Eastern Europe Market Value (US$ million) by Packaging Type, 2019H to 2034F

Table 72: Eastern Europe Market Volume (Units) by Packaging Type, 2019H to 2034F

Table 73: Eastern Europe Market Value (US$ million) by Order Type, 2019H to 2034F

Table 74: Eastern Europe Market Volume (Units) by Order Type, 2019H to 2034F

Table 75: Eastern Europe Market Value (US$ million) by Product Form, 2019H to 2034F

Table 76: Eastern Europe Market Volume (Units) by Product Form, 2019H to 2034F

Table 77: Eastern Europe Market Value (US$ million) by Distribution Channel, 2019H to 2034F

Table 78: Eastern Europe Market Volume (Units) by Application, 2019H to 2034F

Table 79: Eastern Europe Market Value (US$ million) by Application, 2019H to 2034F

Table 80: Eastern Europe Market Volume (Units) by Application, 2019H to 2034F

Table 81: Eastern Europe Market Value (US$ million) by Country, 2019H to 2034F

Table 82: Eastern Europe Market Volume (Units) by Country, 2019H to 2034F

Table 83: Middle East & Africa Market Value (US$ million) by Packaging Type, 2019H to 2034F

Table 83: Middle East & Africa Market Volume (Units) by Packaging Type, 2019H to 2034F

Table 84: Middle East & Africa Market Value (US$ million) by Order Type, 2019H to 2034F

Table 85: Middle East & Africa Market Volume (Units) by Order Type, 2019H to 2034F

Table 86: Middle East & Africa Market Value (US$ million) by Product Form, 2019H to 2034F

Table 87: Middle East & Africa Market Volume (Units) by Product Form, 2019H to 2034F

Table 88: Middle East & Africa Market Value (US$ million) by Distribution Channel, 2019H to 2034F

Table 89: Middle East & Africa Market Volume (Units) by Distribution Channel, 2019H to 2034F

Table 90: Middle East & Africa Market Value (US$ million) by Application, 2019H to 2034F

Table 91: Middle East & Africa Market Volume (Units) by Application, 2019H to 2034F

Table 92: Middle East & Africa Market Value (US$ million) by Country, 2019H to 2034F

Table 93: Middle East & Africa Market Volume (Units) by Country, 2019H to 2034F

List of Charts

Figure 01: Global Market Share Analysis, by Packaging Type, 2024E to 2034F

Figure 02: Global Market Y-o-Y Analysis, by Packaging Type, 2019H to 2034F

Figure 03: Global Market Attractiveness Analysis, by Packaging Type, 2024E to 2034F

Figure 04: Global Market Share Analysis, by Order Type, 2024E to 2034F

Figure 05: Global Market Y-o-Y Analysis, by Order Type, 2019H to 2034F

Figure 06: Global Market Attractiveness Analysis, by Order Type, 2024E to 2034F

Figure 07: Global Market Share Analysis, by Product Form, 2024E to 2034F

Figure 08: Global Market Y-o-Y Analysis, by Product Form, 2019H to 2034F

Figure 09: Global Market Attractiveness Analysis, by Product Form, 2024E to 2034F

Figure 10: Global Market Share Analysis, by Distribution Channel, 2024E to 2034F

Figure 11: Global Market Y-o-Y Analysis, by Distribution Channel, 2019H to 2034F

Figure 12: Global Market Attractiveness Analysis, by Distribution Channel, 2024E to 2034F

Figure 13: Global Market Share Analysis, by Application, 2024E to 2034F

Figure 14: Global Market Y-o-Y Analysis, by Application, 2019H to 2034F

Figure 15: Global Market Attractiveness Analysis, by Application, 2024E to 2034F

Figure 16: Global Market Share Analysis, by region, 2024E to 2034F

Figure 17: Global Market Y-o-Y Analysis, by region, 2019H to 2034F

Figure 18: Global Market Attractiveness Analysis, by region, 2024E to 2034F

Figure 19: North America Market Attractiveness Analysis, by Packaging Type, 2024E to 2034F

Figure 20: North America Market Y-o-Y Analysis, by Order Type, 2019H to 2034F

Figure 21: North America Market Value Share Analysis, by Product Form, 2024(E)

Figure 22: North America Market Value Share Analysis, by Distribution Channel 2024(E)

Figure 23: North America Market Value Share Analysis, by Application 2024(E)

Figure 24: North America Market Share Analysis, by Country, 2024E to 2034F

Figure 25: Latin America Market Y-o-Y Analysis, by Packaging Type, 2019H to 2034F

Figure 26: Latin America Market Y-o-Y Analysis, by Order Type, 2019H to 2034F

Figure 27: Latin America Market Value Share Analysis, by Product Form, 2024(E)

Figure 28: Latin America Market Value Share Analysis, by Distribution Channel 2024(E)

Figure 29: Latin America Market Value Share Analysis, by Application 2024(E)

Figure 30: Latin America Market Share Analysis, by Country, 2024E to 2034F

Figure 31: East Asia Market Y-o-Y Analysis, by Packaging Type, 2019H to 2034F

Figure 32: East Asia Market Y-o-Y Analysis, by Order Type, 2019H to 2034F

Figure 33: East Asia Market Value Share Analysis, by Product Form, 2024(E)

Figure 34: East Asia Market Value Share Analysis, by Distribution Channel 2024(E)

Figure 35: East Asia Market Value Share Analysis, by Application 2024(E)

Figure 36: East Asia Market Share Analysis, by Country, 2024E to 2034F

Figure 37: South Asia & Pacific Market Y-o-Y Analysis, by Packaging Type, 2019H to 2034F

Figure 38: South Asia & Pacific Market Y-o-Y Analysis, by Order Type, 2019H to 2034F

Figure 39: South Asia & Pacific Market Value Share Analysis, by Product Form, 2024(E)

Figure 40: South Asia & Pacific Market Value Share Analysis, by Distribution Channel 2024(E)

Figure 41: South Asia & Pacific Market Value Share Analysis, by Application 2024(E)

Figure 42: South Asia & Pacific Market Share Analysis, by Country, 2024E to 2034F

Figure 43: Western Europe Market Y-o-Y Analysis, by Packaging Type, 2019H to 2034F

Figure 44: Western Europe Market Y-o-Y Analysis, by Order Type, 2019H to 2034F

Figure 45: Western Europe Market Value Share Analysis, by Product Form, 2024(E)

Figure 46: Western Europe Market Value Share Analysis, by Distribution Channel 2024(E)

Figure 47: Western Europe Market Value Share Analysis, by Application 2024(E)

Figure 48: Western Europe Market Share Analysis, by Country, 2024E to 2034F

Figure 49: Eastern Europe Market Y-o-Y Analysis, by Packaging Type, 2019H to 2034F

Figure 50: Eastern Europe Market Y-o-Y Analysis, by Order Type, 2019H to 2034F

Figure 51: Eastern Europe Market Value Share Analysis, by Product Form, 2024(E)

Figure 52: Eastern Europe Market Value Share Analysis, by Distribution Channel 2024(E)

Figure 53: Eastern Europe Market Value Share Analysis, by Application 2024(E)

Figure 54: Eastern Europe Market Share Analysis, by Country, 2024E to 2034F

Figure 55: Middle East & Africa Market Y-o-Y Analysis, by Packaging Type, 2019H to 2034F

Figure 56: Middle East & Africa Market Y-o-Y Analysis, by Order Type, 2019H to 2034F

Figure 57: Middle East & Africa Market Value Share Analysis, by Product Form, 2024(E)

Figure 58: Middle East & Africa Market Value Share Analysis, by Distribution Channel 2024(E)

Figure 59: Middle East & Africa Market Value Share Analysis, by Application 2024(E)

Figure 60: Middle East & Africa Market Share Analysis, by Country, 2024E to 2034F

Recommendations

Packaging

Flexible Packaging Paper Market

Published : March 2024

Packaging

FMCG Packaging Market

Published : May 2023

Packaging

Anti-counterfeit Cosmetic Packaging Market

Published : March 2023

Packaging

Cosmetic Dropper Market

Published : May 2022

Explore Packaging Insights

View Reports

Skincare Packaging Market