The global Skincare Market is estimated to be valued at USD 192.8 billion in 2025 and is projected to reach USD 432.1 billion by 2035, registering a compound annual growth rate of 8.4% over the forecast period.
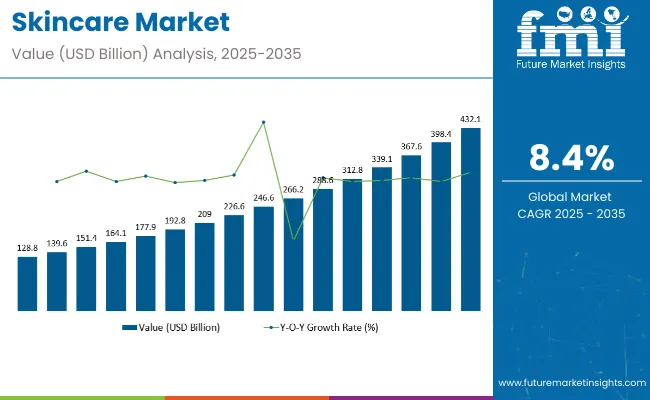
| Attribute | Value |
|---|---|
| Market Size in 2025 | USD 192.8 billion |
| Market Size in 2035 | USD 432.1 billion |
| CAGR (2025 to 2035) | 8.4% |
The skincare market has been witnessing sustained momentum, underpinned by the convergence of dermatological science, digital commerce proliferation, and shifting consumer behavior. Public disclosures by leading skincare companies have indicated that demand has remained resilient even amid macroeconomic fluctuations, driven by heightened health consciousness and preventative self-care routines.
There is a notable uptick in premium and clinically validated formulations, reflecting consumer preference for efficacious solutions addressing concerns such as barrier repair, hyperpigmentation, and aging. Digital engagement and social media-fueled education have played an influential role in shortening product adoption cycles and expanding access to younger demographics.
Rise in male grooming and inclusive product development for diverse skin tones are reshaping product portfolios, innovation in active ingredients, such as peptides and microbiome-focused complexes are expected to create differentiation and command price premiums.
Ingredient safety and toxicology have become central themes in modern skincare, driven by rising consumer demand for transparency, regulatory scrutiny, and a shift toward 'clean' formulations. Many widely used ingredients in traditional skincare are now being questioned due to potential health concerns, environmental impact, or allergenic risks.
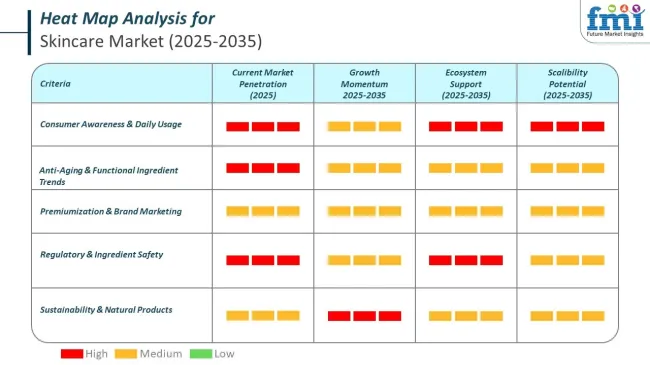
Clean beauty certifications help consumers identify products that are safe, non-toxic, ethically made, and environmentally responsible. These labels act as guides for those who want skincare that avoids harmful chemicals, supports organic sourcing, and promotes animal welfare.
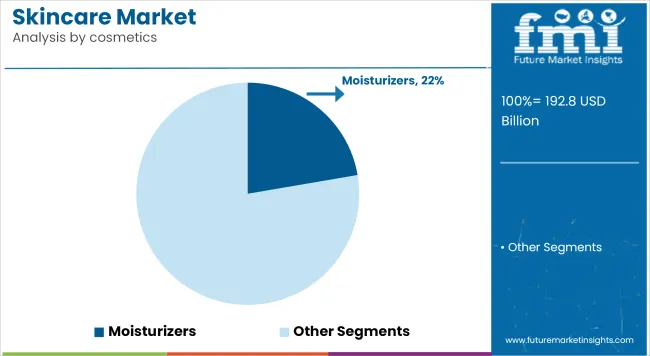
Moisturizers have been observed to dominate the skin care cosmetics category, accounting for a 22% revenue share in the overall market in 2025. Their leadership in the segment has been primarily driven by rising awareness around daily skin hydration and barrier reinforcement. With a growing number of consumers experiencing skin dryness due to environmental aggressors and increasing screen exposure, daily moisturizing routines have become essential.
This behavioral shift has been reinforced by dermatological endorsements that highlight the role of moisturizers in preventing premature aging, irritation, and inflammation. Formulations enriched with ceramides, hyaluronic acid, and glycerin have gained traction, as consumer preference has shifted toward scientifically validated ingredients.
In addition, lifestyle changes and a rise in urban air pollution have necessitated the adoption of skincare regimens centered around hydrating solutions. A surge in product innovations, including lightweight gel moisturizers and SPF-infused variants, has further contributed to this category’s appeal. Retail and digital promotions from key brands have amplified consumer trust, enhancing sales penetration across geographies.
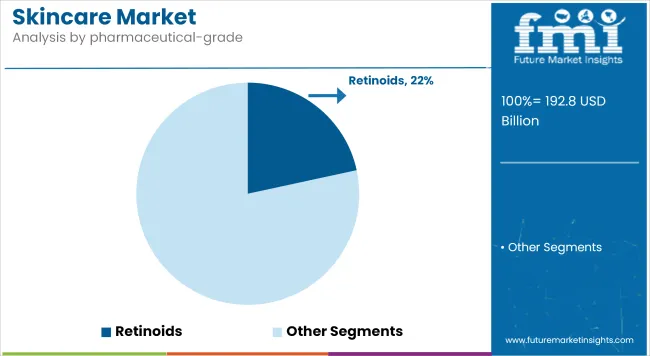
Retinoids within pharmaceutical-grade skin care have been noted to capture a 22% revenue share in the market by 2025, driven by their well-documented efficacy in addressing acne, photoaging, and hyperpigmentation. This segment’s ascent has been reinforced by clinical validation and FDA-approved formulations, which have instilled a sense of trust among dermatologists and end-users alike.
The rise in adult acne cases and premature aging concerns especially among millennials has contributed to an uptick in demand for prescription-strength retinoids like tretinoin and adapalene. Scientific backing has revealed their potential in regulating cell turnover and stimulating collagen production, making them integral to both therapeutic and cosmetic regimens.
Additionally, increased telehealth consultations during and post-COVID have accelerated access to prescription-based skincare solutions, including retinoids. Pharmaceutical companies have responded with enhanced formulation stability and reduced irritation versions, further increasing product adherence.
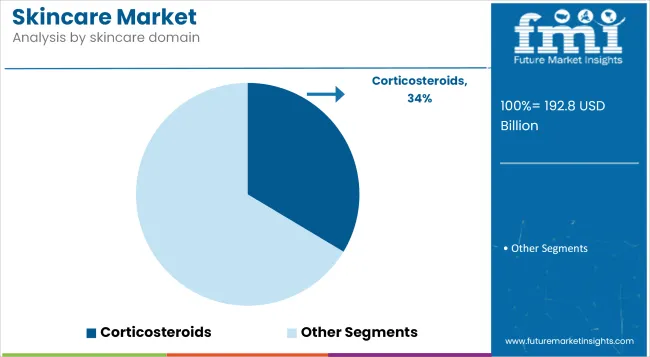
In the prescription (Rx) skincare domain, corticosteroids have been found to dominate with a 33.6% revenue share in 2025. Their leadership position is attributed to their established efficacy in managing a wide spectrum of inflammatory skin conditions, including eczema, psoriasis, and dermatitis.
Chronic dermatological disorders have seen a steady rise globally, compelling dermatologists to rely on corticosteroid-based topical and systemic therapies due to their quick anti-inflammatory and immunosuppressive action. The segment’s growth has been supported by the development of low-potency, non-halogenated corticosteroids that minimize side effects and allow for long-term use, especially in pediatric and geriatric dermatology.
Additionally, government reimbursements and insurance coverage for prescribed corticosteroid treatments have improved accessibility in both developed and developing markets. Increased hospital dermatology visits and growing awareness regarding early treatment interventions have also contributed to sustained demand.
Growing competition in the skincare market owing to the presence of a large number of global and regional players. The diverse range of brands at both the high and low end of the spectrum makes it difficult for newcomers and smaller manufacturers to capture market share.
Or, if you look at the trend of changing consumer preferences and the growing shift of people with their brand loyalties combined with the emergence of direct-to-consumer (DTC) brands, it is almost impossible for a traditional brand to maintain its monopoly. Brands must strive to differentiate themselves via innovation, individualized skincare solutions, and marketing strategies to maintain growth.
And the industry is highly regulated, with strict rules on how ingredients can be used in products, how products are tested for safety and the kinds of claims that can be made about products. Different countries have different regulation systems for the use of chemicals, preservatives, and active ingredients which creates barriers for expansion aspirants companies.
Furthermore, increasing consumer awareness for clean beauty and sustainability is compelling brands to reformulate their products and meet environmental standards and certification requirements.
Huge growth potential is in organic, vegan, and chemical-free beauty products. Plant-based ingredients, cruelty-free formulations, and sustainable packaging are actively sought by consumers. This trend is based on the growing knowledge of the dangers of synthetic chemicals and the interest in conscious companies. The company that is investing in clean beauty innovations and is transparent in the sourcing of ingredients will have a competitive edge.
AI, AR and skin diagnosis tools are the new technologies that are changing the game in the skincare market. AI-enabled skin evaluation, DNA-driven formulation, and customized skin care regimen are taking over the beauty and wellness market. Brands using digital means to provide customized product suggestions and virtual fitting rooms are improving customer experience and increasing sales.
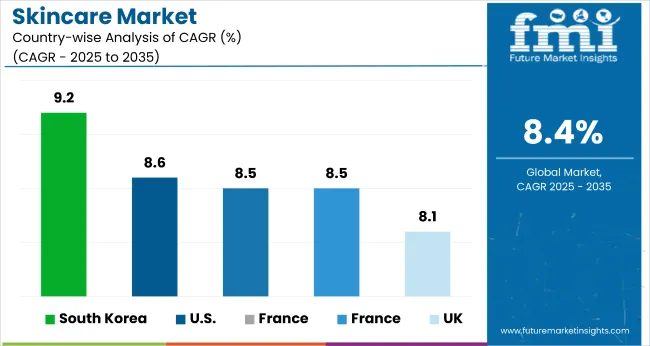
There is a booming market for skincare products in the USA as consumers are increasingly searching for natural, organic, and anti-aging skincare products. (The driving market growth includes a rise in the popularity of clean beauty trends and product development expertise in dermatology and customized skincare solutions. Sales continue to boost out on e-commerce platforms, and DTC brands are here to stay.
And in addition, purchasing behaviors are being influenced by social media, celebrity endorsements and dermatological innovations. Sustainable packaging and cruelty-free formulations are becoming important deciding factors, too.
| Country | CAGR (2025 to 2035) |
|---|---|
| USA | 8.6% |
The Skincare market in UK is experiencing steady growth with rising focusing on skin care and prefer premium skincare brands. In recent times, due to these environmental factors and their effects on skin health, there has been an increased demand for anti-pollution skincare products, especially among the urban populace. Consumers are leaning toward multifunctional products that combine hydration, sun protection and anti-aging benefits in a single formula.
Moreover, government regulations encouraging sustainable beauty practices and prohibiting harmful ingredients in cosmetics aid in the adoption of cleaner formulations. Market growth is also supported by online shopping and subscription-based skin care services.
| Country | CAGR (2025 to 2035) |
|---|---|
| UK | 8.1% |
With a large demand for organic and scientific beauty products, the EU has a fast-growing skincare market. The growth of the market is attributed to the high demand for dermatologist-recommended and clinically tested skincare solutions in the countries like Germany, France, and Italy. European skincare brands with a legacy of innovation ushering in the future of beauty around the globe.
Then again, the EU is known for strict rules on cosmetic ingredients-encouraging safer, more effective formulations. Also, the growth of gender neutral and minimalist skincare routines will help to incorporate even more products across brands. Increasing investments in biotechnology-based skincare are further shaping the market’s future.
| Country | CAGR (2025 to 2035) |
|---|---|
| European Union (EU) | 8.5% |
Japan’s cosmetics market is thriving, fueled by a cultural focus on skincare routines and innovative technology for beauty products. Fermented is also the buzzword here, as we all demand lightweight, hydrating and skin-brightening solutions.
The also had a globally influential approach of simplicity with long-term skin health has inspired the J-beauty. The popularity of AI-powered skincare analysis and personalized beauty recommendations is growing as well. Market expansion is also driven by availability of premium and luxury cosmetic brands and innovations in sustainable packaging.
| Country | CAGR (2025 to 2035) |
|---|---|
| Japan | 8.9% |
South Korea continues to lead the way in the skincare market, with K-beauty creations setting the tone for trends around the world. Continuous innovations in preparations, such as probiotic blended and microbiome friendly skincare drive the market. And the demand for high-performance sunscreens, glass skin routines and hybrid skincare-makeup products is burgeoning.
Social media and beauty influencers shape customers’ preferences, while real-time reviews drive sales. Smart beauty devices and AI-based personalized skincare recommendations are quickly gaining popularity, leading to enhanced personalized skincare. The growth of K-beauty brands in markets across the world also helped drive the sector.
| Country | CAGR (2025 to 2035) |
|---|---|
| South Korea | 9.2% |
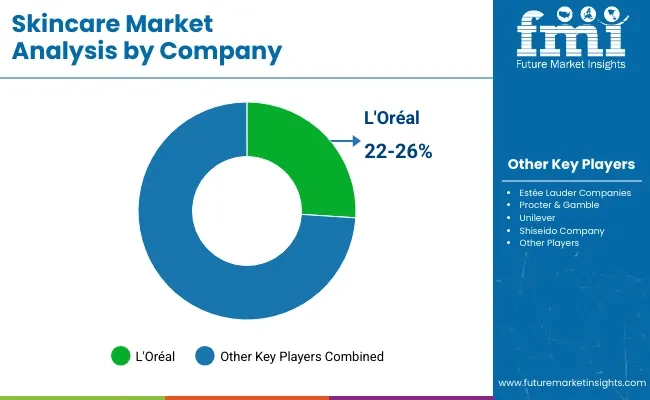
The skincare market is witnessing intensifying competition driven by rapid product innovation, evolving consumer expectations, and digital transformation. Market participants are increasingly focusing on science-backed, dermatologically tested formulations, with a strong pivot toward clean, natural, and sustainable ingredient.
Personalized skincare solutions powered by AI diagnostics and skin mapping tools are being actively adopted to cater to individual needs, boosting brand differentiation. Companies are investing heavily in R&D, e-commerce penetration, and influencer-driven marketing to capture the attention of tech-savvy, health-conscious consumers. Moreover, strategic collaborations with dermatologists, digital skincare platforms, and wellness brands are enhancing product credibility and consumer trust
Key Development
| Report Attributes | Details |
|---|---|
| Current Total Market Size (2025) | USD 192.8 billion |
| Projected Market Size (2035) | USD 432.1 billion |
| CAGR (2025 to 2035) | 8.4% |
| Base Year for Estimation | 2024 |
| Historical Period | 2020 to 2024 |
| Projections Period | 2025 to 2035 |
| Quantitative Units | USD billion for dollar sales |
| Product Types Analyzed (Segment 1) | Skin Cleansers, Hand Sanitizers, Surgical Scrubs, Skin Care Cosmetics, Other |
| Skin Types Analyzed (Segment 2) | Normal, Dry, Oily |
| Forms Analyzed (Segment 3) | Liquid Skincare, Gel and Lotions, Wipes, Spray and Foams |
| End-users Analyzed (Segment 4) | Hospitals, Clinics, Ambulatory Surgical Centers, Diagnostic Laboratories, Reference Laboratories, Rehabilitation Centers, Long Term Care Centers, Critical Care Centers, Pharmaceutical and Biotechnology Companies, Academics and Research Institutes, Homecare Settings |
| Regions Covered | North America, Latin America, East Asia, South Asia & Pacific, Eastern Europe, Western Europe, Middle East & Africa |
| Countries Covered | United States, Canada, Mexico, Brazil, Argentina, Germany, France, United Kingdom, Italy, Spain, Netherlands, China, India, Japan, South Korea, ANZ, GCC Countries, South Africa |
| Key Players influencing the Skincare Market | 3M Company, Cardinal Health, Inc., Ecolab, Gojo Industries, Inc., Beiersdorf AG's NX NIVEA, Whiteley Corporation, Reckitt Benckiser Group PLC, Carroll Clean, Johnson & Johnson Consumer Inc., Galderma Laboratories, L.P. |
| Additional Attributes | dollar sales, CAGR trends, product type distribution, skin type preferences, form-based demand, end-user industry share, competitor dollar sales & market share, regional growth patterns |
The overall market size for skincare market was USD 192.8 billion in 2025.
The skincare market expected to reach USD 432.1 billion in 2035.
Rising consumer awareness, increasing demand for natural ingredients, technological advancements, expanding e-commerce, and growing anti-aging product adoption will drive the skincare market during the forecast period.
The top 5 countries which drives the development of skincare market are USA, UK, Europe Union, Japan and South Korea.
Normal skin products driving market growth to command significant share over the assessment period.


Our Research Products

The "Full Research Suite" delivers actionable market intel, deep dives on markets or technologies, so clients act faster, cut risk, and unlock growth.

The Leaderboard benchmarks and ranks top vendors, classifying them as Established Leaders, Leading Challengers, or Disruptors & Challengers.

Locates where complements amplify value and substitutes erode it, forecasting net impact by horizon

We deliver granular, decision-grade intel: market sizing, 5-year forecasts, pricing, adoption, usage, revenue, and operational KPIs—plus competitor tracking, regulation, and value chains—across 60 countries broadly.

Spot the shifts before they hit your P&L. We track inflection points, adoption curves, pricing moves, and ecosystem plays to show where demand is heading, why it is changing, and what to do next across high-growth markets and disruptive tech

Real-time reads of user behavior. We track shifting priorities, perceptions of today’s and next-gen services, and provider experience, then pace how fast tech moves from trial to adoption, blending buyer, consumer, and channel inputs with social signals (#WhySwitch, #UX).

Partner with our analyst team to build a custom report designed around your business priorities. From analysing market trends to assessing competitors or crafting bespoke datasets, we tailor insights to your needs.
Supplier Intelligence
Discovery & Profiling
Capacity & Footprint
Performance & Risk
Compliance & Governance
Commercial Readiness
Who Supplies Whom
Scorecards & Shortlists
Playbooks & Docs
Category Intelligence
Definition & Scope
Demand & Use Cases
Cost Drivers
Market Structure
Supply Chain Map
Trade & Policy
Operating Norms
Deliverables
Buyer Intelligence
Account Basics
Spend & Scope
Procurement Model
Vendor Requirements
Terms & Policies
Entry Strategy
Pain Points & Triggers
Outputs
Pricing Analysis
Benchmarks
Trends
Should-Cost
Indexation
Landed Cost
Commercial Terms
Deliverables
Brand Analysis
Positioning & Value Prop
Share & Presence
Customer Evidence
Go-to-Market
Digital & Reputation
Compliance & Trust
KPIs & Gaps
Outputs
Full Research Suite comprises of:
Market outlook & trends analysis
Interviews & case studies
Strategic recommendations
Vendor profiles & capabilities analysis
5-year forecasts
8 regions and 60+ country-level data splits
Market segment data splits
12 months of continuous data updates
DELIVERED AS:
PDF EXCEL ONLINE
Skincare Supplement Market Size and Share Forecast Outlook 2025 to 2035
Skincare Oil Market Size and Share Forecast Outlook 2025 to 2035
Skincare Nutritional Serum Market Size and Share Forecast Outlook 2025 to 2035
Skincare Products Market Size and Share Forecast Outlook 2025 to 2035
Skincare Packaging Market Size, Share & Forecast 2025 to 2035
Skincare Industry in India – Trends & Growth Forecast 2024-2034
Global Skincare Treatment Market Analysis – Size, Share & Forecast 2024-2034
Global PDRN Skincare Market Size and Share Forecast Outlook 2025 to 2035
Men’s Skincare Products Market Size, Growth, and Forecast for 2025 to 2035
Global Smart Skincare Market Size and Share Forecast Outlook 2025 to 2035
Cooling Skincare Gels Market Size and Share Forecast Outlook 2025 to 2035
Natural Skincare Preservatives Market Analysis - Size and Share Forecast Outlook 2025 to 2035
Ormedic Skincare Market Demand & Insights 2024-2034
Ceramide Skincare Market Size and Share Forecast Outlook 2025 to 2035
BPA-Free Skincare Market Trends – Demand & Forecast 2024-2034
Camellia Skincare & Cosmetics Market
Buffering Skincare Products Market Analysis - Size and Share Forecast Outlook 2025 to 2035
Menopause Skincare Solutions Market Size and Share Forecast Outlook 2025 to 2035
Probiotic Skincare Ingredients Market Size and Share Forecast Outlook 2025 to 2035
Probiotic Skincare Solutions Market Size and Share Forecast Outlook 2025 to 2035

Thank you!
You will receive an email from our Business Development Manager. Please be sure to check your SPAM/JUNK folder too.
Chat With
MaRIA