Skincare Oil Market Size and Share Forecast Outlook (2024 to 2034)

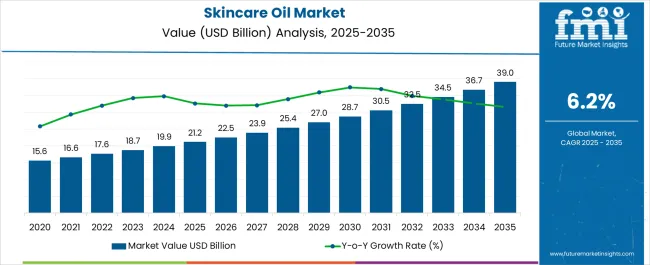
The global skincare oil market is expected to capture a CAGR of 6.3% during the forecast period due to increasing demand for face oil that can soften wrinkles and acne scars. The market value is projected to increase from USD 19.91 billion in 2024 to USD 34.56 billion by 2034. The skincare oil market was valued at USD 18.83 billion at the end of 2023.

Market Outlook:

Data Points Market Insights
Market Value 2023 USD 18.83 billion
Market Value 2024 USD 19.91 billion
Market Value 2034 USD 34.56 billion
CAGR 2024 to 2034 6.3%
Market Share of Top 5 Countries 57.0%
Key Market Players Shiseido; Procter & Gamble Co.; Burberry Group Plc.; Unilever; L’Oréal; Beiersdorf AG; Avon Products; Inc.; Estée Lauder Companies; Amway; Chanel S.A.; Johnson & Johnson; Chatters Canada; Kao Corporation; Henkel; Edgewell Personal Care; Markwins Beauty Products; Mary Kay; Coty and Marchesa.
  • Face oils are made using essential oils and plant oils that are non-comedogenic and won't clog pores or trigger outbreaks.
  • Antioxidants and plant extracts are also included in skincare oils to balance skin tone, retain hydration, and minimize sebum production.
  • The increasing self-concern with the rising socialization is sensitizing the population to focus on skin care problems. A sense of consciousness regarding skin health is developing and hence driving the manufacturers to bring in new products.

Comparison of Skincare Oil Sales from 2019 to 2023 with Market Forecast for 2024 to 2034

The market for skincare oil has grown at a CAGR of 5% from 2019 to 2023, driven by the presence of multiple key players in the market, the rising cases of diabetes, thyroid, and kidney disease, which bring dryness to the skin, and with it and rising aging population. In 2022, the market for skincare oil represented 35.3% of the total global cosmetic oil market of USD 53.6 billion.

The skincare oil industry is getting moisturized due to the growing demand for bio-oils that can prevent acne and reduce inflammation. The increasing attraction toward premium products due to their packaging further gives them an edge-cutting look over others.

Sensitive skin conditions are also a key concern among the population, which fuels the demand for organic and herbal products. The key manufacturers are bringing in new products that contain no to less harmful chemicals or ingredients. Moreover, several manufacturers have started reformulation of the products to make them more authentic for eco-conscious consumers.

For instance, in August 2021, Bio Oil’s skincare oil was reformulated entirely with 100% plant oil extract. Similarly, many other manufacturers are shifting from inorganic to organic ingredients. The increasing availability of resources is making the population concerned regarding the ingredients used; thus, manufacturers are now transparent about the ingredients.

Manufacturers are offering products that can be used by all skin types and come up with solutions for people with seasonal skin allergies. Thus, owing to the factors mentioned above, the global skincare oil market is projected to grow at a rate of 6.3% during the forecast period.

Key Opportunities Driving Growth for Skincare Oil Manufacturers

Consumers are increasingly seeking natural and organic skincare products, including skincare oils, due to concerns about the potential adverse effects of synthetic ingredients. This trend presents an opportunity for companies to offer high-quality and organic skincare oils.

Plant-based skincare oils, such as argan oil, jojoba oil, and rosehip oil, have gained popularity due to their natural properties and potential benefits for the skin. Companies can capitalize on this trend by offering a diverse range of plant-based skincare oils. The advancing skincare care industry and manufacturers developing organic products are presenting growth opportunities for new and established market players.

The rise in environmental changes is also worsening the weather conditions. The sudden changes in the environment due to global warming make the weather extremely cold and extremely hotter than the usual conditions. This range of temperature impacts the skin and makes it dry. Thus, the rise in temperature fluctuation is increasing the demand for skincare oil.

Factors Restricting Demand in the Skincare Oil Industry

The high price of premium and branded products to maintain its standard restrains the market growth. Moreover, the pricey products designed for certain skin types, allergies, and weather may impact the market growth.

The chemicals used in the manufacturing of essential oils can cause specific skin issues and damage the skin. Some chemicals can be phototoxic, which can cause reactions when exposed to sun UV rays. Also, some oils can cause irritation or a burning sensation for sensitive skin types.

Analysis of Top Countries Producing, Marketing, and Distributing Skincare Oil

As per analysis, North America recorded a significant growth in the skincare oil industry, followed by Latin America, during the historical period. However, the market in the United Kingdom and Germany is likely to experience notable growth due to growing awareness of both men and women toward night skincare routine.

Countries CAGR
The United Kingdom 5.5%
Germany 5.9%
China 7.8%
Japan 5.1%
France 3.0%

Demand for Facial Oil is Glowing the Market in the United Kingdom

The United Kingdom held a significant market share globally. The skincare oil market in the United Kingdom recorded a growth of 6.5% in 2022 and is likely to capture a CAGR of 5.5% in 2024.

Concerns about the potential adverse effects of synthetic ingredients drive the growing trend toward natural and clean beauty products in the country. Skincare oils, especially those derived from natural plant sources, are seen as safe and effective alternatives, contributing to market growth.

The influence of social media platforms and digital marketing has had a significant impact on the skincare industry, including skincare oils. Influencers, beauty bloggers, and online skincare communities share information and recommendations about skincare oils, creating awareness and driving demand among their followers.

Antiaging Face Oil Changing the Outlook of the Skincare Oil Market in China

In 2024, the market for skincare oil in China is estimated to register a growth of 7.8%. The country's demand for and sales of beauty oils has been supported by the country's growing young population and rising female engagement in the workforce. Additionally, as customer desire for natural products has increased, so has the understanding of the myriad negative impacts of synthetic items.

Chinese consumers are ready to spend more than their Asian counterparts on organic beauty products, which has greatly benefited the market for skincare oils. Moreover, the popularity of skincare oils is growing in the nation as a result of local manufacturer’s diverse product offerings.

Natural Face Care Cosmetics is Pamparing the Skincare Oil Market in Germany

In 2024, the market for skincare oil in Germany is anticipated to evolve at a CAGR of 5.9%. German consumers are increasingly concerned about the ingredients used in skincare products and are seeking natural and organic alternatives.

Skincare oils, especially those derived from natural plant sources and certified organic, are in high demand due to their perceived purity and effectiveness.

Skincare Oil Industry Analysis by Top Investment Segments

Essential Skincare Oil is Driving Market Growth

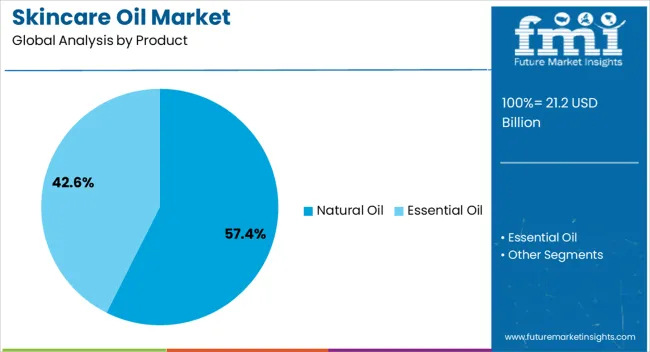
The essential skincare oil dominated the global market with a value share of around 62.0% in 2024 and is anticipated to grow at a rate of 7.3% in the forecast period.

Product Essential Oil
CAGR 7.3%

The cosmetic business relies heavily on essential oils because they not only give products nice smells but also act as preservatives and active ingredients while also providing the skin with several health benefits. Thus, the segment is anticipated to have a command of the market in the forecasted period.

Moisturizing is Widely Preferred in the Skincare Industry

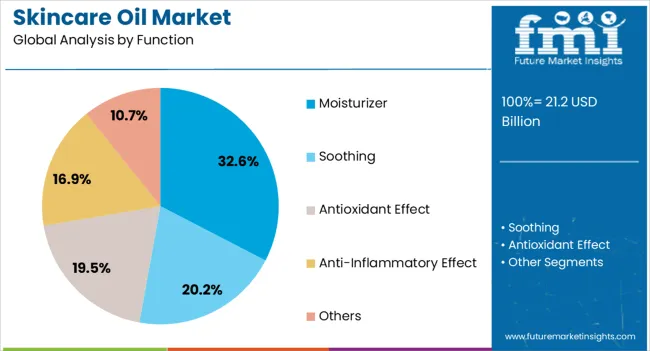
Moisturizing function is highly preferred in the skincare oil market, accounting for 28.9% market share in 2024.

Function Moisturizing
CAGR 8.8%

The skincare oils penetrate deeply into the skin, retaining moisture and avoiding dryness. This results in long-lasting hydration. As a result, it assures that the skin's barrier will keep everything inside and that the water content of the skin won't be lost. Therefore, it is typically preferred to use skincare oils as moisturizers.

Supermarkets & Hypermarkets is Dominating the Distribution Channel Category

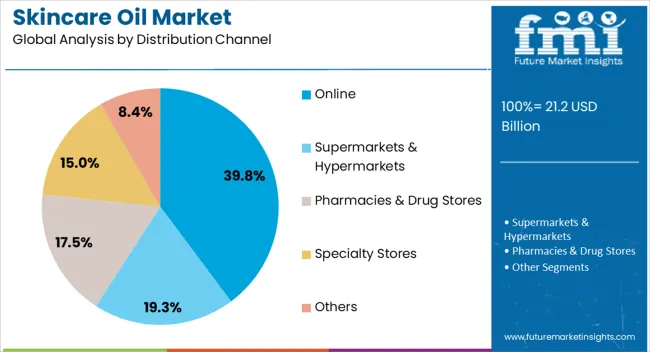
The supermarkets & hypermarkets segment accounted for 37.7% in 2024 globally in terms of value share, and it is predicted to have a hold on the market over the forecast period.

Distribution Channel Supermarkets & Hypermarkets
CAGR 8.0%

Supermarkets and hypermarkets provide customers with an opportunity to select the product they want to have from several available options. They get a chance to check the products, verify their quality, and compare the prices with other brands. Additionally, supermarkets and hypermarkets provide customers with discounts that lower the product's price. Thus, it is the broadly preferred segment by customers.
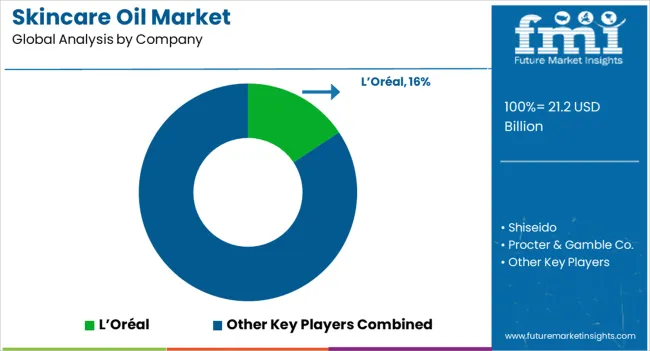
Competitive Landscape of the Skincare Oil Market

To build a position in the industry, the key skincare oil brands are largely focusing on boosting their market share and product supply. Top producers like Shiseido and Blueskys use strategic tactics like collaboration and expansion to increase the supply of skincare oil.

Recent Development

  • In April 2022, Shiseido announced the opening of Ulé, a new mindful luxury skincare brand, in France. Eight products will be available for purchase on the brand's e-commerce site and in a Parisian brand boutique as part of the initial launch on May 2, 2022.
  • In December 2021, BlueSkys Beauty, a science-based, luxury-clean, and plant-powered wellness line, was introduced in the United States. BlueSkys Beauty is a brand extension of BlueSkys Life. The Deep Tissue Moisturizer, Facial Oil Elixir, and Facial Serum are all part of the BlueSkys Beauty skincare line (Queen of Creams).

Scope and Coverage of the Skincare Oil Industry Report

Attribute Details
Forecast Period 2024 to 2034
Historical Data Available for 2019 to 2023
Market Analysis USD billion for Value
Key Regions Covered North America, Latin America, Europe, South Asia, East Asia, Oceania, and Middle East & Africa
Key Countries Covered The United States, Canada, Brazil, Mexico, Argentina, the United Kingdom, Germany, Italy, Russia, Spain, France, BENELUX, India, Thailand, Indonesia, Malaysia, Japan, China, South Korea, Australia, New Zealand, Türkiye, GCC Countries, North Africa and South Africa
Key Market Segments Covered Product, Function, Distribution Channel and Region
Key Companies Profiled Shiseido; Procter & Gamble Co.; Burberry Group Plc.; Unilever; L’Oréal; Beiersdorf AG; Avon Products, Inc.; Estée Lauder Companies; Amway; Chanel S.A.; Johnson & Johnson; Chatters Canada; Kao Corporation; Henkel; Edgewell Personal Care; Markwins Beauty Products; Mary Kay; Coty; Marchesa
Pricing Available upon Request

Top Segments Covered in the Skincare Oil Industry Research

By Product:

  • Essential oil
  • Natural oil

By Function:

  • Moisturizer
  • Soothing
  • Antioxidant effect
  • Anti-inflammatory Effect
  • Others

By Distribution channel:

  • Supermarkets & Hypermarkets
  • Pharmacies & drug stores
  • Specialty Stores
  • Online
  • Others

By Region:

  • North America
  • Latin America
  • Europe
  • South Asia
  • East Asia
  • Oceania
  • The Middle East and Africa (MEA)

Table of Content

  • 1. Executive Summary
  • 2. Market Overview
  • 3. Brand Mapping Analysis
  • 4. Distribution Channel Wise Key Brand Positioning
  • 5. Consumer Buying Behavior Analysis
  • 6. Market Trends & Dynamics
  • 7. Value Added Insights
  • 8. Market Background
  • 9. Global Market Demand Analysis 2019 to 2023 and Forecast, 2024 to 2034
  • 10. Global Market - Pricing Analysis
  • 11. Global Market Demand (in Value or Size in USD Million) Analysis 2019 to 2023 and Forecast, 2024 to 2034
  • 12. Global Market Analysis 2019 to 2023 and Forecast 2024 to 2034, By Product
    • 12.1. Essential Oil
    • 12.2. Natural Oil
  • 13. Global Market Analysis 2019 to 2023 and Forecast 2024 to 2034, By Function
    • 13.1. Moisturizer
    • 13.2. Soothing
    • 13.3. Antioxidant effect
    • 13.4. Anti-inflammatory
    • 13.5. Others
  • 14. Global Market Analysis 2019 to 2023 and Forecast 2024 to 2034, by Distribution Channel
    • 14.1. Supermarkets & Hypermarket
    • 14.2. Pharmacies & Drug Stores
    • 14.3. Specialty Stores
    • 14.4. Online
    • 14.5. Others
  • 15. Global Market Analysis 2019 to 2023 and Forecast 2024 to 2034, by Region
    • 15.1. North America
    • 15.2. Latin America
    • 15.3. Europe
    • 15.4. South Asia
    • 15.5. East Asia
    • 15.6. Oceania
    • 15.7. Middle East & Africa
  • 16. North America Market Analysis 2019 to 2023 and Forecast 2024 to 2034
  • 17. Latin America Market Analysis 2019 to 2023 and Forecast 2024 to 2034
  • 18. Europe Market Analysis 2019 to 2023 and Forecast 2024 to 2034
  • 19. East Asia Market Analysis 2019 to 2023 and Forecast 2024 to 2034
  • 20. South Asia Market Analysis 2019 to 2023 and Forecast 2024 to 2034
  • 21. Oceania Market Analysis 2019 to 2023 and Forecast 2024 to 2034
  • 22. Middle East & Africa Market Analysis 2019 to 2023 and Forecast 2024 to 2034
  • 23. Market Structure Analysis
  • 24. Competition Analysis
    • 24.1. Shiseido
    • 24.2. Procter & Gamble Co.
    • 24.3. Burberry Group Plc.
    • 24.4. Unilever
    • 24.5. L’Oréal
    • 24.6. Biersdorf AG
    • 24.7. Avon Products, Inc.
    • 24.8. Estée Lauder Companies
    • 24.9. Amway
    • 24.10. Chanel S.A.
    • 24.11. Johnson & Johnson
    • 24.12. Chatters Canada
    • 24.13. Kao Corporation
    • 24.14. Henkel
    • 24.15. Edgewell Personal Care
    • 24.16. Markwins Beauty Products
    • 24.17. Mary Kay
    • 24.18. Coty
    • 24.19. Marchesa
  • 25. Assumptions and Acronyms Used
  • 26. Research Methodology

List of Tables

Table 01: Global Market Value (US$ Million) Analysis and Forecast 2019 to 2034, By Product

Table 02: Global Market Volume (Units) Analysis and Forecast 2019 to 2034, By Product

Table 03: Global Market Value (US$ Million) Analysis and Forecast 2019 to 2034, by Function

Table 04: Global Market Value (US$ Million) Analysis and Forecast 2019 to 2034, by Distribution Channel

Table 05: Global Market Value (US$ Million) Analysis and Forecast 2019 to 2034, by Region

Table 06: North America Market Value (US$ Million) Analysis 2012 to 2022 and Forecast 2024 to 2034, by Country

Table 07: North America Market Value (US$ Million) Analysis and Forecast 2019 to 2034, By Product

Table 08: North America Market Volume (Units) Analysis and Forecast 2019 to 2034, By Product

Table 09: North America Market Value (US$ Million) Analysis and Forecast 2019 to 2034, by Function

Table 10: North America Market Value (US$ Million) Analysis and Forecast 2019 to 2034, by Distribution Channel

Table 11: Latin America Market Value (US$ Million) Analysis 2012 to 2022 and Forecast 2024 to 2034, by Country

Table 12: Latin America Market Value (US$ Million) Analysis and Forecast 2019 to 2034, By Product

Table 13: Latin America Market Volume (Units) Analysis and Forecast 2019 to 2034, By Product

Table 14: Latin America Market Value (US$ Million) Analysis and Forecast 2019 to 2034, by Function

Table 15: Latin America Market Value (US$ Million) Analysis and Forecast 2019 to 2034, by Distribution Channel

Table 16: Europe Market Value (US$ Million) Analysis 2012 to 2022 and Forecast 2024 to 2034, by Country

Table 17: Europe Market Value (US$ Million) Analysis and Forecast 2019 to 2034, By Product

Table 18: Europe Market Volume (Units) Analysis and Forecast 2019 to 2034, By Product

Table 19: Europe Market Value (US$ Million) Analysis and Forecast 2019 to 2034, by Function

Table 20: Europe Market Value (US$ Million) Analysis and Forecast 2019 to 2034, by Distribution Channel

Table 21: South Asia Market Value (US$ Million) Analysis 2012 to 2022 and Forecast 2024 to 2034, by Country

Table 22: South Asia Market Value (US$ Million) Analysis and Forecast 2019 to 2034, By Product

Table 23: South Asia Market Volume (Units) Analysis and Forecast 2019 to 2034, By Product

Table 24: South Asia Market Value (US$ Million) Analysis and Forecast 2019 to 2034, by Function

Table 25: South Asia Market Value (US$ Million) Analysis and Forecast 2019 to 2034, by Distribution Channel

Table 26: East Asia Market Value (US$ Million) Analysis 2012 to 2022 and Forecast 2024 to 2034, by Country

Table 27: East Asia Market Value (US$ Million) Analysis and Forecast 2019 to 2034, By Product

Table 28: East Asia Market Volume (Units) Analysis and Forecast 2019 to 2034, By Product

Table 29: East Asia Market Value (US$ Million) Analysis and Forecast 2019 to 2034, by Function

Table 30: East Asia Market Value (US$ Million) Analysis and Forecast 2019 to 2034, by Distribution Channel

Table 31: Oceania Market Value (US$ Million) Analysis 2012 to 2022 and Forecast 2024 to 2034, by Country

Table 32: Oceania Market Value (US$ Million) Analysis and Forecast 2019 to 2034, By Product

Table 33: Oceania Market Volume (Units) Analysis and Forecast 2019 to 2034, By Product

Table 34: Oceania Market Value (US$ Million) Analysis and Forecast 2019 to 2034, by Function

Table 35: Oceania Market Value (US$ Million) Analysis and Forecast 2019 to 2034, by Distribution Channel

Table 36: Middle East & Africa Market Value (US$ Million) Analysis 2012 to 2022 and Forecast 2024 to 2034, by Country

Table 37: Middle East & Africa Market Value (US$ Million) Analysis and Forecast 2019 to 2034, By Product

Table 38: Middle East & Africa Market Volume (Units) Analysis and Forecast 2019 to 2034, By Product

Table 39: Middle East & Africa Market Value (US$ Million) Analysis and Forecast 2019 to 2034, by Function

Table 40: Middle East & Africa Market Value (US$ Million) Analysis and Forecast 2019 to 2034, by Distribution Channel

List of Figures

Figure 01: Global Market Volume (Units), 2019 to 2023

Figure 02: Global Market Volume (Units) & Y-o-Y Growth (%) Analysis, 2024 to 2034

Figure 03: Skincare Oil, Pricing Analysis per unit bottle (US$), in 2023

Figure 04: Skincare Oil, Pricing Forecast per unit bottle (US$), in 2034

Figure 05: Global Market Value (US$ Million) Analysis, 2019 to 2023

Figure 06: Global Market Forecast & Y-o-Y Growth, 2024 to 2034

Figure 07: Global Market Absolute $ Opportunity (US$ Million) Analysis, 2024 to 2034

Figure 08: Global Market Value Share (%) Analysis 2023 and 2034, By Product

Figure 09: Global Market Y-o-Y Growth (%) Analysis 2024 to 2034, By Product

Figure 10: Global Market Attractiveness Analysis 2024 to 2034, By Product

Figure 11: Global Market Value Share (%) Analysis 2023 and 2034, by Function

Figure 12: Global Market Y-o-Y Growth (%) Analysis 2024 to 2034, by Function

Figure 13: Global Market Attractiveness Analysis 2024 to 2034, by Function

Figure 14: Global Market Value Share (%) Analysis 2023 and 2034, by Distribution Channel

Figure 15: Global Market Y-o-Y Growth (%) Analysis 2024 to 2034, by Distribution Channel

Figure 16: Global Market Attractiveness Analysis 2024 to 2034, by Distribution Channel

Figure 17: Global Market Value Share (%) Analysis 2023 and 2034, by Region

Figure 18: Global Market Y-o-Y Growth (%) Analysis 2024 to 2034, by Region

Figure 19: Global Market Attractiveness Analysis 2024 to 2034, by Region

Figure 20: North America Market Value (US$ Million) Analysis, 2019 to 2023

Figure 21: North America Market Value (US$ Million) Forecast, 2024 to 2034

Figure 22: North America Market Value Share, By Product (2023 E)

Figure 23: North America Market Value Share, by Function (2023 E)

Figure 24: North America Market Value Share, by Distribution Channel (2023 E)

Figure 25: North America Market Value Share, by Country (2023 E)

Figure 26: North America Market Attractiveness Analysis By Product, 2024 to 2034

Figure 27: North America Market Attractiveness Analysis by Function, 2024 to 2034

Figure 28: North America Market Attractiveness Analysis by Distribution Channel, 2024 to 2034

Figure 29: North America Market Attractiveness Analysis by Country, 2024 to 2034

Figure 30: U.S. Market Value Proportion Analysis, 2023

Figure 31: Global Vs. U.S. Growth Comparison

Figure 32: U.S. Market Share Analysis (%) By Product, 2023 & 2034

Figure 33: U.S. Market Share Analysis (%) by Function, 2023 & 2034

Figure 34: U.S. Market Share Analysis (%) by Distribution Channel, 2023 & 2034

Figure 35: Canada Market Value Proportion Analysis, 2023

Figure 36: Global Vs. Canada. Growth Comparison

Figure 37: Canada Market Share Analysis (%) By Product, 2023 & 2034

Figure 38: Canada Market Share Analysis (%) by Function, 2023 & 2034

Figure 39: Canada Market Share Analysis (%) by Distribution Channel, 2023 & 2034

Figure 40: Latin America Market Value (US$ Million) Analysis, 2019 to 2023

Figure 41: Latin America Market Value (US$ Million) Forecast, 2024 to 2034

Figure 42: Latin America Market Value Share, By Product (2023 E)

Figure 43: Latin America Market Value Share, by Function (2023 E)

Figure 44: Latin America Market Value Share, by Distribution Channel (2023 E)

Figure 45: Latin America Market Value Share, by Country (2023 E)

Figure 46: Latin America Market Attractiveness Analysis By Product, 2024 to 2034

Figure 47: Latin America Market Attractiveness Analysis by Function, 2024 to 2034

Figure 48: Latin America Market Attractiveness Analysis by Distribution Channel, 2024 to 2034

Figure 49: Latin America Market Attractiveness Analysis by Country, 2024 to 2034

Figure 50: Mexico Market Value Proportion Analysis, 2023

Figure 51: Global Vs Mexico Growth Comparison

Figure 52: Mexico Market Share Analysis (%) By Product, 2023 & 2034

Figure 53: Mexico Market Share Analysis (%) by Function, 2023 & 2034

Figure 54: Mexico Market Share Analysis (%) by Distribution Channel, 2023 & 2034

Figure 55: Brazil Market Value Proportion Analysis, 2023

Figure 56: Global Vs. Brazil. Growth Comparison

Figure 57: Brazil Market Share Analysis (%) By Product, 2023 & 2034

Figure 58: Brazil Market Share Analysis (%) by Function, 2023 & 2034

Figure 59: Brazil Market Share Analysis (%) by Distribution Channel, 2023 & 2034

Figure 60: Argentina Market Value Proportion Analysis, 2023

Figure 61: Global Vs Argentina Growth Comparison

Figure 62: Argentina Market Share Analysis (%) By Product, 2023 & 2034

Figure 63: Argentina Market Share Analysis (%) by Function, 2023 & 2034

Figure 64: Argentina Market Share Analysis (%) by Distribution Channel, 2023 & 2034

Figure 65: Europe Market Value (US$ Million) Analysis, 2019 to 2023

Figure 66: Europe Market Value (US$ Million) Forecast, 2024 to 2034

Figure 67: Europe Market Value Share, By Product (2023 E)

Figure 68: Europe Market Value Share, by Function (2023 E)

Figure 69: Europe Market Value Share, by Distribution Channel (2023 E)

Figure 70: Europe Market Value Share, by Country (2023 E)

Figure 71: Europe Market Attractiveness Analysis By Product, 2024 to 2034

Figure 72: Europe Market Attractiveness Analysis by Function, 2024 to 2034

Figure 73: Europe Market Attractiveness Analysis by Distribution Channel, 2024 to 2034

Figure 74: Europe Market Attractiveness Analysis by Country, 2024 to 2034

Figure 75: UK Market Value Proportion Analysis, 2023

Figure 76: Global Vs. UK Growth Comparison

Figure 77: UK Market Share Analysis (%) By Product, 2023 & 2034

Figure 78: UK Market Share Analysis (%) by Function, 2023 & 2034

Figure 79: UK Market Share Analysis (%) by Distribution Channel, 2023 & 2034

Figure 80: Germany Market Value Proportion Analysis, 2023

Figure 81: Global Vs. Germany Growth Comparison

Figure 82: Germany Market Share Analysis (%) By Product, 2023 & 2034

Figure 83: Germany Market Share Analysis (%) by Function, 2023 & 2034

Figure 84: Germany Market Share Analysis (%) by Distribution Channel, 2023 & 2034

Figure 85: Italy Market Value Proportion Analysis, 2023

Figure 86: Global Vs. Italy Growth Comparison

Figure 87: Italy Market Share Analysis (%) By Product, 2023 & 2034

Figure 88: Italy Market Share Analysis (%) by Function, 2023 & 2034

Figure 89: Italy Market Share Analysis (%) by Distribution Channel, 2023 & 2034

Figure 90: France Market Value Proportion Analysis, 2023

Figure 91: Global Vs France Growth Comparison

Figure 92: France Market Share Analysis (%) By Product, 2023 & 2034

Figure 93: France Market Share Analysis (%) by Function, 2023 & 2034

Figure 94: France Market Share Analysis (%) by Distribution Channel, 2023 & 2034

Figure 95: Spain Market Value Proportion Analysis, 2023

Figure 96: Global Vs Spain Growth Comparison

Figure 97: Spain Market Share Analysis (%) By Product, 2023 & 2034

Figure 98: Spain Market Share Analysis (%) by Function, 2023 & 2034

Figure 99: Spain Market Share Analysis (%) by Distribution Channel, 2023 & 2034

Figure 100: Russia Market Value Proportion Analysis, 2023

Figure 101: Global Vs Russia Growth Comparison

Figure 102: Russia Market Share Analysis (%) By Product, 2023 & 2034

Figure 103: Russia Market Share Analysis (%) by Function, 2023 & 2034

Figure 104: Russia Market Share Analysis (%) by Distribution Channel, 2023 & 2034

Figure 105: BENELUX Market Value Proportion Analysis, 2023

Figure 106: Global Vs BENELUX Growth Comparison

Figure 107: BENELUX Market Share Analysis (%) By Product, 2023 & 2034

Figure 108: BENELUX Market Share Analysis (%) by Function, 2023 & 2034

Figure 109: BENELUX Market Share Analysis (%) by Distribution Channel, 2023 & 2034

Figure 110: East Asia Market Value (US$ Million) Analysis, 2019 to 2023

Figure 111: East Asia Market Value (US$ Million) Forecast, 2024 to 2034

Figure 112: East Asia Market Value Share, By Product (2023 E)

Figure 113: East Asia Market Value Share, by Function (2023 E)

Figure 114: East Asia Market Value Share, by Distribution Channel (2023 E)

Figure 115: East Asia Market Value Share, by Country (2023 E)

Figure 116: East Asia Market Attractiveness Analysis By Product, 2024 to 2034

Figure 117: East Asia Market Attractiveness Analysis by Function, 2024 to 2034

Figure 118: East Asia Market Attractiveness Analysis by Distribution Channel, 2024 to 2034

Figure 119: East Asia Market Attractiveness Analysis by Country, 2024 to 2034

Figure 120: China Market Value Proportion Analysis, 2023

Figure 121: Global Vs. China Growth Comparison

Figure 122: China Market Share Analysis (%) By Product, 2023 & 2034

Figure 123: China Market Share Analysis (%) by Function, 2023 & 2034

Figure 124: China Market Share Analysis (%) by Distribution Channel, 2023 & 2034

Figure 125: Japan Market Value Proportion Analysis, 2023

Figure 126: Global Vs. Japan Growth Comparison

Figure 127: Japan Market Share Analysis (%) By Product, 2023 & 2034

Figure 128: Japan Market Share Analysis (%) by Function, 2023 & 2034

Figure 129: Japan Market Share Analysis (%) by Distribution Channel, 2023 & 2034

Figure 130: South Korea Market Value Proportion Analysis, 2023

Figure 131: Global Vs South Korea Growth Comparison

Figure 132: South Korea Market Share Analysis (%) By Product, 2023 & 2034

Figure 133: South Korea Market Share Analysis (%) by Function, 2023 & 2034

Figure 134: South Korea Market Share Analysis (%) by Distribution Channel, 2023 & 2034

Figure 135: South Asia Market Value (US$ Million) Analysis, 2019 to 2023

Figure 136: South Asia Market Value (US$ Million) Forecast, 2024 to 2034

Figure 137: South Asia Market Value Share, By Product (2023 E)

Figure 138: South Asia Market Value Share, by Function (2023 E)

Figure 139: South Asia Market Value Share, by Distribution Channel (2023 E)

Figure 140: South Asia Market Value Share, by Country (2023 E)

Figure 141: South Asia Market Attractiveness Analysis By Product, 2024 to 2034

Figure 142: South Asia Market Attractiveness Analysis by Function, 2024 to 2034

Figure 143: South Asia Market Attractiveness Analysis by Distribution Channel, 2024 to 2034

Figure 144: South Asia Market Attractiveness Analysis by Country, 2024 to 2034

Figure 145: India Market Value Proportion Analysis, 2023

Figure 146: Global Vs. India Growth Comparison

Figure 147: India Market Share Analysis (%) By Product, 2023 & 2034

Figure 148: India Market Share Analysis (%) by Function, 2023 & 2034

Figure 149: India Market Share Analysis (%) by Distribution Channel, 2023 & 2034

Figure 150: Indonesia Market Value Proportion Analysis, 2023

Figure 151: Global Vs. Indonesia Growth Comparison

Figure 152: Indonesia Market Share Analysis (%) By Product, 2023 & 2034

Figure 153: Indonesia Market Share Analysis (%) by Function, 2023 & 2034

Figure 154: Indonesia Market Share Analysis (%) by Distribution Channel, 2023 & 2034

Figure 155: Malaysia Market Value Proportion Analysis, 2023

Figure 156: Global Vs. Malaysia Growth Comparison

Figure 157: Malaysia Market Share Analysis (%) By Product, 2023 & 2034

Figure 158: Malaysia Market Share Analysis (%) by Function, 2023 & 2034

Figure 159: Malaysia Market Share Analysis (%) by Distribution Channel, 2023 & 2034

Figure 160: Thailand Market Value Proportion Analysis, 2023

Figure 161: Global Vs. Thailand Growth Comparison

Figure 162: Thailand Market Share Analysis (%) By Product, 2023 & 2034

Figure 163: Thailand Market Share Analysis (%) by Function, 2023 & 2034

Figure 164: Thailand Market Share Analysis (%) by Distribution Channel, 2023 & 2034

Figure 165: Oceania Market Value (US$ Million) Analysis, 2019 to 2023

Figure 166: Oceania Market Value (US$ Million) Forecast, 2024 to 2034

Figure 167: Oceania Market Value Share, By Product (2023 E)

Figure 168: Oceania Market Value Share, by Function (2023 E)

Figure 169: Oceania Market Value Share, by Distribution Channel (2023 E)

Figure 170: Oceania Market Value Share, by Country (2023 E)

Figure 171: Oceania Market Attractiveness Analysis By Product, 2024 to 2034

Figure 172: Oceania Market Attractiveness Analysis by Function, 2024 to 2034

Figure 173: Oceania Market Attractiveness Analysis by Distribution Channel, 2024 to 2034

Figure 174: Oceania Market Attractiveness Analysis by Country, 2024 to 2034

Figure 175: Australia Market Value Proportion Analysis, 2023

Figure 176: Global Vs. Australia Growth Comparison

Figure 177: Australia Market Share Analysis (%) By Product, 2023 & 2034

Figure 178: Australia Market Share Analysis (%) by Function, 2023 & 2034

Figure 179: Australia Market Share Analysis (%) by Distribution Channel, 2023 & 2034

Figure 180: New Zealand Market Value Proportion Analysis, 2023

Figure 181: Global Vs New Zealand Growth Comparison

Figure 182: New Zealand Market Share Analysis (%) By Product, 2023 & 2034

Figure 183: New Zealand Market Share Analysis (%) by Function, 2023 & 2034

Figure 184: New Zealand Market Share Analysis (%) by Distribution Channel, 2023 & 2034

Figure 185: Middle East & Africa Market Value (US$ Million) Analysis, 2019 to 2023

Figure 186: Middle East & Africa Market Value (US$ Million) Forecast, 2024 to 2034

Figure 187: Middle East & Africa Market Value Share, By Product (2023 E)

Figure 188: Middle East & Africa Market Value Share, by Function (2023 E)

Figure 189: Middle East & Africa Market Value Share, by Distribution Channel (2023 E)

Figure 190: Middle East & Africa Market Value Share, by Country (2023 E)

Figure 191: Middle East & Africa Market Attractiveness Analysis By Product, 2024 to 2034

Figure 192: Middle East & Africa Market Attractiveness Analysis by Function, 2024 to 2034

Figure 193: Middle East & Africa Market Attractiveness Analysis by Distribution Channel, 2024 to 2034

Figure 194: Middle East & Africa Market Attractiveness Analysis by Country, 2024 to 2034

Figure 195: GCC Countries Market Value Proportion Analysis, 2023

Figure 196: Global Vs GCC Countries Growth Comparison

Figure 197: GCC Countries Market Share Analysis (%) By Product, 2023 & 2034

Figure 198: GCC Countries Market Share Analysis (%) by Function, 2023 & 2034

Figure 199: GCC Countries Market Share Analysis (%) by Distribution Channel, 2023 & 2034

Figure 200: Türkiye Market Value Proportion Analysis, 2023

Figure 201: Global Vs. Türkiye Growth Comparison

Figure 202: Türkiye Market Share Analysis (%) By Product, 2023 & 2034

Figure 203: Türkiye Market Share Analysis (%) by Function, 2023 & 2034

Figure 204: Türkiye Market Share Analysis (%) by Distribution Channel, 2023 & 2034

Figure 205: South Africa Market Value Proportion Analysis, 2023

Figure 206: Global Vs. South Africa Growth Comparison

Figure 207: South Africa Market Share Analysis (%) By Product, 2023 & 2034

Figure 208: South Africa Market Share Analysis (%) by Function, 2023 & 2034

Figure 209: South Africa Market Share Analysis (%) by Distribution Channel, 2023 & 2034

Figure 210: North Africa Market Value Proportion Analysis, 2023

Figure 211: Global Vs North Africa Growth Comparison

Figure 212: North Africa Market Share Analysis (%) By Product, 2023 & 2034

Figure 213: North Africa Market Share Analysis (%) by Function, 2023 & 2034

Figure 214: North Africa Market Share Analysis (%) by Distribution Channel, 2023 & 2034

Frequently Asked Questions

How Much is the Skincare Oil Market Worth in 2024?

The global skincare oil market is set to be worth USD 19.91 billion in 2024.

What is the Sales Forecast for the Skincare Oil Market Through 2034?

The skincare oil market is expected to register a 6.3% CAGR during the forecast period.

What are the Key Trends Shaping the Skincare Oil Industry?

Marketing the products as premium products and the shift toward organic ingredients.

Which are the Top Three Countries Driving Demand for Skincare Oil?

The United Kingdom, China, and Germany are expected to drive the skincare oil industry.

What is the Market Outlook for Skincare Oil in the United Kingdom?

The United Kingdom is likely to account for 5.5% of the global market in 2024.

At What Percentage is the Demand for Skincare Oil Expected to Register Growth in Europe?

Demand for skincare oil in Europe is expected to register a growth of 6.2% over the next ten years.

Which Countries Are Driving the Market Growth of Skincare Oil?

The United States, India, and China are the key producers of the skincare oil market.

Who are the Key Players in the Skincare Oil Market Sphere?

Burberry Group Plc., Unilever, L’Oréal, Beiersdorf AG, Shiseido, and Avon Products, Inc. are the key players in the skincare oil market.

Explore Similar Insights

Future Market Insights

Skincare Oil Market