Global Smart Skincare Market Size and Share Forecast Outlook 2025 to 2035

The Global Smart Skincare Market is expected to record a valuation of USD 23.8 billion in 2025 and USD 101.5 billion in 2035, with an increase of USD 77.7 billion over the decade. The overall expansion represents a CAGR of 15.6% and a 4.3X increase in market size.
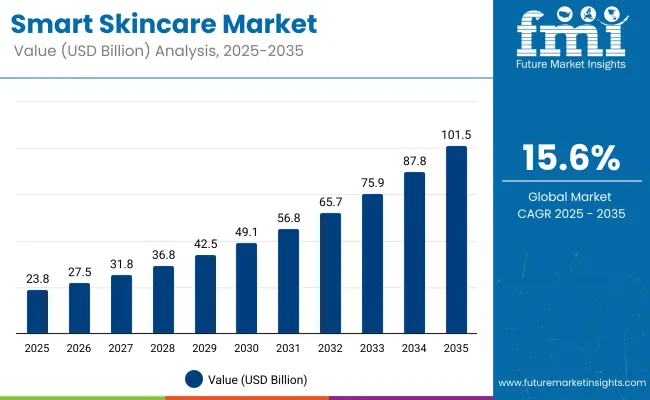
Quick Stats for Global Smart Skincare Market

  • Global Smart Skincare Market Value (2025): USD 23.8 billion
  • Global Smart Skincare Market Forecast Value (2035): USD 101.5 billion
  • Global Smart Skincare Market Forecast CAGR: 15.6%
  • Leading Segment in Global Smart Skincare Market in 2025: Smart Facial Cleansing Devices (36.9%)
  • Key Growth Regions in the Global Smart Skincare Market: North America, Asia-Pacific, Europe
  • Top Key Players in Global Smart Skincare Market: L'Oréal, FOREO, Neutrogena, Shiseido, Procter & Gamble, LG Electronics, Panasonic, Revieve, HiMirror, La Roche-Posay, Lululab, Skin Inc, Opte, Perfect Corp, MiLi

Smart Skincare Market

Global Smart Skincare Market Key Takeaways

Metric Value
Market Estimated Value in (2025E) USD 23.8 billion
Market Forecast Value in (2035F) USD 101.5 billion
Forecast CAGR (2025 to 2035) 15.6%

During the first five-year period from 2025 to 2030, the market increases from USD 23.8 billion to USD 49.1 billion, adding USD 25.3 billion, which accounts for 32.6% of the total decade growth. This phase records steady adoption in at-home facial care tools, connected cleansing brushes, and app-enabled diagnostics, driven by the need for convenience, personalization, and anti-aging solutions. Smart facial cleansing devices dominate this period as they cater to over 36.9% of consumer use-cases requiring real-time feedback and visible skincare benefits.

The second half from 2030 to 2035 contributes USD 52.4 billion, equal to 67.4% of total growth, as the market jumps from USD 49.1 billion to USD 101.5 billion. This acceleration is powered by widespread deployment of IoT-integrated skincare routines, wearable skin monitoring patches, and subscription-based personalization models. AI-driven analytics and cloud-connected diagnostics add recurring revenue, increasing the software and services share beyond device-led value creation.

From 2020 to 2024, the Global Smart Skincare Market grew significantly, driven by device-centric adoption. During this period, the competitive landscape was dominated by consumer device manufacturers controlling nearly 70-75% of revenue, with leaders such as FOREO, Neutrogena, and L'Oréal focusing on AI-enhanced cleansing and diagnostic solutions for the home skincare segment.

Competitive differentiation relied on real-time sensing, customization algorithms, and app integration, while software was commonly offered as a value-added companion tool rather than a standalone revenue generator. Service-based personalization models had minimal traction, contributing less than 10% of total market value. Demand for smart skincare will expand to USD 23.8 billion in 2025, and the revenue mix will shift as software and service-based models grow to over 30% share.

Traditional device leaders face rising competition from digital-first brands offering AI-based skin evaluations, cloud-integrated skincare planning, and precision ingredient dispensing. Major device vendors are pivoting toward hybrid ecosystems that integrate skin analysis, live consultation interfaces, and smart home synchronization. Emerging entrants specializing in app-driven personalization, virtual skin coaches, and AR/VR-assisted regimens are gaining share. The competitive advantage is shifting from device innovation alone to the strength of personalization engines, subscription value, and end-to-end digital engagement platforms.

Why the Global Smart Skincare Market is Growing ?

Advancements in skincare device technology have significantly improved the precision and personalization of home-based beauty routines, enabling real-time skin analysis and targeted product application. Smart facial cleansing devices have gained traction due to their affordability, convenience, and ability to deliver consistent cleansing, exfoliation, and stimulation tailored to individual skin types. The rise of AI-powered diagnostic systems has enhanced the accuracy of skin condition detection, supporting more informed skincare decisions. The growing integration of IoT and sensor-based systemssuch as hydration trackers, UV monitors, and pH analyzershas enabled continuous, app-synced skin health monitoring.

This has expanded the relevance of smart skincare across diverse consumer groups, including those concerned with aging, acne, sensitivity, and hyperpigmentation. The increasing availability of mobile-connected tools and cloud-based platforms is also fueling demand for personalized routines, remote skincare consultations, and automated formulation dispensers. Segment growth is expected to be led by AI and IoT-based technologies, smart cleansing tools in the product type category, and diagnostic software platforms due to their scalability, user engagement capabilities, and interoperability with broader digital wellness ecosystems.

Segment analysis

The market is segmented by product type, technology, application, distribution channel, consumer demographics, end user, and region. Product types include smart facial cleansing devices, smart LED therapy masks, AI-powered skin analyzers, smart mirrors with skin diagnostics, connected skincare dispensers, wearable skincare monitors, smart exfoliators and massagers, app-based skin analysis tools, and customized skincare capsules or dispensers. Technology segmentation includes AI and machine learning technologies, IoT and sensor-based systems, AR/VR and imaging technologies, and cloud and data analytics platforms.

Application areas cover anti-aging and wrinkle reduction, acne and blemish treatment, daily cleansing and maintenance, hydration and moisture monitoring, brightening and skin tone correction, UV monitoring and sun damage prevention, texture, pores and elasticity care, and sensitivity and skin reaction assessment. Distribution channels are categorized into online retailincluding e-commerce platforms and brand websitesand offline retail, which includes specialty beauty stores, pharmacies and drugstores, department stores, and dermatology clinics and aesthetic spas.
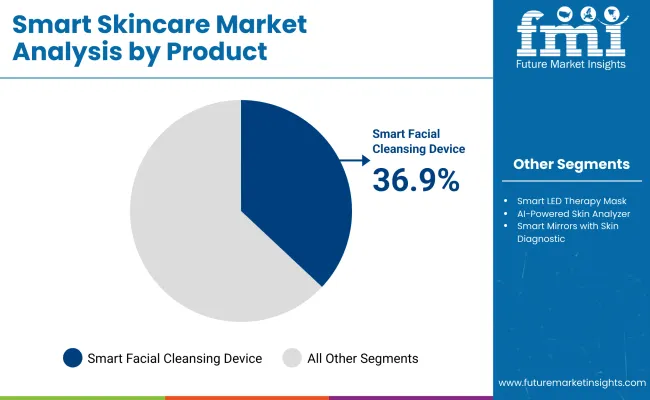
Insights into the Product Segment with Smart Facial Cleansing Devices Leading in Market Share

Smart Skincare Market By Product

Product Segment Market Value Share, 2025
Smart Facial Cleansing Devices 36.9%
Others 63.1%

The Smart Facial Cleansing Devices segment is projected to contribute 36.9% of the Smart Skincare Market revenue in 2025, maintaining its position as the dominant product category. This leadership is driven by increasing consumer preference for app-connected cleansing tools that offer real-time feedback, enhanced hygiene, and tailored routines for different skin types. These devices appeal to a wide demographic due to their affordability, portability, and proven results in daily cleansing and exfoliation. Continuous upgrades in vibration technology, silicone brush design, and app-based performance tracking are enhancing user engagement and satisfaction.

As the demand for personalized skincare regimens grows, smart cleansing devices are increasingly bundled with diagnostic features and integrated with AI platforms. The segment’s expansion is further supported by DTC channel penetration and influencer-driven brand engagement. Smart facial cleansing devices are expected to remain the cornerstone of product-based revenue in the smart skincare ecosystem through 2035.
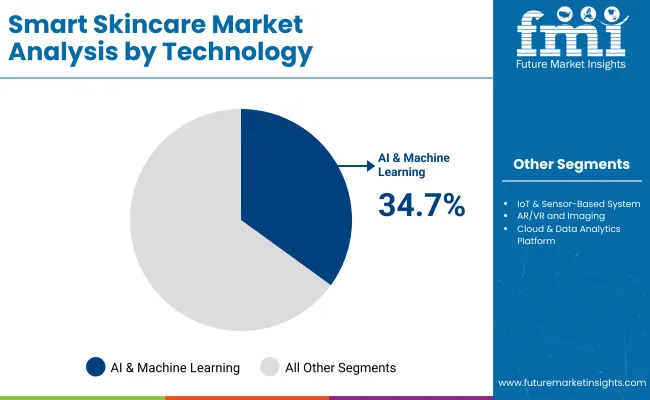
Insights into the Technology Segment with AI & Machine Learning Leading in Market Share

Smart Skincare Market By Technology

Technology Segment Market Value Share, 2025
AI & Machine Learning Technologies 34.7%
Others 65.3%

The AI & Machine Learning Technologiessegment is projected to contribute 34.7% of the global smart skincare market revenue in 2025, establishing itself as the leading technology category. This dominance is driven by the rapid adoption of AI-enabled skin analyzers, personalized diagnostics, and algorithm-driven product recommendations. AI technologies empower brands to offer data-backed skincare solutions tailored to an individual’s skin type, condition, and external environment.

These platforms are widely integrated into apps, smart mirrors, and virtual consultationsenhancing user trust and engagement. The segment’s growth is further accelerated by improvements in computer vision, real-time feedback loops, and continuous learning models. As AI integration becomes essential for competitive personalization, this technology is expected to remain the innovation hub of the smart skincare ecosystem.

Insights into the Application Segment with Daily Cleansing & Maintenance Leading in Market Share

Application Segment Market Value Share, 2025
Daily Cleansing & Maintenance 26.3%
Others 73.7%

The Daily Cleansing & Maintenance segment is projected to account for 26.3% of the global smart skincare market value in 2025, marking it as the top application area. This is primarily driven by the consistent, high-frequency use of smart facial cleansing devices and routines designed for everyday skin hygiene. Consumers prioritize cleansing as the foundation of skincare, and smart tools that enhance this step with real-time feedback, sensor-based adjustments, and customizable regimens have witnessed high adoption rates.

Daily maintenance routines benefit from mass appeal, especially across younger demographics and first-time tech beauty users. As smart cleansing solutions become more accessible via e-commerce and influencer-backed brands, this segment is expected to maintain its leadership in usage frequency and revenue contribution.

What are the Drivers, Restraints, and Key Trends of the Global Smart Skincare Market?

Drivers

Integration of AI & Machine Learning in Device Ecosystems

With AI & Machine Learning capturing 34.7% of the technology segment share in 2025, the market is moving away from static, one-size-fits-all device functionalities toward adaptive skincare systems. These solutions use real-time data from embedded sensors to analyze hydration, oil levels, and pigmentation changes, then refine skincare routines automatically.

The predictive capability of these algorithms such as identifying early signs of wrinkles or UV damage fosters recurring revenue streams via subscription upgrades, cloud storage for skin health history, and AI-powered consultations. This is particularly influential in markets like the USA and Japan, where mature consumers seek measurable and trackable skincare outcomes.

Rise of Premiumization in Daily Cleansing & Maintenance Segment

Holding 26.3% market share in 2025, the Daily Cleansing & Maintenance category is shifting from basic electronic cleansing brushes to multi-functional, sensor-equipped devices. These premium tools offer real-time feedback on skin conditions while delivering visible improvements, catering to consumers’ desire for both convenience and efficacy.

High-end devices with IoT connectivity enable sync with skincare apps, personalized product recommendations, and integration into wider beauty ecosystems. This “premium performance” positioning justifies higher price points and drives repeat purchases, especially in Asia-Pacific where aspirational beauty spending is rising alongside CAGR growth in India (13.6%) and China (10.2%).

Restraints

Device-Sensor Calibration Challenges in Diverse Climates

Emerging high-growth markets such as India and China present unique climatic and environmental conditions humidity swings, heat variations, and high particulate pollution that can reduce the accuracy of optical and bio-impedance sensors in smart skincare devices. Miscalibrated sensors may misinterpret hydration levels or skin barrier conditions, leading to inaccurate recommendations and potential consumer distrust. Brands face increased R&D costs for region-specific calibration and testing, which can slow product rollouts in these lucrative but technically challenging markets.

High Replacement Costs for Hybrid Device-Software Models

As market leaders pivot toward subscription-linked devices and cloud-based personalization services, consumers often face steep replacement costs when hardware becomes obsolete or incompatible with newer software updates. In emerging markets, where affordability remains a key factor, these high upgrade costs can curb adoption rates despite the overall market CAGR of 15.6%. Without modular, upgradable designs, brands risk losing price-sensitive consumers to lower-cost, semi-smart alternatives that sacrifice sophistication for affordability.

Key Trends

Shift from Device-Led to Software-First Revenue Models

The initial market surge was driven by hardware sales, particularly cleansing devices, but the revenue balance is tilting toward software-driven personalization projected to exceed 30% of market value share by 2035. Brands are leveraging AI-skin analysis apps, AR/VR try-on tools, and cloud-linked skin progress tracking to lock users into long-term ecosystems. This transition aligns with recurring revenue models and strengthens brand-consumer engagement, reducing churn compared to one-time device sales.

Localized Skin Diagnostics for Market Penetration in Asia-Pacific

In high-growth regions such as India and China, brands are building localized AI skin models that factor in melanin levels, common regional skin concerns (e.g., pigmentation, pollution-related dryness), and climate-specific hydration needs. These models improve diagnostic accuracy compared to Western-trained algorithms, boosting user satisfaction and trust. This localization strategy not only enhances market penetration in Asia-Pacific but also supports the region’s role as a key growth driver, with India’s 13.6% CAGR and China’s 10.2% CAGR far outpacing global averages.
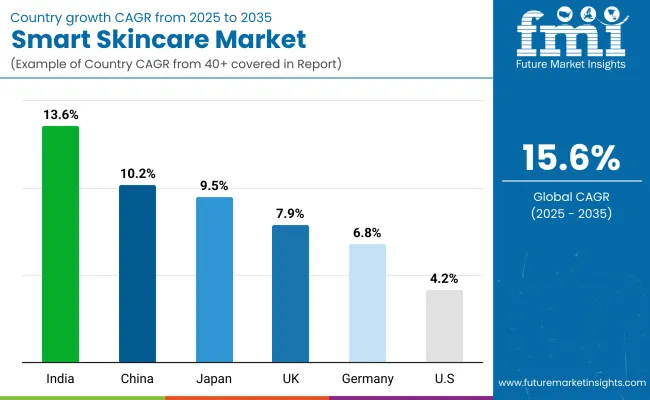
Analysis of Global Smart Skincare Market By Key Countries

Smart Skincare Market By Country

Countries CAGR (2025 to 2035)
China 10.2%
India 13.6%
Germany 6.8%
USA 4.2%
UK 7.9%
Japan 9.5%

The global Smart Skincare Market exhibits a distinct regional divergence in growth momentum, shaped by digital consumer behavior, wellness tech penetration, and investment in AI-powered personal care ecosystems. Asia-Pacific remains the fastest-growing region, led by India at 13.6% CAGR and China at 10.2% CAGR. China’s strong trajectory is driven by its booming D2C beauty-tech ecosystem, high smartphone penetration, and aggressive rollout of AI-integrated skincare tools across tier-1 and tier-2 cities.

State-supported innovation clusters in digital health and beauty technology, particularly in Shanghai and Shenzhen, have catalyzed domestic manufacturing and R&D in smart skincare devices. India’s expansion reflects steady adoption among Gen Z and millennial consumers, rising disposable incomes, and the growth of local brands offering affordable smart facial tools and app-based skincare platforms. Startups and mobile-first brands are leveraging influencer-driven commerce and vernacular content integration, accelerating market penetration beyond urban centers.

Europe maintains a stable yet high-value growth profile, with Germany growing at 6.8% CAGR and the UK at 7.9% CAGR, supported by mature consumer wellness markets, a regulatory focus on skin health products, and consistent innovation from heritage beauty brands. Germany’s strength lies in its dermo-cosmetic innovation hubs, while the UK benefits from a vibrant beauty-tech startup scene and strong digital adoption of AI-led skincare regimens.

North America continues to expand steadily, with the USA expected to grow at 4.2% CAGR, reflecting a blend of device maturity, personalized skincare demand, and integrated service ecosystems. The USA remains a hub for innovation in AI diagnostics, AR-assisted consultations, and subscription-based smart skincare kits, with growth increasingly driven by software engagement and service models over pure hardware sales. Japan, at 9.5% CAGR, reflects a balance between premium market maturity and conservative innovation cycles.

While the market is dominated by large players such as Shiseido and Panasonic, Japan’s adoption curve is increasingly shaped by personalized wellness trends, aging population needs, and emerging demand for smart patches and non-invasive skin analyzers.

Sales Outlook for Smart Skincare Market in the United States

Year USA Smart Skincare Market (USD Million)
2025 5569.43
2026 6381.44
2027 7311.82
2028 8377.86
2029 9599.32
2030 10998.86
2031 12602.45
2032 14439.83
2033 16545.10
2034 18957.31
2035 21721.21

The Smart Skincare Market in the United States is projected to grow at a 4.2% CAGR, maintaining the highest global market share at 23.4% in 2025 and 21.4% in 2035. The market is evolving from product-only purchases to hybrid ecosystems that integrate diagnostics, personalization, and device-linked skincare routines.

  • Smart facial cleansing devices account for 36.1% of market value in 2025 (USD 2.01 Billion), reflecting strong consumer trust in connected cleansing.
  • App-based diagnostics and AR/VR platforms are expanding revenue through subscription models and data-driven skin analysis.
  • Premium personalization kits bundled with tele-dermatology services are gaining traction across online and specialty retail channels.

Growth and Expansion Outlook for Smart Skincare Market in the United Kingdom

The Smart Skincare Market in the United Kingdom is projected to grow at a 7.9% CAGR, with market share rising from 8.7% in 2025 to 9.2% in 2035. British brands are leveraging diagnostic skin tech to drive DTC subscription adoption and refill-based product models.

  • Strong digital engagement supports rapid e-commerce expansion for AR-guided smart mirrors and at-home skin testers.
  • Dermatology clinics and wellness spas are integrating connected dispensers and AI mapping tools for skin sensitivity assessments.

Growth and Expansion Outlook for Smart Skincare Market in India

India’s Smart Skincare Market is forecast to grow at a 13.6% CAGR, with global market share increasing from 4.9% in 2025 to 5.7% in 2035. Smart facial cleansers and LED therapy tools are gaining traction in Tier II & III cities.

  • Indian wellness startups are embedding AI tools into native-language beauty apps for rural and semi-urban markets.
  • E-retailers are bundling diagnostic-enabled skincare kits with influencer-curated routines and refill services.

Sales Outlook for Smart Skincare Market in China

Countries 2025
China 13.4%
India 4.9%
Germany 13.4%
USA 23.4%
UK 8.7%
Japan 7.4%
Countries 2035
China 11.9%
India 5.7%
Germany 12.9%
USA 21.4%
UK 9.2%
Japan 8.1%

China is expected to grow at a 10.2% CAGR, with market share declining slightly from 13.4% in 2025 to 11.9% in 2035 as competition from emerging markets intensifies. Smart facial cleansing devices and diagnostic mirrors lead in 2025 value contribution.

  • Local companies are manufacturing low-cost AI tools and IoT-powered skincare testers, driving mass adoption.
  • Government support for smart wellness technologies and domestic brand innovation continues to accelerate market penetration.

Opportunity Analysis of USA Smart Skincare Market

Product Segment Market Value Share, 2025
Smart Facial Cleansing Devices 36.1%
Others 63.9%

The USA Smart Skincare Market is valued at USD 5,569.43 million in 2025, with Smart Facial Cleansing Devices leading at 36.1%. This leadership reflects strong consumer trust in connected cleansing devices, driven by advanced sensor integration, waterproof designs, and compatibility with app-based skin diagnostics. The preference for these devices is reinforced by USA consumers’ willingness to invest in premium, results-driven skincare tools that combine convenience and personalization.

The “Others” segmentcomprising LED therapy tools, AI-enabled skin analyzers, and connected masksremains dominant in overall value due to growing adoption in at-home spa treatments and tele-dermatology service bundles. As AI-powered skincare analytics mature, hybrid ecosystems that combine devices with subscription-based skincare regimens are expected to expand. Retail growth is supported by omnichannel strategies, with brands leveraging both specialty beauty retail and direct-to-consumer (DTC) e-commerce platforms.

Opportunity Analysis of China Smart Skincare Market

Application Segment Market Value Share, 2025
Anti-Aging & Wrinkle Reduction 46.7%
Others 53.3%

The China Smart Skincare Market is valued at USD 3,189.33 million in 2025, with Anti-Aging & Wrinkle Reduction application leading at 46.7%. This dominance is tied to China’s aging population dynamics, the rising popularity of preventative skincare among younger demographics, and the cultural emphasis on maintaining youthful skin. Local beauty-tech firms are rapidly scaling AI-powered diagnostic mirrors, IoT-enabled facial massagers, and customizable anti-aging regimens, making these technologies accessible to a mass-market audience.

The “Others” segment, which includes acne care, skin tone correction, and hydration optimization, remains critical for younger consumer groups, particularly in urban centers. Mass adoption is accelerated by D2C platforms, influencer-led product launches, and government-backed innovation hubs in Shanghai, Shenzhen, and Hangzhou. As e-commerce platforms integrate live shopping with AI skincare consultations, China’s smart skincare penetration is set to outpace many mature markets.
Competitive Landscape of Global Smart Skincare Market

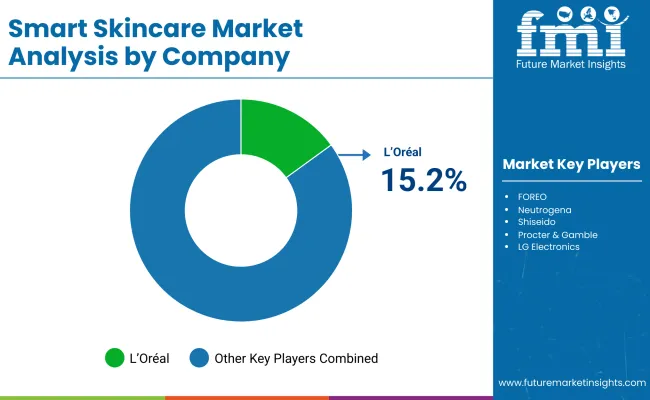
Smart Skincare Market By Company

The Smart Skincare Market is moderately fragmented, with a blend of global cosmetics giants, AI-driven startups, and sensor hardware specialists competing across interconnected application areas. Dominant multinational beauty brands such as L’Oréal, FOREO, and Neutrogena hold a significant portion of market value through integrated offerings that combine smart hardware, AI analytics, and personalized product delivery. Their leadership is backed by strong omnichannel presence, dermatological credibility, and continuous investment in wearable skincare and app-based diagnostics.

L’Oréal leads the market with its 15.2% share, driven by solutions like Perso and Skin Genius, offering real-time personalized formulation and smartphone-based AI diagnostics. Its acquisition of ModiFace has further strengthened its AR/AI capabilities across digital retail and virtual skincare consultations. Mid-sized players such as Shiseido, Amorepacific, and Beiersdorf are innovating in localized personalization, sensor-driven devices, and skin data platforms for Asian and European consumers.

These firms focus on leveraging regional skin profiles and dermatology-backed R&D to strengthen loyalty in key geographies. Tech-driven solution providers like HiMirror, Revieve, and Perfect Corp. are building cloud-based diagnostics, mobile scanning, and virtual try-on ecosystems. While not traditional beauty manufacturers, their AI-as-a-service models make them valuable collaborators or challengers depending on the retail channel.

Competitive differentiation is rapidly moving away from standalone hardware specifications toward end-to-end platforms that combine smart diagnostics, cloud analytics, and customized skincare delivery. Players with control over both consumer data and product customization pipelines are expected to retain a long-term strategic edge.

Key Developments in Global Smart Skincare Market

  • On January 5, 2023, L’Oréal unveiled the HAPTA robotic makeup applicator and Brow Magic eyebrow printer at CES 2023, introducing AI-driven tools designed to improve accessibility and hyper-personalized beauty routines. The launch emphasized inclusivity, particularly for individuals with limited hand and arm mobility.
  • In March 2024, L’Oréal’s Technology Incubator announced expanded investment into AI-enhanced diagnostic platforms and wearable skincare sensors, aimed at deepening real-time skin analysis and boosting personalized formulation engines through biometric and environmental data tracking.

Scope of the Report

Item Value
Quantitative Units USD 23.8 Billion
Product Type Smart Facial Cleansing Devices, Smart LED Therapy Masks, AI-Powered Skin Analyzers, Smart Mirrors with Skin Diagnostics, Connected Skincare Dispensers, Wearable Skincare Monitors, Smart Exfoliators & Massagers, App-Based Skin Analysis Tools, Customized Skincare Capsules/Dispensers
Application Daily Cleansing & Maintenance, Anti-Aging & Wrinkle Reduction, Acne & Blemish Treatment, Hydration & Moisture Monitoring, Skin Tone Correction, UV Monitoring, Texture & Elasticity, Sensitivity & Skin Reaction Assessment
Technology AI & Machine Learning, IoT & Sensor-Based Systems, AR/VR and Imaging Technologies, Cloud & Data Analytics Platforms
Distribution Channel Online Retail (E-commerce Platforms, Brand Websites), Offline Retail (Specialty Beauty Stores, Pharmacies, Department Stores, Dermatology Clinics & Aesthetic Spas)
Regions Covered North America, Europe, Asia-Pacific, Latin America, Middle East & Africa
Country Covered United States, Canada, Germany, France, United Kingdom, China, Japan, India, Brazil, South Africa
Key Companies Profiled L'Oréal, FOREO, Neutrogena, Shiseido, Procter & Gamble, LG Electronics, Panasonic, Revieve, HiMirror, La Roche- Posay, Lululab, Skin Inc, Opte, Perfect Corp, MiLi
Additional Attributes Dollar sales by product type, technology, and application; rapid growth in AI diagnostics and wearable skincare tools; market transition toward hybrid device-software ecosystems; expansion of subscription-based skincare models; regional tech adoption differences; investment in personalization engines; integration of AR/VR in virtual skin consultations; SaaS-based skin analysis platforms gaining momentum.

Key Segments

By Product Type:

  • Smart Facial Cleansing Devices
  • Smart LED Therapy Masks
  • AI-Powered Skin Analyzers
  • Smart Mirrors with Skin Diagnostics
  • Connected Skincare Dispensers
  • Wearable Skincare Monitors
  • Smart Exfoliators & Massagers
  • App-Based Skin Analysis Tools
  • Customized Skincare Capsules/Dispensers

By Technology:

  • AI & Machine Learning Technologies
  • IoT & Sensor-Based Systems
  • AR/VR and Imaging Technologies
  • Cloud & Data Analytics Platforms

By Application:

  • Anti-Aging & Wrinkle Reduction
  • Acne & Blemish Treatment
  • Daily Cleansing & Maintenance
  • Hydration & Moisture Monitoring
  • Brightening & Skin Tone Correction
  • UV Monitoring & Sun Damage Prevention
  • Texture, Pores & Elasticity Care
  • Sensitivity & Skin Reaction Assessment

By Distribution Channel:

  • Online Retail
    • E-commerce Platforms
    • Brand Websites
  • Offline Retail
    • Specialty Beauty Stores
    • Pharmacies & Drugstores
    • Department Stores
    • Dermatology Clinics & Aesthetic Spas

By Region:

  • South Asia & Pacific
  • North America
  • Latin America
  • Europe
  • East Asia
  • Middle East and Africa

Table of Content

  1. Executive Summary
    • Global Market Outlook
    • Demand-side Trends
    • Supply-side Trends
    • Technology Roadmap Analysis
    • Analysis and Recommendations
  2. Market Overview
    • Market Coverage / Taxonomy
    • Market Definition / Scope / Limitations
  3. Market Background
    • Market Dynamics
      • Drivers
      • Restraints
      • Opportunity
      • Trends
    • Scenario Forecast
      • Demand in Optimistic Scenario
      • Demand in Likely Scenario
      • Demand in Conservative Scenario
    • Opportunity Map Analysis
    • Product Life Cycle Analysis
    • Supply Chain Analysis
      • Supply Side Participants and their Roles
        • Producers
        • Mid-Level Participants (Traders/ Agents/ Brokers)
        • Wholesalers and Distributors
      • Value Added and Value Created at Node in the Supply Chain
      • List of Raw Material Suppliers
      • List of Existing and Potential Buyer’s
    • Investment Feasibility Matrix
    • Value Chain Analysis
      • Profit Margin Analysis
      • Wholesalers and Distributors
      • Retailers
    • PESTLE and Porter’s Analysis
    • Regulatory Landscape
      • By Key Regions
      • By Key Countries
    • Regional Parent Market Outlook
    • Production and Consumption Statistics
    • Import and Export Statistics
  4. Global Market Analysis 2020 to 2024 and Forecast, 2025 to 2035
    • Historical Market Size Value (USD Million) & Volume (Units) Analysis, 2020 to 2024
    • Current and Future Market Size Value (USD Million) & Volume (Units) Projections, 2025 to 2035
      • Y-o-Y Growth Trend Analysis
      • Absolute $ Opportunity Analysis
  5. Global Market Analysis 2020 to 2024 and Forecast 2025 to 2035, By Product Type
    • Introduction / Key Findings
    • Historical Market Size Value (USD Million) & Volume (Units) Analysis By Product Type, 2020 to 2024
    • Current and Future Market Size Value (USD Million) & Volume (Units) Analysis and Forecast By Product Type, 2025 to 2035
      • Smart Facial Cleansing Devices
      • Smart LED Therapy Masks
      • AI-Powered Skin Analyzers
      • Smart Mirrors with Skin Diagnostics
      • Connected Skincare Dispensers
      • Wearable Skincare Monitors
      • Smart Exfoliators & Massagers
      • App-Based Skin Analysis Tools
      • Customized Skincare Capsules/Dispensers
  1. Y-o-Y Growth Trend Analysis By Product Type, 2020 to 2024
  2. Absolute $ Opportunity Analysis By Product Type, 2025 to 2035
  3. Global Market Analysis 2020 to 2024 and Forecast 2025 to 2035, By Technology
    • Introduction / Key Findings
    • Historical Market Size Value (USD Million) & Volume (Units) Analysis By Technology , 2020 to 2024
    • Current and Future Market Size Value (USD Million) & Volume (Units) Analysis and Forecast By Technology , 2025 to 2035
      • AI & Machine Learning Technologies
      • IoT & Sensor-Based Systems
      • AR/VR and Imaging Technologies
      • Cloud & Data Analytics Platforms
    • Y-o-Y Growth Trend Analysis By Technology , 2020 to 2024
    • Absolute $ Opportunity Analysis By Technology , 2025 to 2035
  4. Global Market Analysis 2020 to 2024 and Forecast 2025 to 2035, By Application
    • Introduction / Key Findings
    • Historical Market Size Value (USD Million) & Volume (Units) Analysis By Application, 2020 to 2024
    • Current and Future Market Size Value (USD Million) & Volume (Units) Analysis and Forecast By Application, 2025 to 2035
      • Anti-Aging & Wrinkle Reduction
      • Acne & Blemish Treatment
      • Daily Cleansing & Maintenance
      • Hydration & Moisture Monitoring
      • Brightening & Skin Tone Correction
      • UV Monitoring & Sun Damage Prevention
      • Texture, Pores & Elasticity Care
      • Sensitivity & Skin Reaction Assessment
    • Y-o-Y Growth Trend Analysis By Application, 2020 to 2024
    • Absolute $ Opportunity Analysis By Application, 2025 to 2035
  5. Global Market Analysis 2020 to 2024 and Forecast 2025 to 2035, By Distribution Channel
    • Introduction / Key Findings
    • Historical Market Size Value (USD Million) & Volume (Units) Analysis By Distribution Channel, 2020 to 2024
    • Current and Future Market Size Value (USD Million) & Volume (Units) Analysis and Forecast By Distribution Channel, 2025 to 2035
      • Online Retail
        • E-commerce Platforms
        • Brand Websites
      • Offline Retail
        • Specialty Beauty Stores
        • Pharmacies & Drugstores
        • Department Stores
        • Dermatology Clinics & Aesthetic Spas
    • Y-o-Y Growth Trend Analysis By Distribution Channel, 2020 to 2024
    • Absolute $ Opportunity Analysis By Distribution Channel, 2025 to 2035
  6. Global Market Analysis 2020 to 2024 and Forecast 2025 to 2035, By Region
    • Introduction
    • Historical Market Size Value (USD Million) & Volume (Units) Analysis By Region, 2020 to 2024
    • Current Market Size Value (USD Million) & Volume (Units) Analysis and Forecast By Region, 2025 to 2035
      • South Asia & Pacific
      • North America
      • Latin America
      • Europe
      • East Asia
      • Middle East and Africa
    • Market Attractiveness Analysis By Region
  7. South Asia & Pacific Market Analysis 2020 to 2024 and Forecast 2025 to 2035, By Country
    • Historical Market Size Value (USD Million) & Volume (Units) Trend Analysis By Market Taxonomy, 2020 to 2024
    • Market Size Value (USD Million) & Volume (Units) Forecast By Market Taxonomy, 2025 to 2035
      • By Country
        • India
        • Thailand
        • Malaysia
        • Indonesia
        • Singapore
        • Vietnam
        • Australia
        • New Zealand
        • Rest of South Asia
      • By Product Type
      • By Technology
      • By Application
      • By Distribution Channel
    • Market Attractiveness Analysis
      • By Country
      • By Product Type
      • By Technology
      • By Application
      • By Distribution Channel
    • Key Takeaways
  8. North America Market Analysis 2020 to 2024 and Forecast 2025 to 2035, By Country
    • Historical Market Size Value (USD Million) & Volume (Units) Trend Analysis By Market Taxonomy, 2020 to 2024
    • Market Size Value (USD Million) & Volume (Units) Forecast By Market Taxonomy, 2025 to 2035
      • By Country
        • USA
        • Canada
      • By Product Type
      • By Technology
      • By Application
      • By Distribution Channel
    • Market Attractiveness Analysis
      • By Country
      • By Product Type
      • By Technology
      • By Application
      • By Distribution Channel
    • Key Takeaways
  9. Latin America Market Analysis 2020 to 2024 and Forecast 2025 to 2035, By Country
    • Historical Market Size Value (USD Million) & Volume (Units) Trend Analysis By Market Taxonomy, 2020 to 2024
    • Market Size Value (USD Million) & Volume (Units) Forecast By Market Taxonomy, 2025 to 2035
      • By Country
        • Brazil
        • Mexico
        • Colombia
        • Rest of Latin America
      • By Product Type
      • By Technology
      • By Application
      • By Distribution Channel
    • Market Attractiveness Analysis
      • By Country
      • By Product Type
      • By Technology
      • By Application
      • By Distribution Channel
    • Key Takeaways
  10. Europe Market Analysis 2020 to 2024 and Forecast 2025 to 2035, By Country
    • Historical Market Size Value (USD Million) & Volume (Units) Trend Analysis By Market Taxonomy, 2020 to 2024
    • Market Size Value (USD Million) & Volume (Units) Forecast By Market Taxonomy, 2025 to 2035
      • By Country
        • Germany
        • UK
        • France
        • Italy
        • Spain
        • Belgium
        • Netherlands
        • Nordic
        • Switzerland
        • Russia
        • Poland
        • Rest of Europe
      • By Product Type
      • By Technology
      • By Application
      • By Distribution Channel
    • Market Attractiveness Analysis
      • By Country
      • By Product Type
      • By Technology
      • By Application
      • By Distribution Channel
    • Key Takeaways
  11. East Asia Market Analysis 2020 to 2024 and Forecast 2025 to 2035, By Country
    • Historical Market Size Value (USD Million) & Volume (Units) Trend Analysis By Market Taxonomy, 2020 to 2024
    • Market Size Value (USD Million) & Volume (Units) Forecast By Market Taxonomy, 2025 to 2035
      • By Country
        • China
        • Japan
        • South Korea
      • By Product Type
      • By Technology
      • By Application
      • By Distribution Channel
    • Market Attractiveness Analysis
      • By Country
      • By Product Type
      • By Technology
      • By Application
      • By Distribution Channel
    • Key Takeaways
  12. Middle East and Africa Market Analysis 2020 to 2024 and Forecast 2025 to 2035, By Country
    • Historical Market Size Value (USD Million) & Volume (Units) Trend Analysis By Market Taxonomy, 2020 to 2024
    • Market Size Value (USD Million) & Volume (Units) Forecast By Market Taxonomy, 2025 to 2035
      • By Country
        • Turkey
        • UAE
        • Saudi Arabia
        • Israel
        • Other GCC Countries
        • North Africa
        • South Africa
      • By Product Type
      • By Technology
      • By Application
      • By Distribution Channel
    • Market Attractiveness Analysis
      • By Country
      • By Product Type
      • By Technology
      • By Application
      • By Distribution Channel
    • Key Takeaways
  13. Key Countries Market Analysis
    • USA
      • Pricing Analysis
      • Market Share Analysis, 2024
        • By Product Type
        • By Technology
        • By Application
        • By Distribution Channel
    • Canada
      • Pricing Analysis
      • Market Share Analysis, 2024
        • By Product Type
        • By Technology
        • By Application
        • By Distribution Channel
    • Brazil
      • Pricing Analysis
      • Market Share Analysis, 2024
        • By Product Type
        • By Technology
        • By Application
        • By Distribution Channel
    • Mexico
      • Pricing Analysis
      • Market Share Analysis, 2024
        • By Product Type
        • By Technology
        • By Application
        • By Distribution Channel
    • Colombia
      • Pricing Analysis
      • Market Share Analysis, 2024
        • By Product Type
        • By Technology
        • By Application
        • By Distribution Channel
    • Rest of Latin America
      • Pricing Analysis
      • Market Share Analysis, 2024
        • By Product Type
        • By Technology
        • By Application
        • By Distribution Channel
    • Germany
      • Pricing Analysis
      • Market Share Analysis, 2024
        • By Product Type
        • By Technology
        • By Application
        • By Distribution Channel
    • UK
      • Pricing Analysis
      • Market Share Analysis, 2024
        • By Product Type
        • By Technology
        • By Application
        • By Distribution Channel
    • France
      • Pricing Analysis
      • Market Share Analysis, 2024
        • By Product Type
        • By Technology
        • By Application
        • By Distribution Channel
    • Italy
      • Pricing Analysis
      • Market Share Analysis, 2024
        • By Product Type
        • By Technology
        • By Application
        • By Distribution Channel
    • Spain
      • Pricing Analysis
      • Market Share Analysis, 2024
        • By Product Type
        • By Technology
        • By Application
        • By Distribution Channel
    • Belgium
      • Pricing Analysis
      • Market Share Analysis, 2024
        • By Product Type
        • By Technology
        • By Application
        • By Distribution Channel
    • Netherlands
      • Pricing Analysis
      • Market Share Analysis, 2024
        • By Product Type
        • By Technology
        • By Application
        • By Distribution Channel
    • Nordic
      • Pricing Analysis
      • Market Share Analysis, 2024
        • By Product Type
        • By Technology
        • By Application
        • By Distribution Channel
    • Switzerland
      • Pricing Analysis
      • Market Share Analysis, 2024
        • By Product Type
        • By Technology
        • By Application
        • By Distribution Channel
    • Russia
      • Pricing Analysis
      • Market Share Analysis, 2024
        • By Product Type
        • By Technology
        • By Application
        • By Distribution Channel
    • Poland
      • Pricing Analysis
      • Market Share Analysis, 2024
        • By Product Type
        • By Technology
        • By Application
        • By Distribution Channel
    • Rest of Europe
      • Pricing Analysis
      • Market Share Analysis, 2024
        • By Product Type
        • By Technology
        • By Application
        • By Distribution Channel
    • China
      • Pricing Analysis
      • Market Share Analysis, 2024
        • By Product Type
        • By Technology
        • By Application
        • By Distribution Channel
    • Japan
      • Pricing Analysis
      • Market Share Analysis, 2024
        • By Product Type
        • By Technology
        • By Application
        • By Distribution Channel
    • South Korea
      • Pricing Analysis
      • Market Share Analysis, 2024
        • By Product Type
        • By Technology
        • By Application
        • By Distribution Channel
    • India
      • Pricing Analysis
      • Market Share Analysis, 2024
        • By Product Type
        • By Technology
        • By Application
        • By Distribution Channel
    • Thailand
      • Pricing Analysis
      • Market Share Analysis, 2024
        • By Product Type
        • By Technology
        • By Application
        • By Distribution Channel
    • Malaysia
      • Pricing Analysis
      • Market Share Analysis, 2024
        • By Product Type
        • By Technology
        • By Application
        • By Distribution Channel
    • Indonesia
      • Pricing Analysis
      • Market Share Analysis, 2024
        • By Product Type
        • By Technology
        • By Application
        • By Distribution Channel
    • Singapore
      • Pricing Analysis
      • Market Share Analysis, 2024
        • By Product Type
        • By Technology
        • By Application
        • By Distribution Channel
    • Vietnam
      • Pricing Analysis
      • Market Share Analysis, 2024
        • By Product Type
        • By Technology
        • By Application
        • By Distribution Channel
    • Australia
      • Pricing Analysis
      • Market Share Analysis, 2024
        • By Product Type
        • By Technology
        • By Application
        • By Distribution Channel
    • New Zealand
      • Pricing Analysis
      • Market Share Analysis, 2024
        • By Product Type
        • By Technology
        • By Application
        • By Distribution Channel
    • Rest of South Asia
      • Pricing Analysis
      • Market Share Analysis, 2024
        • By Product Type
        • By Technology
        • By Application
        • By Distribution Channel
  14. Market Structure Analysis
    • Competition Dashboard
    • Competition Benchmarking
    • Market Share Analysis of Top Players
      • By Regional
      • By Product Type
      • By Technology
      • By Application
      • By Distribution Channel
  15. Competition Analysis
    • Competition Deep Dive
      • L'Oréal
        • Overview
        • Product Portfolio
        • Profitability by Market Segments (Product/Age /Sales Channel/Region)
        • Sales Footprint
        • Strategy Overview
          • Marketing Strategy
          • Product Strategy
          • Channel Strategy
      • FOREO
        • Overview
        • Product Portfolio
        • Profitability by Market Segments (Product/Age /Sales Channel/Region)
        • Sales Footprint
        • Strategy Overview
          • Marketing Strategy
          • Product Strategy
          • Channel Strategy
      • Neutrogena
        • Overview
        • Product Portfolio
        • Profitability by Market Segments (Product/Age /Sales Channel/Region)
        • Sales Footprint
        • Strategy Overview
          • Marketing Strategy
          • Product Strategy
          • Channel Strategy
      • Shiseido
        • Overview
        • Product Portfolio
        • Profitability by Market Segments (Product/Age /Sales Channel/Region)
        • Sales Footprint
        • Strategy Overview
          • Marketing Strategy
          • Product Strategy
          • Channel Strategy
      • Procter & Gamble
        • Overview
        • Product Portfolio
        • Profitability by Market Segments (Product/Age /Sales Channel/Region)
        • Sales Footprint
        • Strategy Overview
          • Marketing Strategy
          • Product Strategy
          • Channel Strategy
      • LG Electronics
        • Overview
        • Product Portfolio
        • Profitability by Market Segments (Product/Age /Sales Channel/Region)
        • Sales Footprint
        • Strategy Overview
          • Marketing Strategy
          • Product Strategy
          • Channel Strategy
      • Panasonic
        • Overview
        • Product Portfolio
        • Profitability by Market Segments (Product/Age /Sales Channel/Region)
        • Sales Footprint
        • Strategy Overview
          • Marketing Strategy
          • Product Strategy
          • Channel Strategy
      • Revieve
        • Overview
        • Product Portfolio
        • Profitability by Market Segments (Product/Age /Sales Channel/Region)
        • Sales Footprint
        • Strategy Overview
          • Marketing Strategy
          • Product Strategy
          • Channel Strategy
      • HiMirror
        • Overview
        • Product Portfolio
        • Profitability by Market Segments (Product/Age /Sales Channel/Region)
        • Sales Footprint
        • Strategy Overview
          • Marketing Strategy
          • Product Strategy
          • Channel Strategy
      • La Roche-Posay
        • Overview
        • Product Portfolio
        • Profitability by Market Segments (Product/Age /Sales Channel/Region)
        • Sales Footprint
        • Strategy Overview
          • Marketing Strategy
          • Product Strategy
          • Channel Strategy
      • Lululab
        • Overview
        • Product Portfolio
        • Profitability by Market Segments (Product/Age /Sales Channel/Region)
        • Sales Footprint
        • Strategy Overview
          • Marketing Strategy
          • Product Strategy
          • Channel Strategy
      • Skin Inc
        • Overview
        • Product Portfolio
        • Profitability by Market Segments (Product/Age /Sales Channel/Region)
        • Sales Footprint
        • Strategy Overview
          • Marketing Strategy
          • Product Strategy
          • Channel Strategy
      • Opte
        • Overview
        • Product Portfolio
        • Profitability by Market Segments (Product/Age /Sales Channel/Region)
        • Sales Footprint
        • Strategy Overview
          • Marketing Strategy
          • Product Strategy
          • Channel Strategy
      • Perfect Corp
        • Overview
        • Product Portfolio
        • Profitability by Market Segments (Product/Age /Sales Channel/Region)
        • Sales Footprint
        • Strategy Overview
          • Marketing Strategy
          • Product Strategy
          • Channel Strategy
      • MiLi
        • Overview
        • Product Portfolio
        • Profitability by Market Segments (Product/Age /Sales Channel/Region)
        • Sales Footprint
        • Strategy Overview
          • Marketing Strategy
          • Product Strategy
          • Channel Strategy
  16. Assumptions & Acronyms Used
  17. Research Methodology

List of Tables

  • Table 1: Global Market Value (USD Million) Forecast by Region, 2020-2035
  • Table 2: Global Market Volume (Units) Forecast by Region, 2020-2035
  • Table 3: Global Market Value (USD Million) Forecast by Product Type, 2020-2035
  • Table 4: Global Market Volume (Units) Forecast by Product Type, 2020-2035
  • Table 5: Global Market Value (USD Million) Forecast by Technology , 2020-2035
  • Table 6: Global Market Volume (Units) Forecast by Technology , 2020-2035
  • Table 7: Global Market Value (USD Million) Forecast by Application, 2020-2035
  • Table 8: Global Market Volume (Units) Forecast by Application, 2020-2035
  • Table 9: Global Market Value (USD Million) Forecast by Distribution Channel, 2020-2035
  • Table 10: Global Market Volume (Units) Forecast by Distribution Channel, 2020-2035
  • Table 11: South Asia & Pacific Market Value (USD Million) Forecast by Country, 2020-2035
  • Table 12: South Asia & Pacific Market Volume (Units) Forecast by Country, 2020-2035
  • Table 13: South Asia & Pacific Market Value (USD Million) Forecast by Product Type, 2020-2035
  • Table 14: South Asia & Pacific Market Volume (Units) Forecast by Product Type, 2020-2035
  • Table 15: South Asia & Pacific Market Value (USD Million) Forecast by Technology , 2020-2035
  • Table 16: South Asia & Pacific Market Volume (Units) Forecast by Technology , 2020-2035
  • Table 17: South Asia & Pacific Market Value (USD Million) Forecast by Application, 2020-2035
  • Table 18: South Asia & Pacific Market Volume (Units) Forecast by Application, 2020-2035
  • Table 19: South Asia & Pacific Market Value (USD Million) Forecast by Distribution Channel, 2020-2035
  • Table 20: South Asia & Pacific Market Volume (Units) Forecast by Distribution Channel, 2020-2035
  • Table 21: North America Market Value (USD Million) Forecast by Country, 2020-2035
  • Table 22: North America Market Volume (Units) Forecast by Country, 2020-2035
  • Table 23: North America Market Value (USD Million) Forecast by Product Type, 2020-2035
  • Table 24: North America Market Volume (Units) Forecast by Product Type, 2020-2035
  • Table 25: North America Market Value (USD Million) Forecast by Technology , 2020-2035
  • Table 26: North America Market Volume (Units) Forecast by Technology , 2020-2035
  • Table 27: North America Market Value (USD Million) Forecast by Application, 2020-2035
  • Table 28: North America Market Volume (Units) Forecast by Application, 2020-2035
  • Table 29: North America Market Value (USD Million) Forecast by Distribution Channel, 2020-2035
  • Table 30: North America Market Volume (Units) Forecast by Distribution Channel, 2020-2035
  • Table 31: Latin America Market Value (USD Million) Forecast by Country, 2020-2035
  • Table 32: Latin America Market Volume (Units) Forecast by Country, 2020-2035
  • Table 33: Latin America Market Value (USD Million) Forecast by Product Type, 2020-2035
  • Table 34: Latin America Market Volume (Units) Forecast by Product Type, 2020-2035
  • Table 35: Latin America Market Value (USD Million) Forecast by Technology , 2020-2035
  • Table 36: Latin America Market Volume (Units) Forecast by Technology , 2020-2035
  • Table 37: Latin America Market Value (USD Million) Forecast by Application, 2020-2035
  • Table 38: Latin America Market Volume (Units) Forecast by Application, 2020-2035
  • Table 39: Latin America Market Value (USD Million) Forecast by Distribution Channel, 2020-2035
  • Table 40: Latin America Market Volume (Units) Forecast by Distribution Channel, 2020-2035
  • Table 41: Europe Market Value (USD Million) Forecast by Country, 2020-2035
  • Table 42: Europe Market Volume (Units) Forecast by Country, 2020-2035
  • Table 43: Europe Market Value (USD Million) Forecast by Product Type, 2020-2035
  • Table 44: Europe Market Volume (Units) Forecast by Product Type, 2020-2035
  • Table 45: Europe Market Value (USD Million) Forecast by Technology , 2020-2035
  • Table 46: Europe Market Volume (Units) Forecast by Technology , 2020-2035
  • Table 47: Europe Market Value (USD Million) Forecast by Application, 2020-2035
  • Table 48: Europe Market Volume (Units) Forecast by Application, 2020-2035
  • Table 49: Europe Market Value (USD Million) Forecast by Distribution Channel, 2020-2035
  • Table 50: Europe Market Volume (Units) Forecast by Distribution Channel, 2020-2035
  • Table 51: East Asia Market Value (USD Million) Forecast by Country, 2020-2035
  • Table 52: East Asia Market Volume (Units) Forecast by Country, 2020-2035
  • Table 53: East Asia Market Value (USD Million) Forecast by Product Type, 2020-2035
  • Table 54: East Asia Market Volume (Units) Forecast by Product Type, 2020-2035
  • Table 55: East Asia Market Value (USD Million) Forecast by Technology , 2020-2035
  • Table 56: East Asia Market Volume (Units) Forecast by Technology , 2020-2035
  • Table 57: East Asia Market Value (USD Million) Forecast by Application, 2020-2035
  • Table 58: East Asia Market Volume (Units) Forecast by Application, 2020-2035
  • Table 59: East Asia Market Value (USD Million) Forecast by Distribution Channel, 2020-2035
  • Table 60: East Asia Market Volume (Units) Forecast by Distribution Channel, 2020-2035
  • Table 61: Middle East and Africa Market Value (USD Million) Forecast by Country, 2020-2035
  • Table 62: Middle East and Africa Market Volume (Units) Forecast by Country, 2020-2035
  • Table 63: Middle East and Africa Market Value (USD Million) Forecast by Product Type, 2020-2035
  • Table 64: Middle East and Africa Market Volume (Units) Forecast by Product Type, 2020-2035
  • Table 65: Middle East and Africa Market Value (USD Million) Forecast by Technology , 2020-2035
  • Table 66: Middle East and Africa Market Volume (Units) Forecast by Technology , 2020-2035
  • Table 67: Middle East and Africa Market Value (USD Million) Forecast by Application, 2020-2035
  • Table 68: Middle East and Africa Market Volume (Units) Forecast by Application, 2020-2035
  • Table 69: Middle East and Africa Market Value (USD Million) Forecast by Distribution Channel, 2020-2035
  • Table 70: Middle East and Africa Market Volume (Units) Forecast by Distribution Channel, 2020-2035

List of Figures

  • Figure 1: Global Market Value (USD Million) by Product Type, 2025-2035
  • Figure 2: Global Market Value (USD Million) by Technology , 2025-2035
  • Figure 3: Global Market Value (USD Million) by Application, 2025-2035
  • Figure 4: Global Market Value (USD Million) by Distribution Channel, 2025-2035
  • Figure 5: Global Market Value (USD Million) by Region, 2025-2035
  • Figure 6: Global Market Value (USD Million) Analysis by Region, 2020-2035
  • Figure 7: Global Market Volume (Units) Analysis by Region, 2020-2035
  • Figure 8: Global Market Value Share (%) and BPS Analysis by Region, 2025-2035
  • Figure 9: Global Market Y-o-Y Growth (%) Projections by Region, 2025-2035
  • Figure 10: Global Market Value (USD Million) Analysis by Product Type, 2020-2035
  • Figure 11: Global Market Volume (Units) Analysis by Product Type, 2020-2035
  • Figure 12: Global Market Value Share (%) and BPS Analysis by Product Type, 2025-2035
  • Figure 13: Global Market Y-o-Y Growth (%) Projections by Product Type, 2025-2035
  • Figure 14: Global Market Value (USD Million) Analysis by Technology , 2020-2035
  • Figure 15: Global Market Volume (Units) Analysis by Technology , 2020-2035
  • Figure 16: Global Market Value Share (%) and BPS Analysis by Technology , 2025-2035
  • Figure 17: Global Market Y-o-Y Growth (%) Projections by Technology , 2025-2035
  • Figure 18: Global Market Value (USD Million) Analysis by Application, 2020-2035
  • Figure 19: Global Market Volume (Units) Analysis by Application, 2020-2035
  • Figure 20: Global Market Value Share (%) and BPS Analysis by Application, 2025-2035
  • Figure 21: Global Market Y-o-Y Growth (%) Projections by Application, 2025-2035
  • Figure 22: Global Market Value (USD Million) Analysis by Distribution Channel, 2020-2035
  • Figure 23: Global Market Volume (Units) Analysis by Distribution Channel, 2020-2035
  • Figure 24: Global Market Value Share (%) and BPS Analysis by Distribution Channel, 2025-2035
  • Figure 25: Global Market Y-o-Y Growth (%) Projections by Distribution Channel, 2025-2035
  • Figure 26: Global Market Attractiveness by Product Type, 2025-2035
  • Figure 27: Global Market Attractiveness by Technology , 2025-2035
  • Figure 28: Global Market Attractiveness by Application, 2025-2035
  • Figure 29: Global Market Attractiveness by Distribution Channel, 2025-2035
  • Figure 30: Global Market Attractiveness by Region, 2025-2035
  • Figure 31: South Asia & Pacific Market Value (USD Million) by Product Type, 2025-2035
  • Figure 32: South Asia & Pacific Market Value (USD Million) by Technology , 2025-2035
  • Figure 33: South Asia & Pacific Market Value (USD Million) by Application, 2025-2035
  • Figure 34: South Asia & Pacific Market Value (USD Million) by Distribution Channel, 2025-2035
  • Figure 35: South Asia & Pacific Market Value (USD Million) by Country, 2025-2035
  • Figure 36: South Asia & Pacific Market Value (USD Million) Analysis by Country, 2020-2035
  • Figure 37: South Asia & Pacific Market Volume (Units) Analysis by Country, 2020-2035
  • Figure 38: South Asia & Pacific Market Value Share (%) and BPS Analysis by Country, 2025-2035
  • Figure 39: South Asia & Pacific Market Y-o-Y Growth (%) Projections by Country, 2025-2035
  • Figure 40: South Asia & Pacific Market Value (USD Million) Analysis by Product Type, 2020-2035
  • Figure 41: South Asia & Pacific Market Volume (Units) Analysis by Product Type, 2020-2035
  • Figure 42: South Asia & Pacific Market Value Share (%) and BPS Analysis by Product Type, 2025-2035
  • Figure 43: South Asia & Pacific Market Y-o-Y Growth (%) Projections by Product Type, 2025-2035
  • Figure 44: South Asia & Pacific Market Value (USD Million) Analysis by Technology , 2020-2035
  • Figure 45: South Asia & Pacific Market Volume (Units) Analysis by Technology , 2020-2035
  • Figure 46: South Asia & Pacific Market Value Share (%) and BPS Analysis by Technology , 2025-2035
  • Figure 47: South Asia & Pacific Market Y-o-Y Growth (%) Projections by Technology , 2025-2035
  • Figure 48: South Asia & Pacific Market Value (USD Million) Analysis by Application, 2020-2035
  • Figure 49: South Asia & Pacific Market Volume (Units) Analysis by Application, 2020-2035
  • Figure 50: South Asia & Pacific Market Value Share (%) and BPS Analysis by Application, 2025-2035
  • Figure 51: South Asia & Pacific Market Y-o-Y Growth (%) Projections by Application, 2025-2035
  • Figure 52: South Asia & Pacific Market Value (USD Million) Analysis by Distribution Channel, 2020-2035
  • Figure 53: South Asia & Pacific Market Volume (Units) Analysis by Distribution Channel, 2020-2035
  • Figure 54: South Asia & Pacific Market Value Share (%) and BPS Analysis by Distribution Channel, 2025-2035
  • Figure 55: South Asia & Pacific Market Y-o-Y Growth (%) Projections by Distribution Channel, 2025-2035
  • Figure 56: South Asia & Pacific Market Attractiveness by Product Type, 2025-2035
  • Figure 57: South Asia & Pacific Market Attractiveness by Technology , 2025-2035
  • Figure 58: South Asia & Pacific Market Attractiveness by Application, 2025-2035
  • Figure 59: South Asia & Pacific Market Attractiveness by Distribution Channel, 2025-2035
  • Figure 60: South Asia & Pacific Market Attractiveness by Country, 2025-2035
  • Figure 61: North America Market Value (USD Million) by Product Type, 2025-2035
  • Figure 62: North America Market Value (USD Million) by Technology , 2025-2035
  • Figure 63: North America Market Value (USD Million) by Application, 2025-2035
  • Figure 64: North America Market Value (USD Million) by Distribution Channel, 2025-2035
  • Figure 65: North America Market Value (USD Million) by Country, 2025-2035
  • Figure 66: North America Market Value (USD Million) Analysis by Country, 2020-2035
  • Figure 67: North America Market Volume (Units) Analysis by Country, 2020-2035
  • Figure 68: North America Market Value Share (%) and BPS Analysis by Country, 2025-2035
  • Figure 69: North America Market Y-o-Y Growth (%) Projections by Country, 2025-2035
  • Figure 70: North America Market Value (USD Million) Analysis by Product Type, 2020-2035
  • Figure 71: North America Market Volume (Units) Analysis by Product Type, 2020-2035
  • Figure 72: North America Market Value Share (%) and BPS Analysis by Product Type, 2025-2035
  • Figure 73: North America Market Y-o-Y Growth (%) Projections by Product Type, 2025-2035
  • Figure 74: North America Market Value (USD Million) Analysis by Technology , 2020-2035
  • Figure 75: North America Market Volume (Units) Analysis by Technology , 2020-2035
  • Figure 76: North America Market Value Share (%) and BPS Analysis by Technology , 2025-2035
  • Figure 77: North America Market Y-o-Y Growth (%) Projections by Technology , 2025-2035
  • Figure 78: North America Market Value (USD Million) Analysis by Application, 2020-2035
  • Figure 79: North America Market Volume (Units) Analysis by Application, 2020-2035
  • Figure 80: North America Market Value Share (%) and BPS Analysis by Application, 2025-2035
  • Figure 81: North America Market Y-o-Y Growth (%) Projections by Application, 2025-2035
  • Figure 82: North America Market Value (USD Million) Analysis by Distribution Channel, 2020-2035
  • Figure 83: North America Market Volume (Units) Analysis by Distribution Channel, 2020-2035
  • Figure 84: North America Market Value Share (%) and BPS Analysis by Distribution Channel, 2025-2035
  • Figure 85: North America Market Y-o-Y Growth (%) Projections by Distribution Channel, 2025-2035
  • Figure 86: North America Market Attractiveness by Product Type, 2025-2035
  • Figure 87: North America Market Attractiveness by Technology , 2025-2035
  • Figure 88: North America Market Attractiveness by Application, 2025-2035
  • Figure 89: North America Market Attractiveness by Distribution Channel, 2025-2035
  • Figure 90: North America Market Attractiveness by Country, 2025-2035
  • Figure 91: Latin America Market Value (USD Million) by Product Type, 2025-2035
  • Figure 92: Latin America Market Value (USD Million) by Technology , 2025-2035
  • Figure 93: Latin America Market Value (USD Million) by Application, 2025-2035
  • Figure 94: Latin America Market Value (USD Million) by Distribution Channel, 2025-2035
  • Figure 95: Latin America Market Value (USD Million) by Country, 2025-2035
  • Figure 96: Latin America Market Value (USD Million) Analysis by Country, 2020-2035
  • Figure 97: Latin America Market Volume (Units) Analysis by Country, 2020-2035
  • Figure 98: Latin America Market Value Share (%) and BPS Analysis by Country, 2025-2035
  • Figure 99: Latin America Market Y-o-Y Growth (%) Projections by Country, 2025-2035
  • Figure 100: Latin America Market Value (USD Million) Analysis by Product Type, 2020-2035
  • Figure 101: Latin America Market Volume (Units) Analysis by Product Type, 2020-2035
  • Figure 102: Latin America Market Value Share (%) and BPS Analysis by Product Type, 2025-2035
  • Figure 103: Latin America Market Y-o-Y Growth (%) Projections by Product Type, 2025-2035
  • Figure 104: Latin America Market Value (USD Million) Analysis by Technology , 2020-2035
  • Figure 105: Latin America Market Volume (Units) Analysis by Technology , 2020-2035
  • Figure 106: Latin America Market Value Share (%) and BPS Analysis by Technology , 2025-2035
  • Figure 107: Latin America Market Y-o-Y Growth (%) Projections by Technology , 2025-2035
  • Figure 108: Latin America Market Value (USD Million) Analysis by Application, 2020-2035
  • Figure 109: Latin America Market Volume (Units) Analysis by Application, 2020-2035
  • Figure 110: Latin America Market Value Share (%) and BPS Analysis by Application, 2025-2035
  • Figure 111: Latin America Market Y-o-Y Growth (%) Projections by Application, 2025-2035
  • Figure 112: Latin America Market Value (USD Million) Analysis by Distribution Channel, 2020-2035
  • Figure 113: Latin America Market Volume (Units) Analysis by Distribution Channel, 2020-2035
  • Figure 114: Latin America Market Value Share (%) and BPS Analysis by Distribution Channel, 2025-2035
  • Figure 115: Latin America Market Y-o-Y Growth (%) Projections by Distribution Channel, 2025-2035
  • Figure 116: Latin America Market Attractiveness by Product Type, 2025-2035
  • Figure 117: Latin America Market Attractiveness by Technology , 2025-2035
  • Figure 118: Latin America Market Attractiveness by Application, 2025-2035
  • Figure 119: Latin America Market Attractiveness by Distribution Channel, 2025-2035
  • Figure 120: Latin America Market Attractiveness by Country, 2025-2035
  • Figure 121: Europe Market Value (USD Million) by Product Type, 2025-2035
  • Figure 122: Europe Market Value (USD Million) by Technology , 2025-2035
  • Figure 123: Europe Market Value (USD Million) by Application, 2025-2035
  • Figure 124: Europe Market Value (USD Million) by Distribution Channel, 2025-2035
  • Figure 125: Europe Market Value (USD Million) by Country, 2025-2035
  • Figure 126: Europe Market Value (USD Million) Analysis by Country, 2020-2035
  • Figure 127: Europe Market Volume (Units) Analysis by Country, 2020-2035
  • Figure 128: Europe Market Value Share (%) and BPS Analysis by Country, 2025-2035
  • Figure 129: Europe Market Y-o-Y Growth (%) Projections by Country, 2025-2035
  • Figure 130: Europe Market Value (USD Million) Analysis by Product Type, 2020-2035
  • Figure 131: Europe Market Volume (Units) Analysis by Product Type, 2020-2035
  • Figure 132: Europe Market Value Share (%) and BPS Analysis by Product Type, 2025-2035
  • Figure 133: Europe Market Y-o-Y Growth (%) Projections by Product Type, 2025-2035
  • Figure 134: Europe Market Value (USD Million) Analysis by Technology , 2020-2035
  • Figure 135: Europe Market Volume (Units) Analysis by Technology , 2020-2035
  • Figure 136: Europe Market Value Share (%) and BPS Analysis by Technology , 2025-2035
  • Figure 137: Europe Market Y-o-Y Growth (%) Projections by Technology , 2025-2035
  • Figure 138: Europe Market Value (USD Million) Analysis by Application, 2020-2035
  • Figure 139: Europe Market Volume (Units) Analysis by Application, 2020-2035
  • Figure 140: Europe Market Value Share (%) and BPS Analysis by Application, 2025-2035
  • Figure 141: Europe Market Y-o-Y Growth (%) Projections by Application, 2025-2035
  • Figure 142: Europe Market Value (USD Million) Analysis by Distribution Channel, 2020-2035
  • Figure 143: Europe Market Volume (Units) Analysis by Distribution Channel, 2020-2035
  • Figure 144: Europe Market Value Share (%) and BPS Analysis by Distribution Channel, 2025-2035
  • Figure 145: Europe Market Y-o-Y Growth (%) Projections by Distribution Channel, 2025-2035
  • Figure 146: Europe Market Attractiveness by Product Type, 2025-2035
  • Figure 147: Europe Market Attractiveness by Technology , 2025-2035
  • Figure 148: Europe Market Attractiveness by Application, 2025-2035
  • Figure 149: Europe Market Attractiveness by Distribution Channel, 2025-2035
  • Figure 150: Europe Market Attractiveness by Country, 2025-2035
  • Figure 151: East Asia Market Value (USD Million) by Product Type, 2025-2035
  • Figure 152: East Asia Market Value (USD Million) by Technology , 2025-2035
  • Figure 153: East Asia Market Value (USD Million) by Application, 2025-2035
  • Figure 154: East Asia Market Value (USD Million) by Distribution Channel, 2025-2035
  • Figure 155: East Asia Market Value (USD Million) by Country, 2025-2035
  • Figure 156: East Asia Market Value (USD Million) Analysis by Country, 2020-2035
  • Figure 157: East Asia Market Volume (Units) Analysis by Country, 2020-2035
  • Figure 158: East Asia Market Value Share (%) and BPS Analysis by Country, 2025-2035
  • Figure 159: East Asia Market Y-o-Y Growth (%) Projections by Country, 2025-2035
  • Figure 160: East Asia Market Value (USD Million) Analysis by Product Type, 2020-2035
  • Figure 161: East Asia Market Volume (Units) Analysis by Product Type, 2020-2035
  • Figure 162: East Asia Market Value Share (%) and BPS Analysis by Product Type, 2025-2035
  • Figure 163: East Asia Market Y-o-Y Growth (%) Projections by Product Type, 2025-2035
  • Figure 164: East Asia Market Value (USD Million) Analysis by Technology , 2020-2035
  • Figure 165: East Asia Market Volume (Units) Analysis by Technology , 2020-2035
  • Figure 166: East Asia Market Value Share (%) and BPS Analysis by Technology , 2025-2035
  • Figure 167: East Asia Market Y-o-Y Growth (%) Projections by Technology , 2025-2035
  • Figure 168: East Asia Market Value (USD Million) Analysis by Application, 2020-2035
  • Figure 169: East Asia Market Volume (Units) Analysis by Application, 2020-2035
  • Figure 170: East Asia Market Value Share (%) and BPS Analysis by Application, 2025-2035
  • Figure 171: East Asia Market Y-o-Y Growth (%) Projections by Application, 2025-2035
  • Figure 172: East Asia Market Value (USD Million) Analysis by Distribution Channel, 2020-2035
  • Figure 173: East Asia Market Volume (Units) Analysis by Distribution Channel, 2020-2035
  • Figure 174: East Asia Market Value Share (%) and BPS Analysis by Distribution Channel, 2025-2035
  • Figure 175: East Asia Market Y-o-Y Growth (%) Projections by Distribution Channel, 2025-2035
  • Figure 176: East Asia Market Attractiveness by Product Type, 2025-2035
  • Figure 177: East Asia Market Attractiveness by Technology , 2025-2035
  • Figure 178: East Asia Market Attractiveness by Application, 2025-2035
  • Figure 179: East Asia Market Attractiveness by Distribution Channel, 2025-2035
  • Figure 180: East Asia Market Attractiveness by Country, 2025-2035
  • Figure 181: Middle East and Africa Market Value (USD Million) by Product Type, 2025-2035
  • Figure 182: Middle East and Africa Market Value (USD Million) by Technology , 2025-2035
  • Figure 183: Middle East and Africa Market Value (USD Million) by Application, 2025-2035
  • Figure 184: Middle East and Africa Market Value (USD Million) by Distribution Channel, 2025-2035
  • Figure 185: Middle East and Africa Market Value (USD Million) by Country, 2025-2035
  • Figure 186: Middle East and Africa Market Value (USD Million) Analysis by Country, 2020-2035
  • Figure 187: Middle East and Africa Market Volume (Units) Analysis by Country, 2020-2035
  • Figure 188: Middle East and Africa Market Value Share (%) and BPS Analysis by Country, 2025-2035
  • Figure 189: Middle East and Africa Market Y-o-Y Growth (%) Projections by Country, 2025-2035
  • Figure 190: Middle East and Africa Market Value (USD Million) Analysis by Product Type, 2020-2035
  • Figure 191: Middle East and Africa Market Volume (Units) Analysis by Product Type, 2020-2035
  • Figure 192: Middle East and Africa Market Value Share (%) and BPS Analysis by Product Type, 2025-2035
  • Figure 193: Middle East and Africa Market Y-o-Y Growth (%) Projections by Product Type, 2025-2035
  • Figure 194: Middle East and Africa Market Value (USD Million) Analysis by Technology , 2020-2035
  • Figure 195: Middle East and Africa Market Volume (Units) Analysis by Technology , 2020-2035
  • Figure 196: Middle East and Africa Market Value Share (%) and BPS Analysis by Technology , 2025-2035
  • Figure 197: Middle East and Africa Market Y-o-Y Growth (%) Projections by Technology , 2025-2035
  • Figure 198: Middle East and Africa Market Value (USD Million) Analysis by Application, 2020-2035
  • Figure 199: Middle East and Africa Market Volume (Units) Analysis by Application, 2020-2035
  • Figure 200: Middle East and Africa Market Value Share (%) and BPS Analysis by Application, 2025-2035
  • Figure 201: Middle East and Africa Market Y-o-Y Growth (%) Projections by Application, 2025-2035
  • Figure 202: Middle East and Africa Market Value (USD Million) Analysis by Distribution Channel, 2020-2035
  • Figure 203: Middle East and Africa Market Volume (Units) Analysis by Distribution Channel, 2020-2035
  • Figure 204: Middle East and Africa Market Value Share (%) and BPS Analysis by Distribution Channel, 2025-2035
  • Figure 205: Middle East and Africa Market Y-o-Y Growth (%) Projections by Distribution Channel, 2025-2035
  • Figure 206: Middle East and Africa Market Attractiveness by Product Type, 2025-2035
  • Figure 207: Middle East and Africa Market Attractiveness by Technology , 2025-2035
  • Figure 208: Middle East and Africa Market Attractiveness by Application, 2025-2035
  • Figure 209: Middle East and Africa Market Attractiveness by Distribution Channel, 2025-2035
  • Figure 210: Middle East and Africa Market Attractiveness by Country, 2025-2035

Frequently Asked Questions

How big is the Smart Skincare Market in 2025?

The global Smart Skincare Market is estimated to be valued at USD 23.8 billion in 2025.

What will be the size of the Smart Skincare Market in 2035?

The market size for the Smart Skincare Market is projected to reach USD 101.5 billion by 2035.

How much will the Smart Skincare Market grow between 2025 and 2035?

The Smart Skincare Market is expected to grow at a 15.6% CAGR between 2025 and 2035.

What are the key product types in the Smart Skincare Market?

The key product types in the Smart Skincare Market include Smart Facial Cleansing Devices, Smart LED Therapy Masks, AI-Powered Skin Analyzers, Smart Mirrors, Connected Skincare Dispensers, Wearable Skincare Monitors, and App-Based Analysis Tools.

Which product segment will contribute the most in the Smart Skincare Market in 2025?

In terms of product type, Smart Facial Cleansing Devices are expected to lead with a 36.9% share of the Smart Skincare Market in 2025.

Explore Similar Insights

Future Market Insights

Smart Skincare Market