Smart-Tag Inlay Inserters Market Size and Share Forecast Outlook 2025 to 2035

The Smart-Tag Inlay Inserters Market will expand from USD 1.5 billion in 2025 to USD 3.0 billion by 2035 at a CAGR of 7.2%. Increasing demand for RFID and NFC tagging in retail and supply-chain applications is boosting adoption of high-speed inlay insertion equipment. Fully automatic inserters enable precise tag placement for smart packaging authentication and real-time inventory management. Between 2025 and 2030, integration of AI-based positioning and vision systems will enhance accuracy and throughput. Asia-Pacific is poised to lead due to strong manufacturing capability and smart logistics infrastructure growth.

From 2020 to 2024, the rise of digital retail and global traceability requirements accelerated smart tagging automation. Early RFID systems evolved into multi-frequency platforms with BLE and QR integration. By 2035, the market is projected to reach USD 3.0 billion, driven by IoT-enabled track-and-trace solutions across manufacturing and e-commerce. Asia-Pacific will remain dominant in production, while Europe leads in machine design innovation and North America drives data-analytics-based supply visibility.
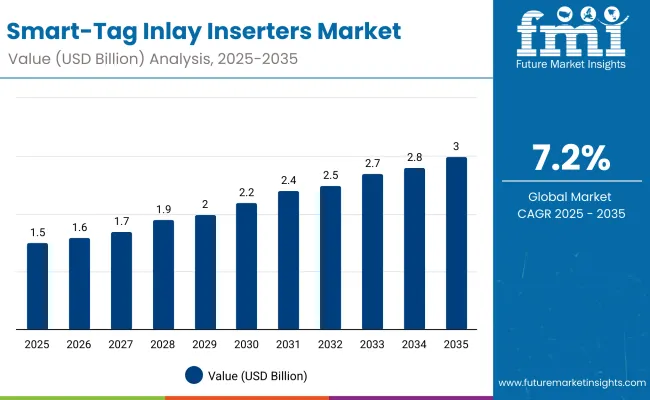
Quick Stats for Smart-Tag Inlay Inserters Market

  • Market Value (2025): USD 1.5 billion
  • Market Forecast Value (2035): USD 3.0 billion
  • Market Forecast CAGR: 7.2%
  • Leading End-Use Industry (2025): Logistics and Supply Chain - 42.3%
  • Key Growth Region: Asia-Pacific (led by South Korea at 7.7% CAGR)
  • Top Companies: Tamarack Products Inc., BW Papersystems, ITEC Equipment GmbH, Saxon Inc., RT Print Technology, Jinguan Technology Co. Ltd, ZBTECH Co. Ltd, Smartrac N.V., Tageos SAS, ID Smart Card Solutions

Smart Tag Inlay Inserters Market

Metric Value
Industry Size (2025E) USD 1.5 billion
Industry Value (2035F) USD 3.0 billion
CAGR (2025 to 2035) 7.2%

Why is the Smart-Tag Inlay Inserters Market Growing?

Growth is propelled by rising demand for automated product identification and authentication systems in logistics and retail. Smart inlay inserters enable precise embedding of RFID and NFC chips within packaging materials, enhancing inventory transparency and anti-counterfeiting measures. The integration of BLE and IoT technologies for real-time monitoring further stimulates equipment investments.

Segmental Overview

The market is segmented by technology, machine type, application, end-use industry, and region. Technologies include RFID, NFC, BLE, and QR/barcode inlay inserters. Machine types cover fully automatic, semi-automatic, and robotic systems. Applications span smart labels and tags, packaging authentication, inventory management, and supply-chain visibility. End-use industries comprise logistics and supply chain, retail and e-commerce, pharmaceuticals and healthcare, and food and beverages.
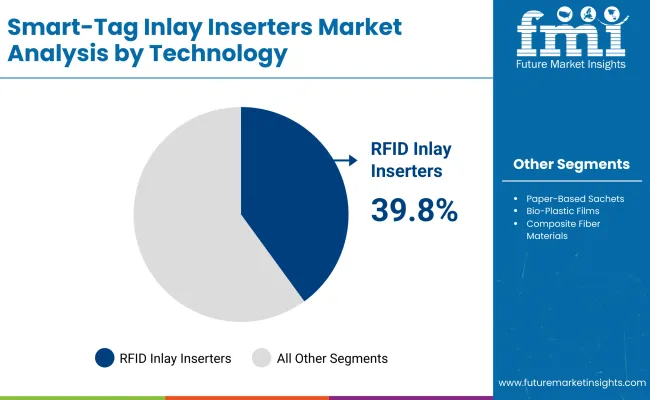
RFID Inlay Inserters Lead Technology with Automation and Tracking Precision

Smart Tag Inlay Inserters Market By Technology

RFID inlay inserters are projected to hold 39.8% of the market in 2025, driven by their pivotal role in global logistics, asset management, and retail automation. These systems ensure high-speed, precise insertion of RFID tags, supporting traceability and data synchronization across complex supply chains.

Their superior tag readability and compatibility with various substrates enhance production efficiency and scalability. As industries accelerate digital transformation, RFID inserters underpin the expansion of connected packaging and real-time inventory visibility, securing their leadership in insertion technology.
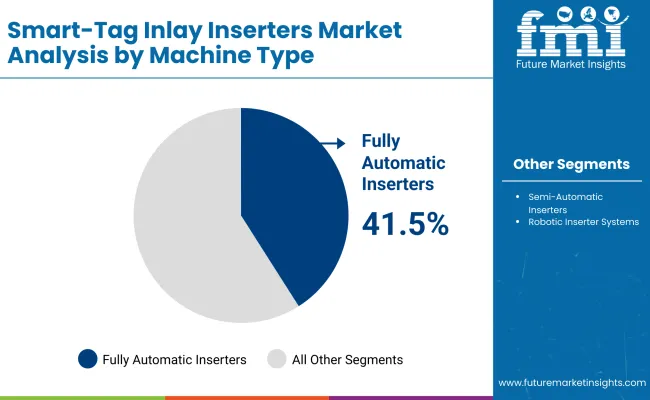
Fully Automatic Inserters Dominate Machine Type with Productivity and Accuracy

Smart Tag Inlay Inserters Market By Machine

Fully automatic inserters are expected to capture 41.5% of the market in 2025, supported by increasing demand for error-free, high-volume operations. These systems combine robotics, vision alignment, and data-driven control for precise tag placement and reduced downtime.

Automation enhances quality assurance and operational consistency across large-scale manufacturing environments. Integration with AI-based diagnostics and cloud connectivity further improves system uptime. As manufacturers modernize smart label production, fully automatic inserters continue to lead adoption.
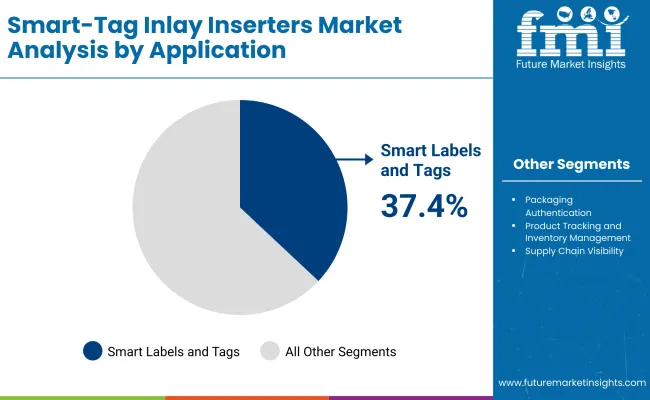
Smart Labels and Tags Lead Applications with Data-Centric Packaging Expansion

Smart Tag Inlay Inserters Market By Application

Smart labels and tags are forecast to represent 37.4% of the market in 2025, reflecting the growing use of embedded identification in logistics, retail, and healthcare. They enable traceability, anti-counterfeiting, and temperature monitoring functions within connected packaging ecosystems.

Manufacturers favor these solutions for supporting transparency and consumer engagement through contactless interactions. With expanding cold-chain and authentication needs, smart labeling continues to dominate the application segment, aligning with global IoT packaging initiatives.
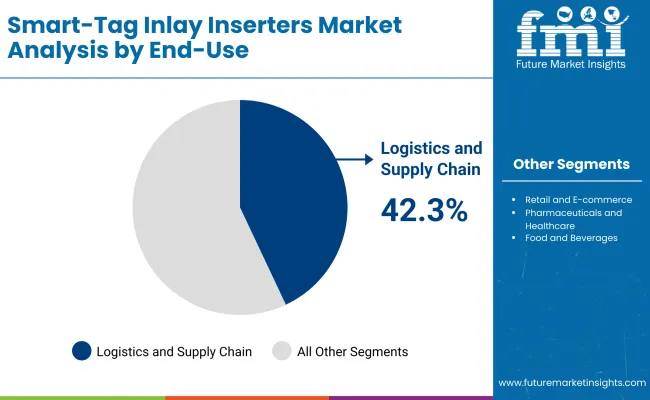
Logistics and Supply Chain Lead End-Use with Automation and Visibility Gains

Smart Tag Inlay Inserters Market By End Use

The logistics and supply-chain segment is projected to hold 42.3% of the market in 2025, fueled by widespread RFID integration in warehouses and fulfillment centers. Automated inlay insertion supports efficient item-level tracking, reducing inventory discrepancies and improving throughput.

Adoption is reinforced by the need for real-time data analytics and smart distribution systems. RFID-enabled infrastructure enhances operational transparency and reduces waste. As global logistics networks digitize, this sector remains the cornerstone of market expansion for smart-tag inserters.

Drivers, Restraints, Opportunities & Key Trends

The market is driven by growing e-commerce volumes and stricter traceability mandates, fueling adoption of smart label automation for efficient logistics and compliance. However, high initial investment in inlay equipment and integration complexities hinder adoption among SMEs. Opportunities emerge with eco-RFID inlays and AI-driven positioning systems creating new revenue pathways. Key trends include robotic tagging cells, modular retrofitting, and hybrid RFID/BLE solutions enhancing connectivity and operational agility.
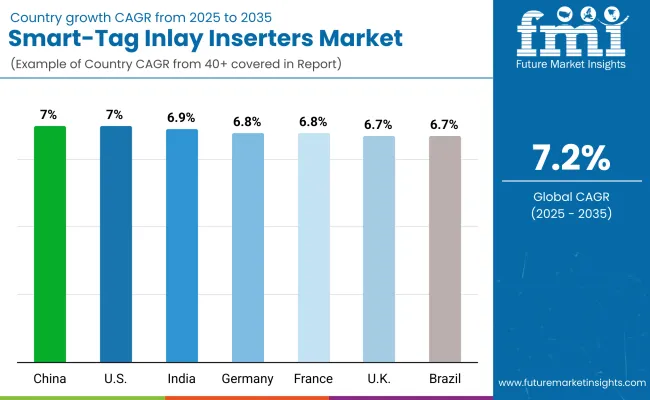
Analysis of Smart-Tag Inlay Inserters Market by Key Countries

Smart Tag Inlay Inserters Market By Country

The global smart-tag inlay inserters market is witnessing strong momentum as automation, RFID analytics, and sustainable data-tracking technologies converge. Asia-Pacific leads due to its manufacturing scale and widespread smart factory deployment, while North America is advancing through RFID-driven logistics optimization and IoT integration. Europe emphasizes sustainability, data security, and traceability compliance in tagging systems. Growing adoption across retail, pharmaceuticals, automotive, and consumer electronics is reshaping global supply-chain visibility and operational efficiency.
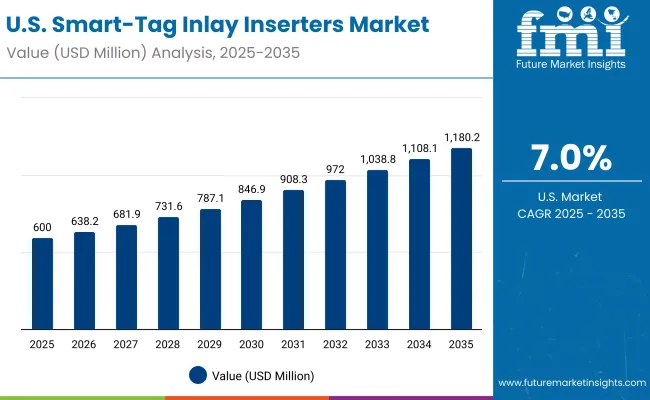
United States Sales Outlook

Smart Tag Inlay Inserters Market Usa

The USA will grow at 7.0% CAGR, driven by retail inventory automation and warehouse optimization initiatives. Adoption of contactless authentication, RFID, and IoT technologies is reshaping supply chain transparency. Collaboration between OEMs and digital analytics platforms supports precision tagging and real-time product tracking. The demand for sustainable RFID solutions is also driving innovation across logistics operations.
  • Expansion of retail inventory tracking and warehouse automation.
  • Strong focus on contactless authentication and IoT integration.
  • Partnerships between equipment OEMs and RFID platforms accelerate adoption.

Germany Growth Outlook

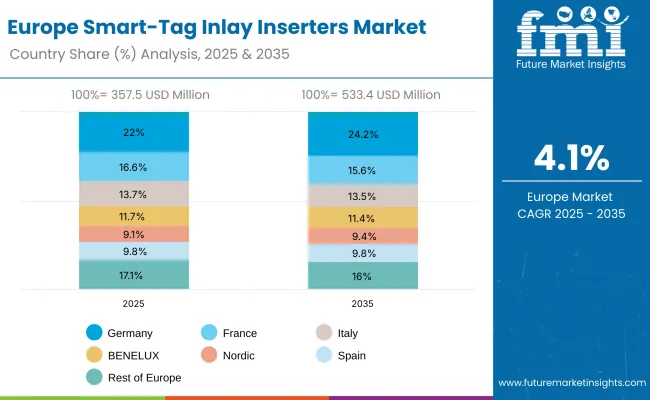
Smart Tag Inlay Inserters Market Europe

Germany will expand at 6.8% CAGR, supported by automation upgrades in industrial packaging and logistics. Energy-efficient and sustainable inlay integration systems are aligning with EU green technology mandates. Increased adoption in automotive traceability and manufacturing optimization reinforces demand for advanced RFID-enabled machinery.

  • Automation upgrades in industrial packaging and logistics.
  • Sustainability and energy-efficient tag integration systems.
  • Adoption in automotive supply chain traceability.

United Kingdom Expansion Outlook

The UK will grow at 6.9% CAGR, led by e-commerce automation and regulatory digital compliance in labeling. Retailers and logistics providers are investing in smart RFID infrastructure to enhance fulfillment accuracy. Pharma sector adoption of NFC and smart-tag tracking supports serialization and safety compliance.

  • Growth in e-commerce fulfillment automation.
  • Investments in smart retail labeling infrastructure.
  • Increased RFID/NFC use in pharma compliance.

China Sales Outlook

China will grow at 7.0% CAGR, underpinned by large-scale RFID manufacturing and logistics digitalization. Expanding production of industrial grade tagging systems supports rapid deployment in asset management and inventory control. Government-led digital supply chain initiatives continue to strengthen local competitiveness in RFID equipment exports.

  • Expansion of industrial RFID equipment manufacturing.
  • High deployment in logistics and asset management.
  • Government support for digital tracking initiatives.

India Growth Outlook

India will grow at 6.9% CAGR, supported by the digitization of supply chains across retail, healthcare, and pharmaceuticals. Local production of cost-effective inlays is enhancing accessibility for domestic manufacturers. Automation in export-oriented packaging and logistics sectors is further accelerating smart-tag adoption nationwide.

  • Digitization of supply chains across retail and pharma.
  • Cost-effective inlay production enhances local competitiveness.
  • Automation adoption in export-oriented industries rises.

Japan Outlook

Japan will grow at 7.6% CAGR, driven by high-end NFC, BLE, and robotic tagging technologies. Advanced micro-precision insertion systems are being integrated into consumer electronics and packaging applications. Continued miniaturization and intelligent data-linking enhance efficiency in RFID tagging across multiple industrial verticals.

  • Advanced NFC and BLE tag insertion technologies.
  • Integration of robotic systems for micro-precision tagging.
  • High penetration in consumer electronics packaging.

South Korea Expansion Outlook

South Korea will lead with 7.7% CAGR, propelled by AI-linked RFID systems and IoT-based logistics automation. Smart factory initiatives and government-backed digital transformation programs strengthen local innovation. Integration of cloud analytics in inlay operations enhances production efficiency and sustainability.
  • Smart logistics modernization and AI-linked RFID systems.
  • Expansion of IoT manufacturing automation lines.
  • Government-supported smart-factory initiatives sustain growth.

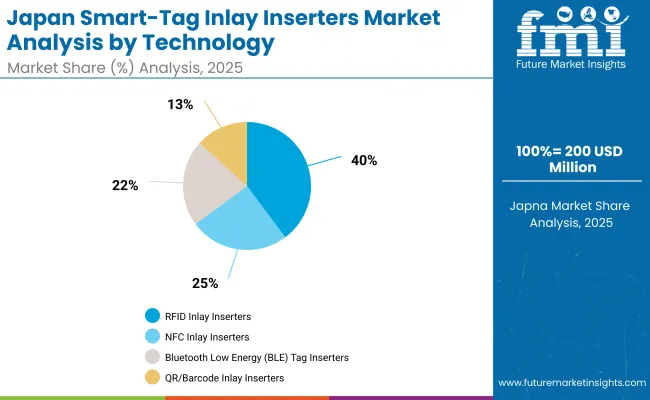
Japan Smart-Tag Inlay Inserters Market by Technology

Smart Tag Inlay Inserters Market Japan

Japan’s smart-tag inlay inserters market, valued at USD 200.0 million in 2025, is dominated by RFID inlay inserters, holding a 41.6% share due to widespread use in logistics, apparel, and consumer goods packaging. NFC inlay inserters are advancing contactless retail tracking, while BLE tag inserters enhance real-time asset monitoring. QR/barcode inserters remain key for cost-effective labeling in mass packaging.
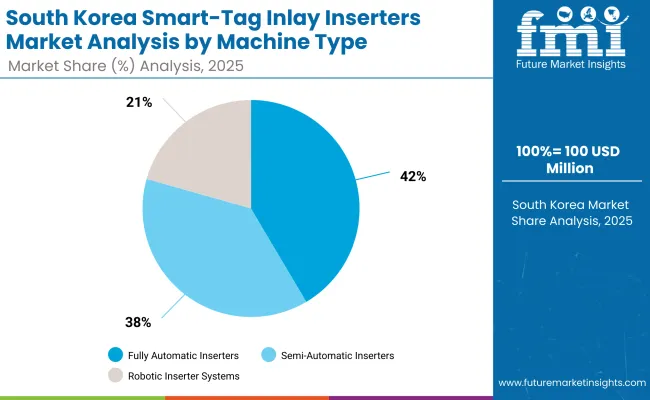
South Korea Smart-Tag Inlay Inserters Market by Machine

Smart Tag Inlay Inserters Market South Korea

South Korea’s smart-tag inlay inserters market, worth USD 100.0 million in 2025, is led by fully automatic inserters, accounting for 40.6% share owing to faster throughput and reduced human error. Semi-automatic inserters cater to mid-scale operations, while robotic inserter systems gain traction for precision placement in flexible electronics, security tagging, and IoT-enabled packaging applications.
Competitive Landscape

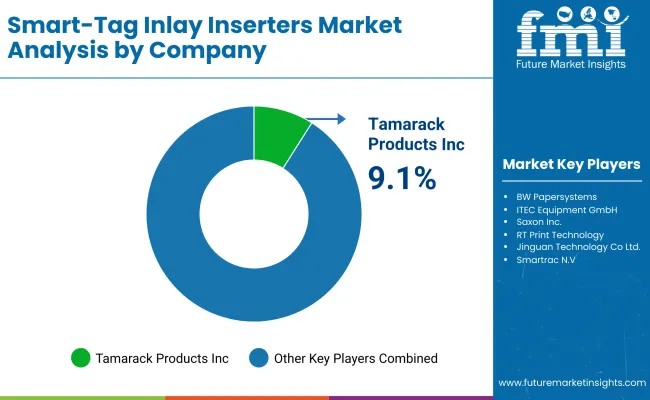
Smart Tag Inlay Inserters Market By Company

The market is moderately consolidated with major players including Tamarack Products Inc., BW Papersystems, ITEC Equipment GmbH, Saxon Inc., RT Print Technology, Jinguan Technology Co. Ltd, ZBTECH Co. Ltd, Smartrac N.V., Tageos SAS, and ID Smart Card Solutions. Companies focus on high-precision automation, energy-efficient systems, and integrated data management software.

Key Developments

  • In 2024, Smartrac N.V. launched eco-friendly RFID inlay solutions using paper-based substrates to reduce plastic waste.
  • In 2023, Tamarack Products Inc. introduced a modular RFID inserter platform compatible with BLE and NFC technologies for multi-line operations.

Key Companies

  • Tamarack Products Inc.
  • BW Papersystems
  • ITEC Equipment GmbH
  • Saxon Inc.
  • RT Print Technology
  • Jinguan Technology Co., Ltd.
  • ZBTECH Co., Ltd.
  • Smartrac N.V.
  • Tageos SAS
  • ID Smart Card Solutions

Scope of the Report

Item Value
Quantitative Units USD 1.5 Billion (2025 baseline)
By Technology RFID, NFC, BLE, QR/Barcode Inlay Inserters
By Machine Type Fully Automatic, Semi-Automatic, Robotic Inserters
By Application Smart Labels & Tags, Authentication, Inventory Tracking, Supply Visibility
By End-Use Industry Logistics & Supply Chain, Retail & E-commerce, Pharma & Healthcare, Food & Beverages
Key Companies Profiled Tamarack Products Inc., BW Papersystems, ITEC Equipment GmbH, Smartrac N.V., Tageos SAS, ID Smart Card Solutions
Additional Attributes Market driven by IoT-enabled automation and eco-RFID adoption

Key Segmentation

By Technology:

  • RFID Inlay Inserters
  • NFC Inlay Inserters
  • Bluetooth Low Energy (BLE) Tag Inserters
  • QR/Barcode Inlay Inserters

By Machine Type:

  • Fully Automatic Inserters
  • Semi-Automatic Inserters
  • Robotic Inserter Systems

By Application:

  • Smart Labels and Tags
  • Packaging Authentication
  • Product Tracking and Inventory Management
  • Supply Chain Visibility

By End-Use Industry:

  • Logistics and Supply Chain
  • Retail and E-commerce
  • Pharmaceuticals and Healthcare
  • Food and Beverages

By Region:

  • North America
  • Europe
  • Asia-Pacific
  • Latin America
  • Middle East & Africa

Frequently Asked Questions

What is the market size of the Smart-Tag Inlay Inserters Market in 2025?

The Smart-Tag Inlay Inserters Market is valued at USD 1.5 billion in 2025.

What will be the market size by 2035?

The market is projected to reach USD 3.0 billion by 2035.

What is the CAGR for 2025-2035?

The market will grow at a CAGR of 7.2 % during the forecast period.

Which technology segment leads the market in 2025?

RFID Inlay Inserters lead with a 39.8 % share in 2025, driven by high-speed tracking capabilities and supply-chain automation.

Who are the key companies in the Smart-Tag Inlay Inserters Market?

Key companies include Tamarack Products Inc., BW Papersystems, ITEC Equipment GmbH, Smartrac N.V., Tageos SAS, and ID Smart Card Solutions, all focusing on automation and eco-RFID integration.

Table of Content

  1. Executive Summary
  2. Industry Introduction, including Taxonomy and Market Definition
  3. Smart-Tag Inlay Inserters Market Trends and Success Factors, including Macro-economic Factors, Market Dynamics, and Recent Industry Developments
  4. Global Market Demand Analysis 2020 to 2024 and Forecast 2025 to 2035, including Historical Analysis and Future Projections
  5. Pricing Analysis
  6. Global Market Analysis 2020 to 2024 and Forecast 2025 to 2035
    • Technology
    • Machine Type
    • Application
    • End-Use Industry
  7. Global Market Analysis 2020 to 2024 and Forecast 2025 to 2035, By Technology
    • RFID Inlay Inserters
    • NFC Inlay Inserters
    • Bluetooth Low Energy (BLE) Tag Inserters
    • QR/Barcode Inlay Inserters
  8. Global Market Analysis 2020 to 2024 and Forecast 2025 to 2035, By Machine Type
    • Fully Automatic Inserters
    • Semi-Automatic Inserters
    • Robotic Inserter Systems
  9. Global Market Analysis 2020 to 2024 and Forecast 2025 to 2035, By Application
    • Smart Labels and Tags
    • Packaging Authentication
    • Product Tracking and Inventory Management
    • Supply Chain Visibility
  10. Global Market Analysis 2020 to 2024 and Forecast 2025 to 2035, By End-Use Industry
    • Logistics and Supply Chain
    • Retail and E-commerce
    • Pharmaceuticals and Healthcare
    • Food and Beverages
  11. Global Market Analysis 2020 to 2024 and Forecast 2025 to 2035, By Region
    • North America
    • Latin America
    • Europe
    • East Asia
    • South Asia
    • Middle East & Africa
  12. North America Sales Analysis 2020 to 2024 and Forecast 2025 to 2035, by Key Segments and Countries
  13. Latin America Sales Analysis 2020 to 2024 and Forecast 2025 to 2035, by Key Segments and Countries
  14. Europe Sales Analysis 2020 to 2024 and Forecast 2025 to 2035, by Key Segments and Countries
  15. East Asia Sales Analysis 2020 to 2024 and Forecast 2025 to 2035, by Key Segments and Countries
  16. South Asia Sales Analysis 2020 to 2024 and Forecast 2025 to 2035, by Key Segments and Countries
  17. Middle East & Africa Sales Analysis 2020 to 2024 and Forecast 2025 to 2035, by Key Segments and Countries
  18. Sales Forecast 2025 to 2035 by Technology, Machine Type, Application, End-Use Industry, 0, 0, and 0 for 30 Countries
  19. Competition Outlook, including Market Structure Analysis, Company Share Analysis by Key Players, and Competition Dashboard
  20. Company Profile
    • Tamarack Products Inc.
    • BW Papersystems
    • ITEC Equipment GmbH
    • Saxon Inc.
    • RT Print Technology
    • Jinguan Technology Co., Ltd.
    • ZBTECH Co., Ltd.
    • Smartrac N.V.
    • Tageos SAS
    • ID Smart Card Solutions

List of Tables

  • Table 1: Global Market Value (USD Billion) & Units Forecast by Region, 2020-2035
  • Table 2: Global Market Value (USD Billion) & Units Forecast by Technology, 2020-2035
  • Table 3: Global Market Value (USD Billion) & Units Forecast by Machine Type, 2020-2035
  • Table 4: Global Market Value (USD Billion) & Units Forecast by Application, 2020-2035
  • Table 5: Global Market Value (USD Billion) & Units Forecast by End-Use Industry, 2020-2035
  • Table 6: North America Market Value (USD Billion) & Units Forecast by Country, 2020-2035
  • Table 7: North America Market Value (USD Billion) & Units Forecast by Technology, 2020-2035
  • Table 8: North America Market Value (USD Billion) & Units Forecast by Machine Type, 2020-2035
  • Table 9: North America Market Value (USD Billion) & Units Forecast by Application, 2020-2035
  • Table 10: North America Market Value (USD Billion) & Units Forecast by End-Use Industry, 2020-2035
  • Table 11: Latin America Market Value (USD Billion) & Units Forecast by Country, 2020-2035
  • Table 12: Latin America Market Value (USD Billion) & Units Forecast by Technology, 2020-2035
  • Table 13: Latin America Market Value (USD Billion) & Units Forecast by Machine Type, 2020-2035
  • Table 14: Latin America Market Value (USD Billion) & Units Forecast by Application, 2020-2035
  • Table 15: Latin America Market Value (USD Billion) & Units Forecast by End-Use Industry, 2020-2035
  • Table 16: Europe Market Value (USD Billion) & Units Forecast by Country, 2020-2035
  • Table 17: Europe Market Value (USD Billion) & Units Forecast by Technology, 2020-2035
  • Table 18: Europe Market Value (USD Billion) & Units Forecast by Machine Type, 2020-2035
  • Table 19: Europe Market Value (USD Billion) & Units Forecast by Application, 2020-2035
  • Table 20: Europe Market Value (USD Billion) & Units Forecast by End-Use Industry, 2020-2035
  • Table 21: East Asia Market Value (USD Billion) & Units Forecast by Country, 2020-2035
  • Table 22: East Asia Market Value (USD Billion) & Units Forecast by Technology, 2020-2035
  • Table 23: East Asia Market Value (USD Billion) & Units Forecast by Machine Type, 2020-2035
  • Table 24: East Asia Market Value (USD Billion) & Units Forecast by Application, 2020-2035
  • Table 25: East Asia Market Value (USD Billion) & Units Forecast by End-Use Industry, 2020-2035
  • Table 26: South Asia Market Value (USD Billion) & Units Forecast by Country, 2020-2035
  • Table 27: South Asia Market Value (USD Billion) & Units Forecast by Technology, 2020-2035
  • Table 28: South Asia Market Value (USD Billion) & Units Forecast by Machine Type, 2020-2035
  • Table 29: South Asia Market Value (USD Billion) & Units Forecast by Application, 2020-2035
  • Table 30: South Asia Market Value (USD Billion) & Units Forecast by End-Use Industry, 2020-2035
  • Table 31: Middle East & Africa Market Value (USD Billion) & Units Forecast by Country, 2020-2035
  • Table 32: Middle East & Africa Market Value (USD Billion) & Units Forecast by Technology, 2020-2035
  • Table 33: Middle East & Africa Market Value (USD Billion) & Units Forecast by Machine Type, 2020-2035
  • Table 34: Middle East & Africa Market Value (USD Billion) & Units Forecast by Application, 2020-2035
  • Table 35: Middle East & Africa Market Value (USD Billion) & Units Forecast by End-Use Industry, 2020-2035

List of Figures

  • Figure 1: Global Market Value Share (%), Growth Rate (Y-o-Y), and Value (USD Billion) & Units Projection by Technology, 2020-2035
  • Figure 2: Global Market Value Share (%), Growth Rate (Y-o-Y), and Value (USD Billion) & Units Projection by Machine Type, 2020-2035
  • Figure 3: Global Market Value Share (%), Growth Rate (Y-o-Y), and Value (USD Billion) & Units Projection by Application, 2020-2035
  • Figure 4: Global Market Value Share (%), Growth Rate (Y-o-Y), and Value (USD Billion) & Units Projection by End-Use Industry, 2020-2035
  • Figure 5: Global Market Value Share (%), Growth Rate (Y-o-Y), and Value (USD Billion) & Units Projection by Region, 2020-2035
  • Figure 6: North America Market Value Share (%), Growth Rate (Y-o-Y), and Value (USD Billion) & Units Projection by Technology, 2020-2035
  • Figure 7: North America Market Value Share (%), Growth Rate (Y-o-Y), and Value (USD Billion) & Units Projection by Machine Type, 2020-2035
  • Figure 8: North America Market Value Share (%), Growth Rate (Y-o-Y), and Value (USD Billion) & Units Projection by Application, 2020-2035
  • Figure 9: North America Market Value Share (%), Growth Rate (Y-o-Y), and Value (USD Billion) & Units Projection by End-Use Industry, 2020-2035
  • Figure 10: North America Market Value Share (%), Growth Rate (Y-o-Y), and Value (USD Billion) & Units Projection by Country, 2020-2035
  • Figure 11: Latin America Market Value Share (%), Growth Rate (Y-o-Y), and Value (USD Billion) & Units Projection by Technology, 2020-2035
  • Figure 12: Latin America Market Value Share (%), Growth Rate (Y-o-Y), and Value (USD Billion) & Units Projection by Machine Type, 2020-2035
  • Figure 13: Latin America Market Value Share (%), Growth Rate (Y-o-Y), and Value (USD Billion) & Units Projection by Application, 2020-2035
  • Figure 14: Latin America Market Value Share (%), Growth Rate (Y-o-Y), and Value (USD Billion) & Units Projection by End-Use Industry, 2020-2035
  • Figure 15: Latin America Market Value Share (%), Growth Rate (Y-o-Y), and Value (USD Billion) & Units Projection by Country, 2020-2035
  • Figure 16: Europe Market Value Share (%), Growth Rate (Y-o-Y), and Value (USD Billion) & Units Projection by Technology, 2020-2035
  • Figure 17: Europe Market Value Share (%), Growth Rate (Y-o-Y), and Value (USD Billion) & Units Projection by Machine Type, 2020-2035
  • Figure 18: Europe Market Value Share (%), Growth Rate (Y-o-Y), and Value (USD Billion) & Units Projection by Application, 2020-2035
  • Figure 19: Europe Market Value Share (%), Growth Rate (Y-o-Y), and Value (USD Billion) & Units Projection by End-Use Industry, 2020-2035
  • Figure 20: Europe Market Value Share (%), Growth Rate (Y-o-Y), and Value (USD Billion) & Units Projection by Country, 2020-2035
  • Figure 21: East Asia Market Value Share (%), Growth Rate (Y-o-Y), and Value (USD Billion) & Units Projection by Technology, 2020-2035
  • Figure 22: East Asia Market Value Share (%), Growth Rate (Y-o-Y), and Value (USD Billion) & Units Projection by Machine Type, 2020-2035
  • Figure 23: East Asia Market Value Share (%), Growth Rate (Y-o-Y), and Value (USD Billion) & Units Projection by Application, 2020-2035
  • Figure 24: East Asia Market Value Share (%), Growth Rate (Y-o-Y), and Value (USD Billion) & Units Projection by End-Use Industry, 2020-2035
  • Figure 25: East Asia Market Value Share (%), Growth Rate (Y-o-Y), and Value (USD Billion) & Units Projection by Country, 2020-2035
  • Figure 26: South Asia Market Value Share (%), Growth Rate (Y-o-Y), and Value (USD Billion) & Units Projection by Technology, 2020-2035
  • Figure 27: South Asia Market Value Share (%), Growth Rate (Y-o-Y), and Value (USD Billion) & Units Projection by Machine Type, 2020-2035
  • Figure 28: South Asia Market Value Share (%), Growth Rate (Y-o-Y), and Value (USD Billion) & Units Projection by Application, 2020-2035
  • Figure 29: South Asia Market Value Share (%), Growth Rate (Y-o-Y), and Value (USD Billion) & Units Projection by End-Use Industry, 2020-2035
  • Figure 30: South Asia Market Value Share (%), Growth Rate (Y-o-Y), and Value (USD Billion) & Units Projection by Country, 2020-2035
  • Figure 31: Middle East & Africa Market Value Share (%), Growth Rate (Y-o-Y), and Value (USD Billion) & Units Projection by Technology, 2020-2035
  • Figure 32: Middle East & Africa Market Value Share (%), Growth Rate (Y-o-Y), and Value (USD Billion) & Units Projection by Machine Type, 2020-2035
  • Figure 33: Middle East & Africa Market Value Share (%), Growth Rate (Y-o-Y), and Value (USD Billion) & Units Projection by Application, 2020-2035
  • Figure 34: Middle East & Africa Market Value Share (%), Growth Rate (Y-o-Y), and Value (USD Billion) & Units Projection by End-Use Industry, 2020-2035
  • Figure 35: Middle East & Africa Market Value Share (%), Growth Rate (Y-o-Y), and Value (USD Billion) & Units Projection by Country, 2020-2035
Dashboard
Dashboard
Dashboard
Dashboard
Dashboard
Dashboard

Full Research Suite comprises of:

Market outlook & trends analysis

Market outlook & trends analysis

Interviews & case studies

Interviews & case studies

Strategic recommendations

Strategic recommendations

Vendor profiles & capabilities analysis

Vendor profiles & capabilities analysis

5-year forecasts

5-year forecasts

8 regions and 60+ country-level data splits

8 regions and 60+ country-level data splits

Market segment data splits

Market segment data splits

12 months of continuous data updates

12 months of continuous data updates

DELIVERED AS:

PDF EXCEL ONLINE

Full Research Suite


$5000

$7500

$10000

Buy Report Now
Similar Industry Reports

Similar Industry Reports

Inlay Paper Market
Inlay Paper Market

Inlay Paper Market Growth – Demand, Innovations & Outlook 2025 to 2035

Future Market Insights

Smart-Tag Inlay Inserters Market

Chat With MaRIA

Chat With

MaRIA

Hi There, I am MaRIA, Your Market Research Intelligence Assistant. How may I help you?