Smart Wheelchair Market
Market Insights on Smart Wheelchair covering sales outlook, demand forecast & up-to-date key trends
Smart Wheelchair Market by Product, Patient, End User & Region - Forecast 2022 – 2032
Smart Wheelchair Market Snapshot (2022-2032)
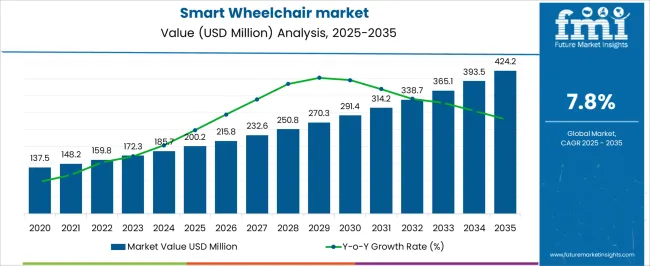
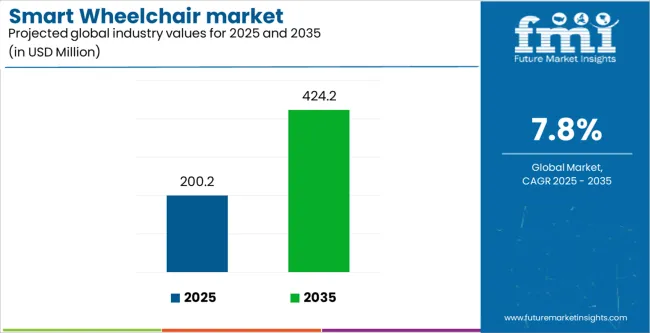
[322 Pages Report] The global smart wheelchair market was valued at an approximate value of US$ 150.8 Mn in 2021 and would expand at a CAGR of 7.8% over the forecast period (2022-2032). According to the study conducted by Future Market Insights, by product segment joystick based smart wheelchairs dominate the market with a share of 85.0%, in the global market in 2021.
Market Outlook:
Data Points |
Market Insights |
Market Value 2021 |
US$ 150.8 Mn |
Market Value 2022 |
US$ 162.6 Mn |
Market Value 2032 |
US$ 344.5 Mn |
CAGR 2022-2032 |
7.8% |
Market Share of Top 5 Countries |
48.7% |
Key Market Players |
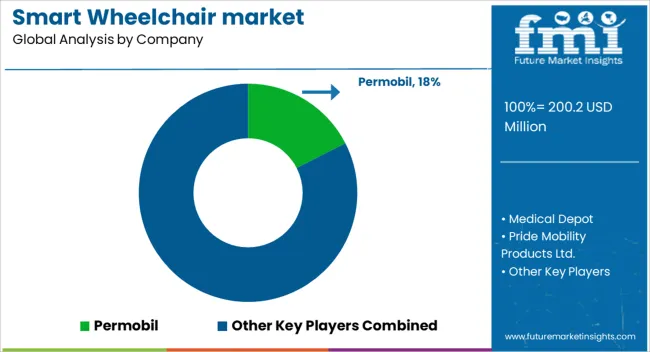
Medical Depot, Inc., Permobil AB, Pride Mobility Products Ltd., MEYRA GmbH, DEKA Research & Development Corp., tmsuk company limited, Ottobock, WHILL Inc., Invacare Corporation, Karman Healthcare, Inc. |
The smart wheelchair market holds approximately 5.8% of the global mobility aids and transportation equipment market, which is estimated to be valued at US$ 2.6 Bn by the end of 2021.
One of the primary factors driving the growth of the global smart wheelchair market is the rising volumes of the geriatric age population group. According to the 2019 revision by the World Population Prospects, by 2050, it is expected that one in every six people in the world is expected to be over the age of 65 by 20250, accounting for about 16% of the global population base, as compared to the 2019 metrics, wherein one in every 11 people over the globe belonged to the age group of 65 and above, amounting for about 9% of the global population.
Let us know your requirement to get
100% FREE customization
Sales Analysis of Smart Wheelchair from 2017 to 2021 Vs Market Outlook 2022 to 2032
The sales of smart wheelchairs grew at a gradual pace during the period of 2017 to 2021, mainly due to the rising demand for these products, which can be attributed to the rising cases of physical disabilities, both temporary and permanent.
The high rates of road traffic accidents are another key factor for the growing need for smart wheelchairs around the world. According to India's Ministry of Road Transport and Highways, States and Union Territories (UTs) reported a total of 4,49,002 road accidents in the calendar year 2019, with 1.5 lakh people killed and 4.5 lakh people injured.
The geriatric population is likely to suffer from limited mobility conditions. The rising prevalence of knee injuries, strokes, paralysis, and obesity are some of the major factors leading to mobility-related ailments, especially in elder individuals.
In addition, the rise in the incidence of people with physical impairments, the increasing popularity of home healthcare, and overall growth in the number of road traffic accidents leading to limited mobility are some of the major factors driving the demand for smart wheelchairs globally.
Technological advancements in the field of patient care, home care, assisted living, elder care products and services, for effective patient management are taking precedence over the past few years. Thus, innovations in the field of smart wheelchairs are heartily welcomed by the end users, globally.
Industry-developed Information and Communication Technologies (ICT) tools are applied to systems and processes to provide customised solutions. The incorporation of wireless and sensor technologies has resulted in new and improved assistive technology designs. People with severe disability or paralysis can use these assistive technologies to interact and communicate with other industry-developed devices including televisions, radios, computers, laptops, and tablets. The goal is to allow a person with severe disability to undertake minimal activities employing their remaining capabilities.
With enhancements within the technological space, as well as the incorporation of robotics and AI within the conventional medical equipment, such as wheelchairs, the growth of the global smart wheelchair market is expected to be at a CAGR of 7.8% over the forecast period (2022-2032).
What are the Key Opportunities for the Manufacturers of Smart Wheelchairs?
With the growing number of senior citizens and those with physical disabilities, smart wheelchair navigation assistance has a wide range of applications. Accidents, ageing, and diseases such as cerebral palsy and spinal cord injuries are all contributing to an increase in the number of disabled individuals, who now number 1 billion people or 15% of the global population.
Several cutting-edge techniques and capabilities have been developed in recent years to assist those with limited mobility. Low-cost processors and sensors have aided with this rising trend toward developing intelligence-based systems. A positive attitude towards smart gadgets, wearable devices, artificial intelligence, and machine learning can attract more people to opt for power wheelchairs and this is expected to display growth opportunities for smart wheelchair market players.
The advantages of upgrading and enhancing assistive technology are manifold. However, expanding accessibility for people with disabilities (PWD) in order to secure their social and economic inclusion is among the most pressing issues in recent years. With the growing emphasis on the research and development of sensors, the Internet of Things is expected to create immense growth opportunities in the market. The growing interest of the robotics industry in the development of software and models for various patients with mobility-related issues will further expand the pipeline for product development.
- For instance, in December 2021, IRIS a European SME specialising in developing innovative technologies received HORIZON EU funding for developing an app, which can enable a manual wheelchair to be automatically driven. The product is based on the mechanism of combining electric power with autonomous driving and a flexible design compatible with any wheelchair.
These factors are set to promote the growth of the global smart wheelchair market throughout the forecasted period.
Find your sweet spots for generating winning opportunities in this market.
Talk to AnalystWhat are the Factors Restraining the Demand for Smart wheelchairs?
Smart wheelchairs are a luxury product. The availability of alternative options to mobility assistance, such as manual wheelchairs, whose maintenance costs are low, has further impeded the sales of smart wheelchairs. Thus, the selection of cost-effective and low maintenance alternatives can also restrain the demand for the smart wheelchair market.
Furthermore, the instances of maintenance as well as malfunctioning of smart wheelchairs is a major cause of concern and risk for patients with moving disorders. The adoption of a particular mobility aid device depends upon the patient’s requirements and will be customized as per patient needs. This also includes the field of requirements, such as physical and social environment and climatic conditions. With differentiated patient needs, there is a heavy cost associated with custom support and modification.
Patients may also display a high level of comfort associated with the use of manual wheelchairs, often to a point where their usage may be seen as “limb objects”, directing the utility of manual wheelchair as a natural element of the body, and hence, an extended limb. This factor, combined with the above-mentioned aspects functions as impeding aspects influencing the restrictive market growth for smart wheelchairs.
Country-Wise Insights
What Makes the U.S., the Largest Market for Smart Wheelchairs?
The U.S. market for smart wheelchairs recorded sales worth 30.0% of the global market share by the end of 2021. This accounts for 80.0% of market share, by revenue in the North American region.
As per the U.S. CDC, approximately 61 million adults in the United States have some form of disability, representing roughly 24% of the total population. With such a massive population, there is a potential for increased smart wheelchair sales in the region.
Moreover, the established federal reimbursement plans, as well as the inclusion of disability criteria within the healthcare structure have further prompted the demand for sales of smart wheelchairs within the country. There are several reimbursement plans for assistive mobility aids and tools for individuals falling under the governance of the Americans with Disabilities Act. Thus, the adoption and management of assistive devices such as smart wheelchairs within the country are set to promote the growth of the overall global smart wheelchair market.
What makes U.K. the Most Lucrative Market for Smart Wheelchairs in Europe?
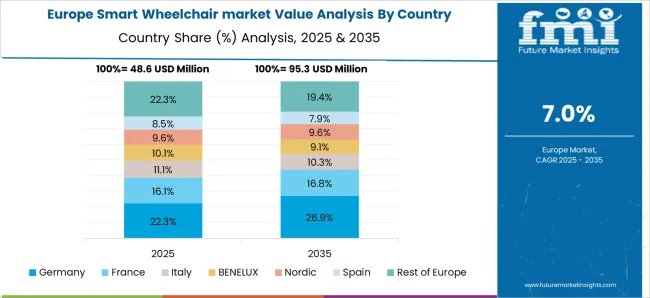
In 2021, the U.K. market for smart wheelchairs took up to 12.6% of the market value share of the overall European smart wheelchair market. The country amounts to about 2.8% of the overall global market value for smart wheelchairs in the year 2021.
According to the statistics published by the department of work and pensions in U.K., there are about 11.6 million disabled people in U.K., with the most commonly reported disabilities being the ones which affect mobility, lifting and carrying. To carry out daily activities, these persons will require both assistive devices and rehabilitation (ADL). When it comes to assistive technologies, there are two major issues:
- People do not have access to the equipment they require, and
- The devices are usually abandoned.
Only 5–15 % of the 70 million people who use a wheelchair, according to the WHO, have access to one. The majority of these people live in low-income nations, although others live in higher-income countries but lack the financial resources to obtain the assistive technology they need to fulfil their daily activities. This makes U.K. a lucrative industry for the smart wheelchair market, owing to the growth of necessitated factors urging the need for increased adoption.

An unified Market Research Subscription Platform, built for today’s disparate research needs.
What Makes China an Emerging Market for Smart Wheelchairs?
China holds a market share of 49.9%, by revenue in the East Asian smart wheelchair market in 2021. The sales of smart wheelchairs in China accounted for 7.1% of the overall market value for the global smart wheelchair market in 2021.
China is one of the countries with the fastest-growing geriatric population in the world. Approximately 17% of the Chinese population was above 60 years of age in the year 2020. Growing adoption of automated systems and the integration of technologies such as autonomous navigation software for real-time navigation of smart wheelchairs in the country have propelled the sales of the global smart wheelchair market.
Owing to the large population base within the region falling under the old age group, these assistive devices come with terrain perception to minimize fall risks, thus acting as a key driver for the growth of small wheelchair adoption in China.
Category-wise Insights
Which Wheelchairs would Dominate the Smart Wheelchair Market?
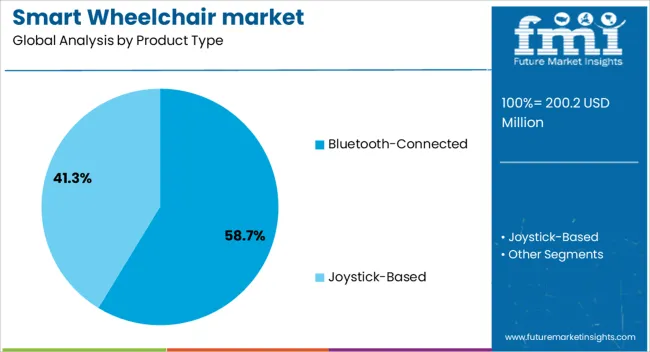
The joystick based smart wheelchairs account for a higher market share value of about 85.0%, by revenue during the year 2021. The technology of joystick based smart wheelchairs has been undergoing gradual developments to enhance patient mobility. For instance, patients with cerebral palsy may not be quite adaptive to the navigation assistance provided by standard joystick based smart wheelchairs, leading to the generation of unmet needs for safe travel.
Thus, advances within the joystick based smart wheelchairs, such as the concurrent deployment of an artificial intelligence device for assistive mobility, have gained traction, thus promoting the overall market sales of the global smart wheelchair market.
In Terms of Usage, Which Smart Wheelchair Application Area is Leading Globally?
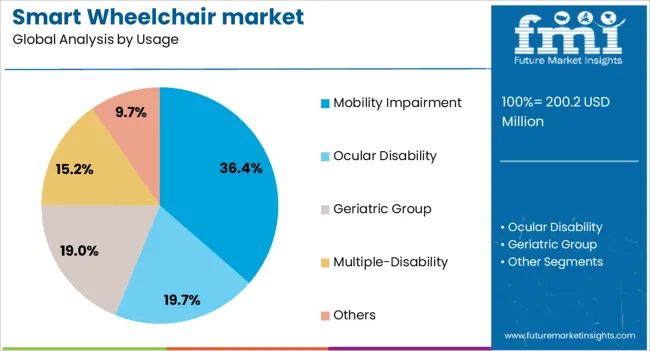
Patients with mobility impairment adopt smart wheelchairs for their daily life functions, globally. Mobility impairment accounts for about 45.0% share, by revenue amongst others, in the year 2021 and is expected to follow a similar trend over the forecast period (2022-2032), with a CAGR growth value amounting to 7.2%.
With the emergence of smart health care and assistive mobility, patients suffering from mobility impairment can transmit daily or weekly data concerning their blood pressure and other critical vitals for essential aid from their physicians. Moreover, gaining traction in the integration of the Internet of Medical Things (IoMT) within automated healthcare systems for expansive data monitoring and assessment of patients with a mobility impairment has provided accommodation to patients who would otherwise find it difficult to operate standard mobility devices.
Which End-Users are Likely to Employ the Maximum use of Smart Wheelchair?
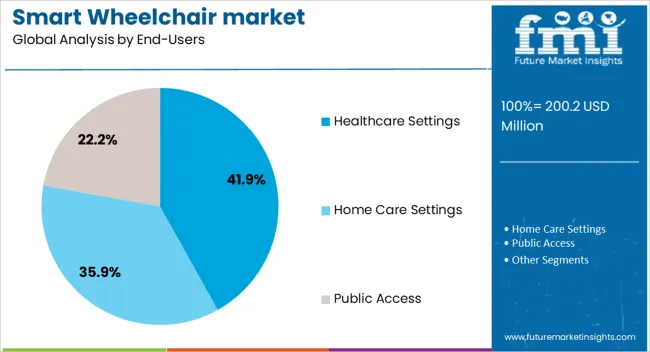
The healthcare settings are expected to employ the maximum use of the smart wheelchairs, accounting for 48.0% of market share, by revenue in the year 2021. Smart wheelchairs are a beneficial mode of patient transportation across a medical or healthcare setting. The assistance provided by smart wheelchair equipment in healthcare settings will reduce the cost of caregiver attention to the patient, thus providing reliable outcomes.
Competitive Landscape
Key players in the smart wheelchair industry are focusing on acquisitions to strengthen their market presence and expand into the global market. Keeping their sustainable development goals in mind, the companies also promote new product launches with the incorporation of an array of patient requirements.
For instance:
- In February 2022, Ottobock announced the acquisition of Livit B.V., leading patient care providers in the Netherlands as a part of their expansion in Western Europe.
- In August 2020, Merya Group announced the acquisition of TA Services A/S, which is a leading player of high-end powered wheelchairs in the Danish market. This acquisition was made in order to strengthen Merya’s position in the Danish market for wheelchairs.
Similarly, the team of Future Market Insights has tracked some recent developments related to other manufacturers of the smart wheelchair industry, which are available in the full report.
Report Scope as per Smart Wheelchair Industry Analysis
Attribute |
Details |
Forecast Period |
2017-2021 |
Historical Data Available for |
2022-2032 |
Market Analysis |
US$ Mn for Value |
Key Regions Covered |
North America, Latin America, Europe, South Asia, East Asia, Oceania and Middle East & Africa |
Key Countries Covered |
US, China, Japan, Germany, Canada, UK, India, South Korea, Russia, Australia, BENELUX, Spain, Indonesia, France, Italy, Brazil, Thailand, Malaysia, Mexico, GCC, Argentina, South Africa, Turkey, and New Zealand |
Key Market Segments Covered |
Product, Usage, End-User and Region. |
Key Companies Profiled |
|
Pricing |
Available upon Request |
Key Market Segments Covered in the Smart Wheelchair Industry Research
By Product:
- Joystick based Smart Wheelchairs
- Bluetooth Connected Smart Wheelchairs
By Patient:
- Mobility Impairment
- Ocular Disability
- Geriatric Group
- Multiple-Disability
- Others
By End-User:
- Healthcare Settings
- Home Care Settings
- Public Access
By Region:
- North America
- Latin America
- Europe
- South Asia
- East Asia
- Oceania
- Middle East & Africa
Frequently Asked Questions
The smart wheelchair market is expected to be worth US$ 162.6 in the year 2022 and expand at a CAGR of 7.8% over the forecast period (2022-2032).
The smart wheelchair market is expected to be valued at US$ 344.5 Mn by the end of 2032.
Technological advancements in the field of wheelchairs, rising sedentary lifestyle, and increasing popularity of ultra-lightweight smart wheelchairs are some of the trends shaping the smart wheelchair industry.
The U.S., U.K., China, Japan and Germany are dominating the market of smart wheelchairs globally.
The market for the smart wheelchair in North America holds a value share of 37.0% in 2021 and is projected to grow at a CAGR value of 6.8% over the forecast period (2022-2032).
The sales of the smart wheelchair in Europe are expected to grow at a CAGR of 8.1% over the forecast period (2022-2032).
The U.S., Germany, and Japan are key manufacturers of smart wheelchairs, globally.
Medical Depot, Inc., Permobil AB, Pride Mobility Products Ltd., MEYRA GmbH, DEKA Research & Development Corp., Tmsuk Company limited, Ottobock, WHILL Inc., Invacare Corporation, and Karman Healthcare, Inc., are some of the key players of the smart wheelchair industry.
1. Executive Summary
1.1. Global Market Outlook
1.2. Demand Side Trends
1.3. Supply Side Trends
1.4. Analysis and Recommendations
2. Market Overview
2.1. Market Coverage / Taxonomy
2.2. Market Definition / Scope / Limitations
2.3. Inclusions and Exclusions
3. Key Market Trends
3.1. Key Trends Impacting the Market
3.2. Product Innovation / Development Trends
4. Key Success Factors
4.1. Key Promotional Strategies, By Key Manufacturers
4.2. Regulatory Scenario
4.3. Reimbursement Scenario
4.4. Porter’s Analysis
4.5. PESTLE Analysis
5. COVID19 Crisis Analysis
5.1. Current COVID19 Statistics and Probable Future Impact
5.2. COVID19 and Impact Analysis
5.2.1. Revenue by Product
5.2.2. Revenue by Usage
5.2.3. Revenue by End User
5.2.4. Revenue by Region
6. Market Background
6.1. Macro-Economic Factors
6.1.1. Global GDP Outlook
6.1.2. Global Healthcare Spending Outlook
6.1.3. Global Pharmaceutical Outlook
6.2. Forecast Factors - Relevance & Impact
6.2.1. Adoption rate of Smart Wheelchairs
6.2.2. Rise in Technological Advancements
6.2.3. Strategic Collaborations
6.2.4. Rising Geriatric population
6.3. Market Dynamics
6.3.1. Drivers
6.3.2. Restraints
6.3.3. Opportunity Analysis
7. Global Smart Wheelchair Market Volume (Units) Analysis 2017–2021 and Forecast, 2022–2032
7.1. Historical Market Volume (Units) Analysis, 2017–2021
7.2. Current and Future Market Volume (Units) Projections, 2022–2032
7.2.1. Y-o-Y Growth Trend Analysis
8. Global Smart Wheelchair Market - Pricing Analysis
8.1. Regional Pricing Analysis By Product Type
8.2. Pricing Break-up
8.2.1. Manufacturer Level Pricing
8.2.2. Distributor Level Pricing
8.3. Global Average Pricing Analysis Benchmark
9. Global Smart Wheelchair Market Demand (in Value or Size in US$ Mn) Analysis 2017–2021 and Forecast, 2022–2032
9.1. Historical Market Value (US$ Mn) Analysis, 2017–2021
9.2. Current and Future Market Value (US$ Mn) Projections, 2022–2032
9.2.1. Y-o-Y Growth Trend Analysis
9.2.2. Absolute $ Opportunity Analysis
10. Global Smart Wheelchair Market Analysis 2017–2021 and Forecast 2022–2032, by Product
10.1. Introduction / Key Findings
10.2. Historical Market Size (US$ Mn) and Volume Analysis By Product, 2017–2021
10.3. Current and Future Market Size (US$ Mn) and Volume Analysis and Forecast By Product, 2022–2032
10.3.1. Joystick based Smart Wheelchairs
10.3.2. Bluetooth Connected Smart Wheelchairs
10.4. Market Attractiveness Analysis By Product
11. Global Smart Wheelchair Market Analysis 2017–2021 and Forecast 2022–2032, by Usage
11.1. Introduction / Key Findings
11.2. Historical Market Size (US$ Mn), By Usage, 2017–2021
11.3. Current and Future Market Size (US$ Mn) and Forecast By Usage, 2022–2032
11.3.1. Mobility Impairment
11.3.2. Ocular Disability
11.3.3. Geriatric Group
11.3.4. Multiple-Disability
11.3.5. Others
11.4. Market Attractiveness Analysis By Usage
12. Global Smart Wheelchair Market Analysis 2017–2021 and Forecast 2022–2032, by End User
12.1. Introduction / Key Findings
12.2. Historical Market Size (US$ Mn), By End User, 2017–2021
12.3. Current and Future Market Size (US$ Mn) Forecast By End User, 2022–2032
12.3.1. Healthcare Settings
12.3.2. Home Care Settings
12.3.3. Public Access
12.4. Market Attractiveness Analysis By End User
13. Global Smart Wheelchair Market Analysis 2017–2021 and Forecast 2022–2032, by Region
13.1. Introduction
13.2. Historical Market Size (US$ Mn) and Volume Analysis By Region, 2017–2021
13.3. Current and Future Market Size (US$ Mn) and Volume Analysis and Forecast By Region, 2022–2032
13.3.1. North America
13.3.2. Latin America
13.3.3. Europe
13.3.4. East Asia
13.3.5. South Asia
13.3.6. Oceania
13.3.7. Middle East and Africa (MEA)
13.4. Market Attractiveness Analysis By Region
14. North America Smart Wheelchair Market Analysis 2017–2021 and Forecast 2022–2032
14.1. Introduction
14.2. Pricing Analysis
14.3. Historical Market Size (US$ Mn) and Volume Trend Analysis By Market Taxonomy, 2017–2021
14.4. Current and Future Market Size (US$ Mn) and Volume Forecast By Market Taxonomy, 2022–2032
14.4.1. By Country
14.4.1.1. U.S.
14.4.1.2. Canada
14.4.2. By Product
14.4.3. By Usage
14.4.4. By End User
14.5. Market Attractiveness Analysis
14.5.1. By Country
14.5.2. By Product
14.5.3. By Usage
14.5.4. By End User
14.6. Market Trends
14.7. Key Market Participants - Intensity Mapping
14.8. Drivers and Restraints - Impact Analysis
14.9. Country Level Analysis & Forecast
14.9.1. U.S. Smart Wheelchair Market Analysis
14.9.1.1. Introduction
14.9.1.2. Market Analysis and Forecast by Market Taxonomy
14.9.1.2.1. By Product
14.9.1.2.2. By Usage
14.9.1.2.3. By End User
14.9.2. Canada Smart Wheelchair Market Analysis
14.9.2.1. Introduction
14.9.2.2. Market Analysis and Forecast by Market Taxonomy
14.9.2.2.1. By Product
14.9.2.2.2. By Usage
14.9.2.2.3. By End User
15. Latin America Smart Wheelchair Market Analysis 2017–2021 and Forecast 2022–2032
15.1. Introduction
15.2. Pricing Analysis
15.3. Historical Market Size (US$ Mn) and Volume Trend Analysis By Market Taxonomy, 2017–2021
15.4. Current and Future Market Size (US$ Mn) and Volume Forecast By Market Taxonomy, 2022–2032
15.4.1. By Country
15.4.1.1. Mexico
15.4.1.2. Brazil
15.4.1.3. Argentina
15.4.1.4. Rest of Latin America
15.4.2. By Product
15.4.3. By Usage
15.4.4. By End User
15.5. Market Attractiveness Analysis
15.5.1. By Country
15.5.2. By Product
15.5.3. By Usage
15.5.4. By End User
15.6. Market Trends
15.7. Key Market Participants - Intensity Mapping
15.8. Drivers and Restraints - Impact Analysis
15.9. Country Level Analysis & Forecast
15.9.1. Mexico Smart Wheelchair Market Analysis
15.9.1.1. Introduction
15.9.1.2. Market Analysis and Forecast by Market Taxonomy
15.9.1.2.1. By Product
15.9.1.2.2. By Usage
15.9.1.2.3. By End User
15.9.2. Brazil Smart Wheelchair Market Analysis
15.9.2.1. Introduction
15.9.2.2. Market Analysis and Forecast by Market Taxonomy
15.9.2.2.1. By Product
15.9.2.2.2. By Usage
15.9.2.2.3. By End User
15.9.3. Argentina Smart Wheelchair Market Analysis
15.9.3.1. Introduction
15.9.3.2. Market Analysis and Forecast by Market Taxonomy
15.9.3.2.1. By Product
15.9.3.2.2. By Usage
15.9.3.2.3. By End User
16. Europe Smart Wheelchair Market Analysis 2017–2021 and Forecast 2022–2032
16.1. Introduction
16.2. Pricing Analysis
16.3. Historical Market Size (US$ Mn) and Volume Trend Analysis By Market Taxonomy, 2017–2021
16.4. Current and Future Market Size (US$ Mn) and Volume Forecast By Market Taxonomy, 2022–2032
16.4.1. By Country
16.4.1.1. Germany
16.4.1.2. Italy
16.4.1.3. France
16.4.1.4. U.K.
16.4.1.5. Spain
16.4.1.6. BENELUX
16.4.1.7. Nordic Countries
16.4.1.8. Russia
16.4.1.9. Rest of Europe
16.4.2. By Product
16.4.3. By Usage
16.4.4. By End User
16.5. Market Attractiveness Analysis
16.5.1. By Country
16.5.2. By Product
16.5.3. By Usage
16.5.4. By End User
16.6. Market Trends
16.7. Key Market Participants - Intensity Mapping
16.8. Drivers and Restraints - Impact Analysis
16.9. Country Level Analysis & Forecast
16.9.1. Germany Smart Wheelchair Market Analysis
16.9.1.1. Introduction
16.9.1.2. Market Analysis and Forecast by Market Taxonomy
16.9.1.2.1. By Product
16.9.1.2.2. By Usage
16.9.1.2.3. By End User
16.9.2. Italy Smart Wheelchair Market Analysis
16.9.2.1. Introduction
16.9.2.2. Market Analysis and Forecast by Market Taxonomy
16.9.2.2.1. By Product
16.9.2.2.2. By Usage
16.9.2.2.3. By End User
16.9.3. France Smart Wheelchair Market Analysis
16.9.3.1. Introduction
16.9.3.2. Market Analysis and Forecast by Market Taxonomy
16.9.3.2.1. By Product
16.9.3.2.2. By Usage
16.9.3.2.3. By End User
16.9.4. U.K. Smart Wheelchair Market Analysis
16.9.4.1. Introduction
16.9.4.2. Market Analysis and Forecast by Market Taxonomy
16.9.4.2.1. By Product
16.9.4.2.2. By Usage
16.9.4.2.3. By End User
16.9.5. Spain Smart Wheelchair Market Analysis
16.9.5.1. Introduction
16.9.5.2. Market Analysis and Forecast by Market Taxonomy
16.9.5.2.1. By Product
16.9.5.2.2. By Usage
16.9.5.2.3. By End User
16.9.6. BENELUX Smart Wheelchair Market Analysis
16.9.6.1. Introduction
16.9.6.2. Market Analysis and Forecast by Market Taxonomy
16.9.6.2.1. By Product
16.9.6.2.2. By Usage
16.9.6.2.3. By End User
16.9.7. Nordic Countries & Russia Smart Wheelchair Market Analysis
16.9.7.1. Introduction
16.9.7.2. Market Analysis and Forecast by Market Taxonomy
16.9.7.2.1. By Product
16.9.7.2.2. By Usage
16.9.7.2.3. By End User
16.9.8. Russia Smart Wheelchair Market Analysis
16.9.8.1. Introduction
16.9.8.2. Market Analysis and Forecast by Market Taxonomy
16.9.8.2.1. By Product
16.9.8.2.2. By Usage
16.9.8.2.3. By End User
17. East Asia Smart Wheelchair Market Analysis 2017–2021 and Forecast 2022–2032
17.1. Introduction
17.2. Pricing Analysis
17.3. Historical Market Size (US$ Mn) and Volume Trend Analysis By Market Taxonomy, 2017–2021
17.4. Current and Future Market Size (US$ Mn) and Volume Forecast By Market Taxonomy, 2022–2032
17.4.1. By Country
17.4.1.1. China
17.4.1.2. Japan
17.4.1.3. South Korea
17.4.2. By Product
17.4.3. By Usage
17.4.4. By End User
17.5. Market Attractiveness Analysis
17.5.1. By Country
17.5.2. By Product
17.5.3. By Usage
17.5.4. By End User
17.6. Market Trends
17.7. Key Market Participants - Intensity Mapping
17.8. Drivers and Restraints - Impact Analysis
17.9. Country Level Analysis & Forecast
17.9.1. China Smart Wheelchair Market Analysis
17.9.1.1. Introduction
17.9.1.2. Market Analysis and Forecast by Market Taxonomy
17.9.1.2.1. By Product
17.9.1.2.2. By Usage
17.9.1.2.3. By End User
17.9.2. Japan Smart Wheelchair Market Analysis
17.9.2.1. Introduction
17.9.2.2. Market Analysis and Forecast by Market Taxonomy
17.9.2.2.1. By Product
17.9.2.2.2. By Usage
17.9.2.2.3. By End User
17.9.3. South Korea Smart Wheelchair Market Analysis
17.9.3.1. Introduction
17.9.3.2. Market Analysis and Forecast by Market Taxonomy
17.9.3.2.1. By Product
17.9.3.2.2. By Usage
17.9.3.2.3. By End User
18. South Asia Smart Wheelchair Market Analysis 2017–2021 and Forecast 2022–2032
18.1. Introduction
18.2. Pricing Analysis
18.3. Historical Market Size (US$ Mn) and Volume Trend Analysis By Market Taxonomy, 2017–2021
18.4. Current and Future Market Size (US$ Mn) and Volume Forecast By Market Taxonomy, 2022–2032
18.4.1. By Country
18.4.1.1. India
18.4.1.2. Indonesia
18.4.1.3. Malaysia
18.4.1.4. Philippines
18.4.1.5. Thailand
18.4.1.6. Vietnam
18.4.1.7. Rest of South Asia
18.4.2. By Product
18.4.3. By Usage
18.4.4. By End User
18.5. Market Attractiveness Analysis
18.5.1. By Country
18.5.2. By Product
18.5.3. By Usage
18.5.4. By End User
18.6. Market Trends
18.7. Key Market Participants - Intensity Mapping
18.8. Drivers and Restraints - Impact Analysis
18.9. Country Level Analysis & Forecast
18.9.1. India Smart Wheelchair Market Analysis
18.9.1.1. Introduction
18.9.1.2. Market Analysis and Forecast by Market Taxonomy
18.9.1.2.1. By Product
18.9.1.2.2. By Usage
18.9.1.2.3. By End User
18.9.2. Indonesia Smart Wheelchair Market Analysis
18.9.2.1. Introduction
18.9.2.2. Market Analysis and Forecast by Market Taxonomy
18.9.2.2.1. By Product
18.9.2.2.2. By Usage
18.9.2.2.3. By End User
18.9.3. Malaysia Smart Wheelchair Market Analysis
18.9.3.1. Introduction
18.9.3.2. Market Analysis and Forecast by Market Taxonomy
18.9.3.2.1. By Product
18.9.3.2.2. By Usage
18.9.3.2.3. By End User
18.9.4. Philippines Smart Wheelchair Market Analysis
18.9.4.1. Introduction
18.9.4.2. Market Analysis and Forecast by Market Taxonomy
18.9.4.2.1. By Product
18.9.4.2.2. By Usage
18.9.4.2.3. By End User
18.9.5. Thailand Smart Wheelchair Market Analysis
18.9.5.1. Introduction
18.9.5.2. Market Analysis and Forecast by Market Taxonomy
18.9.5.2.1. By Product
18.9.5.2.2. By Usage
18.9.5.2.3. By End User
18.9.6. Vietnam Smart Wheelchair Market Analysis
18.9.6.1. Introduction
18.9.6.2. Market Analysis and Forecast by Market Taxonomy
18.9.6.2.1. By Product
18.9.6.2.2. By Usage
18.9.6.2.3. By End User
18.9.7. Rest of South Asia Smart Wheelchair Market Analysis
18.9.7.1. Introduction
18.9.7.2. Market Analysis and Forecast by Market Taxonomy
18.9.7.2.1. By Product
18.9.7.2.2. By Usage
18.9.7.2.3. By End User
19. Oceania Smart Wheelchair Market 2017-2021 and Forecast 2022-2032
19.1. Introduction
19.2. Pricing Analysis
19.3. Historical Market Size (US$ Mn) and Volume Trend Analysis By Market Taxonomy, 2017–2021
19.4. Current and Future Market Size (US$ Mn) and Volume Forecast By Market Taxonomy, 2022–2032
19.4.1. By Country
19.4.1.1. Australia
19.4.1.2. New Zealand
19.4.2. By Product
19.4.3. By Usage
19.4.4. By End User
19.5. Market Attractiveness Analysis
19.5.1. By Country
19.5.2. By Product
19.5.3. By Usage
19.5.4. By End User
19.6. Key Market Participants - Intensity Mapping
19.7. Drivers and Restraints - Impact Analysis
19.8. Country Level Analysis & Forecast
19.8.1. Australia Smart Wheelchair Market Analysis
19.8.1.1. Introduction
19.8.1.2. Market Analysis and Forecast by Market Taxonomy
19.8.1.2.1. By Product
19.8.1.2.2. By Usage
19.8.1.2.3. By End User
19.8.2. New Zealand Smart Wheelchair Market Analysis
19.8.2.1. Introduction
19.8.2.2. Market Analysis and Forecast by Market Taxonomy
19.8.2.2.1. By Product
19.8.2.2.2. By Usage
19.8.2.2.3. By End User
20. Middle East and Africa (MEA) Smart Wheelchair Market Analysis 2017–2021 and Forecast 2022–2032
20.1. Introduction
20.2. Pricing Analysis
20.3. Historical Market Size (US$ Mn) and Volume Trend Analysis By Market Taxonomy, 2017–2021
20.4. Current and Future Market Size (US$ Mn) and Volume Forecast By Market Taxonomy, 2022–2032
20.4.1. By Country
20.4.1.1. GCC Countries
20.4.1.2. Israel
20.4.1.3. Turkey
20.4.1.4. South Africa & North Africa
20.4.1.5. Rest of Middle East and Africa
20.4.2. By Product
20.4.3. By Usage
20.4.4. By End User
20.5. Market Attractiveness Analysis
20.5.1. By Country
20.5.2. By Product
20.5.3. By Usage
20.5.4. By End User
20.6. Market Trends
20.7. Key Market Participants - Intensity Mapping
20.8. Drivers and Restraints - Impact Analysis
20.9. Country Level Analysis & Forecast
20.9.1. GCC Countries Smart Wheelchair Market Analysis
20.9.1.1. Introduction
20.9.1.2. Market Analysis and Forecast by Market Taxonomy
20.9.1.2.1. By Product
20.9.1.2.2. By Usage
20.9.1.2.3. By End User
20.9.2. Israel Smart Wheelchair Market Analysis
20.9.2.1. Introduction
20.9.2.2. Market Analysis and Forecast by Market Taxonomy
20.9.2.2.1. By Product
20.9.2.2.2. By Usage
20.9.2.2.3. By End User
20.9.3. Turkey Smart Wheelchair Market Analysis
20.9.3.1. Introduction
20.9.3.2. Market Analysis and Forecast by Market Taxonomy
20.9.3.2.1. By Product
20.9.3.2.2. By Usage
20.9.3.2.3. By End User
20.9.4. South Africa & North Africa Smart Wheelchair Market Analysis
20.9.4.1. Introduction
20.9.4.2. Market Analysis and Forecast by Market Taxonomy
20.9.4.2.1. By Product
20.9.4.2.2. By Usage
20.9.4.2.3. By End User
20.9.5. Rest of MEA Smart Wheelchair Market Analysis
20.9.5.1. Introduction
20.9.5.2. Market Analysis and Forecast by Market Taxonomy
20.9.5.2.1. By Product
20.9.5.2.2. By Usage
20.9.5.2.3. By End User
21. Market Structure Analysis
21.1. Market Analysis by Tier of Companies
21.2. Market Share Analysis of Top Players
21.3. Market Presence Analysis
22. Competition Analysis
22.1. Competition Dashboard
22.2. Competition Benchmarking
22.3. Competition Deep Dive
22.3.1. Medical Depot, Inc.
22.3.1.1. Overview
22.3.1.2. Product Portfolio
22.3.1.3. SWOT Analysis
22.3.1.4. Sales Footprint
22.3.1.5. Key Financials
22.3.1.6. Strategy Overview
22.3.2. Permobil AB
22.3.2.1. Overview
22.3.2.2. Product Portfolio
22.3.2.3. SWOT Analysis
22.3.2.4. Sales Footprint
22.3.2.5. Key Financials
22.3.2.6. Strategy Overview
22.3.3. Pride Mobility Products Ltd.
22.3.3.1. Overview
22.3.3.2. Product Portfolio
22.3.3.3. SWOT Analysis
22.3.3.4. Sales Footprint
22.3.3.5. Key Financials
22.3.3.6. Strategy Overview
22.3.4. MEYRA GmbH
22.3.4.1. Overview
22.3.4.2. Product Portfolio
22.3.4.3. SWOT Analysis
22.3.4.4. Sales Footprint
22.3.4.5. Key Financials
22.3.4.6. Strategy Overview
22.3.5. DEKA Research & Development Corp.
22.3.5.1. Overview
22.3.5.2. Product Portfolio
22.3.5.3. SWOT Analysis
22.3.5.4. Sales Footprint
22.3.5.5. Key Financials
22.3.5.6. Strategy Overview
22.3.6. tmsuk company limited
22.3.6.1. Overview
22.3.6.2. Product Portfolio
22.3.6.3. SWOT Analysis
22.3.6.4. Sales Footprint
22.3.6.5. Key Financials
22.3.6.6. Strategy Overview
22.3.7. Ottobock
22.3.7.1. Overview
22.3.7.2. Product Portfolio
22.3.7.3. SWOT Analysis
22.3.7.4. Sales Footprint
22.3.7.5. Key Financials
22.3.7.6. Strategy Overview
22.3.8. WHILL Inc.
22.3.8.1. Overview
22.3.8.2. Product Portfolio
22.3.8.3. SWOT Analysis
22.3.8.4. Sales Footprint
22.3.8.5. Key Financials
22.3.8.6. Strategy Overview
22.3.9. Invacare Corporation
22.3.9.1. Overview
22.3.9.2. Product Portfolio
22.3.9.3. SWOT Analysis
22.3.9.4. Sales Footprint
22.3.9.5. Key Financials
22.3.9.6. Strategy Overview
22.3.10. Karman Healthcare, Inc.
22.3.10.1. Overview
22.3.10.2. Product Portfolio
22.3.10.3. SWOT Analysis
22.3.10.4. Sales Footprint
22.3.10.5. Key Financials
22.3.10.6. Strategy Overview
23. Assumptions and Acronyms Used
24. Research Methodology
Let us know your requirement to get
100% FREE customization
Table 01: Global Smart Wheelchair Market Value (US$ Mn) Analysis 2012–2021, by Product
Table 02: Global Smart Wheelchair Market Value (US$ Mn) Opportunity Assessment 2022–2032, by Product
Table 03: Global Smart Wheelchair Market Volume (US$ Mn) Analysis 2012–2021, by Product
Table 04: Global Smart Wheelchair Market Volume (Mn) Opportunity Assessment 2022–2032, by Product
Table 05: Global Smart Wheelchair Market Value (US$ Mn) Analysis 2012–2021, by Usage
Table 06: Global Smart Wheelchair Market Value (US$ Mn) Opportunity Assessment 2022–2032, by Usage
Table 07: Global Smart Wheelchair Market Value (US$ Mn) Analysis 2012–2021, by End User
Table 08: Global Smart Wheelchair Market Value (US$ Mn) Opportunity Assessment 2022–2032, by End User
Table 09: Global Smart Wheelchair Market Value (US$ Mn) Analysis 2012–2021, by Region
Table 10: Global Smart Wheelchair Market Value (US$ Mn) Opportunity Assessment 2022–2032, by Region
Table 11: North America Smart Wheelchair Market Value (US$ Mn) Analysis 2012–2021, by Country
Table 12: North America Smart Wheelchair Market Value (US$ Mn) Opportunity Assessment 2022–2032, by Country
Table 13: North America Smart Wheelchair Market Value (US$ Mn) Analysis 2012–2021, by Product
Table 14: North America Smart Wheelchair Market Value (US$ Mn) Opportunity Assessment 2022–2032, by Product
Table 15: North America Smart Wheelchair Market Volume (Units) Analysis 2012–2021, by Product
Table 16: North America Smart Wheelchair Market Volume (Units) Opportunity Assessment 2022–2032, by Product
Table 17: North America Smart Wheelchair Market Value (US$ Mn) Analysis 2012–2021, by Usage
Table 18: North America Smart Wheelchair Market Value (US$ Mn) Opportunity Assessment 2022–2032, by Usage
Table 19: North America Smart Wheelchair Market Value (US$ Mn) Analysis 2012–2021, by End User
Table 20: North America Smart Wheelchair Market Value (US$ Mn) Opportunity Assessment 2022–2032, by End User
Table 21: Latin America Smart Wheelchair Market Value (US$ Mn) Analysis 2012–2021, by Country
Table 22: Latin America Smart Wheelchair Market Value (US$ Mn) Opportunity Assessment 2022–2032, by Country
Table 23: Latin America Smart Wheelchair Market Value (US$ Mn) Analysis 2012–2021, by Product
Table 24: Latin America Smart Wheelchair Market Value (US$ Mn) Opportunity Assessment 2022–2032, by Product
Table 25: Latin America Smart Wheelchair Market Volume (Units) Analysis 2012–2021, by Product
Table 26: Latin America Smart Wheelchair Market Volume (Units) Opportunity Assessment 2022–2032, by Product
Table 27: Latin America Smart Wheelchair Market Value (US$ Mn) Analysis 2012–2021, by Usage
Table 28: Latin America Smart Wheelchair Market Value (US$ Mn) Opportunity Assessment 2022–2032, by Usage
Table 29: Latin America Smart Wheelchair Market Value (US$ Mn) Analysis 2012–2021, by End User
Table 30: Latin America Smart Wheelchair Market Value (US$ Mn) Opportunity Assessment 2022–2032, by End User
Table 31: Europe Smart Wheelchair Market Value (US$ Mn) Analysis 2012–2021, by Country
Table 32: Europe Smart Wheelchair Market Value (US$ Mn) Opportunity Assessment 2022–2032, by Country
Table 33: Europe Smart Wheelchair Market Value (US$ Mn) Analysis 2012–2021, by Product
Table 34: Europe Smart Wheelchair Market Value (US$ Mn) Opportunity Assessment 2022–2032, by Product
Table 35: Europe Smart Wheelchair Market Volume (US$ Mn) Analysis 2012–2021, by Product
Table 36: Europe Smart Wheelchair Market Volume (Unit) Opportunity Assessment 2022–2032, by Product
Table 37: Europe Smart Wheelchair Market Value (US$ Mn) Analysis 2012–2021, by Usage
Table 38: Europe Smart Wheelchair Market Value (US$ Mn) Opportunity Assessment 2022–2032, by Usage
Table 39: Europe Smart Wheelchair Market Value (US$ Mn) Analysis 2012–2021, by End User
Table 40: Europe Smart Wheelchair Market Value (US$ Mn) Opportunity Assessment 2022–2032, by End User
Table 41: South Asia Smart Wheelchair Market Value (US$ Mn) Analysis 2012–2021, by Country
Table 42: South Asia Smart Wheelchair Market Value (US$ Mn) Opportunity Assessment 2022–2032, by Country
Table 43: South Asia Smart Wheelchair Market Value (US$ Mn) Analysis 2012–2021, by Product
Table 44: South Asia Smart Wheelchair Market Value (US$ Mn) Opportunity Assessment 2022–2032, by Product
Table 45: South Asia Smart Wheelchair Market Volume (Units) Analysis 2012–2021, by Product
Table 46: South Asia Smart Wheelchair Market Volume (Units) Opportunity Assessment 2022–2032, by Product
Table 47: South Asia Smart Wheelchair Market Value (US$ Mn) Analysis 2012–2021, by Usage
Table 48: South Asia Smart Wheelchair Market Value (US$ Mn) Opportunity Assessment 2022–2032, by Usage
Table 49: South Asia Smart Wheelchair Market Value (US$ Mn) Analysis 2012–2021, by End User
Table 50: South Asia Smart Wheelchair Market Value (US$ Mn) Opportunity Assessment 2022–2032, by End User
Table 51: East Asia Smart Wheelchair Market Value (US$ Mn) Analysis 2012–2021, by Country
Table 52: East Asia Smart Wheelchair Market Value (US$ Mn) Opportunity Assessment 2022–2032, by Country
Table 53: East Asia Smart Wheelchair Market Value (US$ Mn) Analysis 2012–2021, by Product
Table 54: East Asia Smart Wheelchair Market Value (US$ Mn) Opportunity Assessment 2022–2032, by Product
Table 55: East Asia Smart Wheelchair Market Volume (Unit) Analysis 2012–2021, by Product
Table 56: East Asia Smart Wheelchair Market Volume (Unit) Opportunity Assessment 2022–2032, by Product
Table 57: East Asia Smart Wheelchair Market Value (US$ Mn) Analysis 2012–2021, by Usage
Table 58: East Asia Smart Wheelchair Market Value (US$ Mn) Opportunity Assessment 2022–2032, by Usage
Table 59: East Asia Smart Wheelchair Market Value (US$ Mn) Analysis 2012–2021, by End User
Table 60: East Asia Smart Wheelchair Market Value (US$ Mn) Opportunity Assessment 2022–2032, by End User
Table 61: Oceania Smart Wheelchair Market Value (US$ Mn) Analysis 2012–2021, by Country
Table 62: Oceania Smart Wheelchair Market Value (US$ Mn) Opportunity Assessment 2022–2032, by Country
Table 63: Oceania Smart Wheelchair Market Value (US$ Mn) Analysis 2012–2021, by Product
Table 64: Oceania Smart Wheelchair Market Value (US$ Mn) Opportunity Assessment 2022–2032, by Product
Table 65: Oceania Smart Wheelchair Market Volume (Unit) Analysis 2012–2021, by Product
Table 66: Oceania Smart Wheelchair Market Volume (Unit) Opportunity Assessment 2022–2032, by Product
Table 67: Oceania Smart Wheelchair Market Value (US$ Mn) Analysis 2012–2021, by Usage
Table 68: Oceania Smart Wheelchair Market Value (US$ Mn) Opportunity Assessment 2022–2032, by Usage
Table 69: Oceania Smart Wheelchair Market Value (US$ Mn) Analysis 2012–2021, by End User
Table 70: Oceania Smart Wheelchair Market Value (US$ Mn) Opportunity Assessment 2022–2032, by End User
Table 71: Middle East and Africa Smart Wheelchair Market Value (US$ Mn) Analysis 2012–2021, by Country
Table 72: Middle East and Africa Smart Wheelchair Market Value (US$ Mn) Opportunity Assessment 2022–2032, by Country
Table 73: Middle East and Africa Smart Wheelchair Market Value (US$ Mn) Analysis 2012–2021, by Product
Table 74: Middle East and Africa Smart Wheelchair Market Value (US$ Mn) Opportunity Assessment 2022–2032, by Product
Table 75: Middle East and Africa Smart Wheelchair Market Volume (Units) Analysis 2012–2021, by Product
Table 76: Middle East and Africa Smart Wheelchair Market Volume (Units) Opportunity Assessment 2022–2032, by Product
Table 77: Middle East and Africa Smart Wheelchair Market Value (US$ Mn) Analysis 2012–2021, by Usage
Table 78: Middle East and Africa Smart Wheelchair Market Value (US$ Mn) Opportunity Assessment 2022–2032, by Usage
Table 79: Middle East and Africa Smart Wheelchair Market Value (US$ Mn) Analysis 2012–2021, by End User
Table 80: Middle East and Africa Smart Wheelchair Market Value (US$ Mn) Opportunity Assessment 2022–2032, by End User
Find your sweet spots for generating winning opportunities in this market.
Talk to AnalystFigure 01: Global Smart Wheelchair Market Historical Market Value (US$ Mn) Analysis, 2012–2021
Figure 02: Global Smart Wheelchair Market Value (US$ Mn), 2022 – 2032 & Y-o-Y Growth Trend Analysis
Figure 03: Global Smart Wheelchair Market Absolute $ Opportunity, 2022-2032
Figure 04: Global Smart Wheelchair Market Share Analysis (%), by Product, 2021 & 2032
Figure 05: Global Smart Wheelchair Market Y-o-Y Analysis (%), by Product, 2022-2032
Figure 06: Global Smart Wheelchair Market Attractiveness Analysis by Product, 2022-2032
Figure 07: Global Smart Wheelchair Market Share Analysis (%), by Usage, 2021 & 2032
Figure 08: Global Smart Wheelchair Market Y-o-Y Analysis (%), by Usage, 2022-2032
Figure 09: Global Smart Wheelchair Market Attractiveness Analysis by Usage, 2022-2032
Figure 10: Global Smart Wheelchair Market Share Analysis (%), by End User, 2021 & 2032
Figure 11: Global Smart Wheelchair Market Y-o-Y Analysis (%), by End User, 2022-2032
Figure 12: Global Smart Wheelchair Market Attractiveness Analysis by End User, 2022-2032
Figure 13: Global Smart Wheelchair Market Share Analysis (%), by Region, 2021 & 2032
Figure 14: Global Smart Wheelchair Market Y-o-Y Analysis (%), by Region, 2022-2032
Figure 15: Global Smart Wheelchair Market Attractiveness Analysis by Region, 2022-2032
Figure 16: North America Smart Wheelchair Market Share Analysis (%), by Country (2022)
Figure 17: North America Smart Wheelchair Market Share Analysis (%), by Product (2022)
Figure 18: North America Smart Wheelchair Market Share Analysis (%), by Usage (2022)
Figure 19: North America Smart Wheelchair Market Share Analysis (%), by End User (2022)
Figure 20: North America Smart Wheelchair Historical Market Value (US$ Mn) Analysis, 2012–2021
Figure 21: North America Smart Wheelchair Current and Future Market Value (US$ Mn), 2022-2032 & Y-o-Y Growth Trend Analysis
Figure 22: North America Smart Wheelchair Market Attractiveness Analysis, by Country
Figure 23: North America Smart Wheelchair Market Attractiveness Analysis, by Product
Figure 24: North America Smart Wheelchair Market Attractiveness Analysis, by Usage
Figure 25: North America Smart Wheelchair Market Attractiveness Analysis, by End User
Figure 26: U.S. Market Value Proportion Analysis, 2021
Figure 27: Global Vs U.S. Y-o-Y Growth Comparison, 2021-2032
Figure 28: U.S. Smart Wheelchair Market Share Analysis (%), by Product, 2021 & 2032
Figure 29: U.S. Smart Wheelchair Market Share Analysis (%), by Usage, 2021 & 2032
Figure 30: U.S. Smart Wheelchair Market Share Analysis (%), by End User, 2021 & 2032
Figure 31: Canada Market Value Proportion Analysis, 2021
Figure 32: Global Vs Canada Y-o-Y Growth Comparison, 2021-2032
Figure 33: Canada Smart Wheelchair Market Share Analysis (%), by Product, 2021 & 2032
Figure 34: Canada Smart Wheelchair Market Share Analysis (%), by Usage, 2021 & 2032
Figure 35: Canada Smart Wheelchair Market Share Analysis (%), by End User, 2021 & 2032
Figure 36: Latin America Smart Wheelchair Market Share Analysis (%), by Country (2022)
Figure 37: Latin America Smart Wheelchair Market Share Analysis (%), by Product (2022)
Figure 38: Latin America Smart Wheelchair Market Share Analysis (%), by Usage (2022)
Figure 39: Latin America Smart Wheelchair Market Share Analysis (%), by End User (2022)
Figure 40: Latin America Smart Wheelchair Historical Market Value (US$ Mn) Analysis, 2012–2021
Figure 41: Latin America Smart Wheelchair Current and Future Market Value (US$ Mn), 2022-2032 & Y-o-Y Growth Trend Analysis
Figure 42: Latin America Smart Wheelchair Market Attractiveness Analysis, by Country
Figure 43: Latin America Smart Wheelchair Market Attractiveness Analysis, by Product
Figure 44: Latin America Smart Wheelchair Market Attractiveness Analysis, by Usage
Figure 45: Latin America Smart Wheelchair Market Attractiveness Analysis, by End User
Figure 46: Brazil Market Value Proportion Analysis, 2021
Figure 47: Global Vs Brazil Y-o-Y Growth Comparison, 2021-2032
Figure 48: Brazil Smart Wheelchair Market Share Analysis (%), by Product, 2021 & 2032
Figure 49: Brazil Smart Wheelchair Market Share Analysis (%), by Usage, 2021 & 2032
Figure 50: Brazil Smart Wheelchair Market Share Analysis (%), by End User, 2021 & 2032
Figure 51: Mexico Market Value Proportion Analysis, 2021
Figure 52: Global Vs Mexico Y-o-Y Growth Comparison, 2021-2032
Figure 53: Mexico Smart Wheelchair Market Share Analysis (%), by Product, 2021 & 2032
Figure 54: Mexico Smart Wheelchair Market Share Analysis (%), by Usage, 2021 & 2032
Figure 55: Mexico Smart Wheelchair Market Share Analysis (%), by End User, 2021 & 2032
Figure 56: Argentina Market Value Proportion Analysis, 2021
Figure 57: Global Vs Argentina Y-o-Y Growth Comparison, 2021-2032
Figure 58: Argentina Smart Wheelchair Market Share Analysis (%), by Product, 2021 & 2032
Figure 59: Argentina Smart Wheelchair Market Share Analysis (%), by Usage, 2021 & 2032
Figure 60: Argentina Smart Wheelchair Market Share Analysis (%), by End User, 2021 & 2032
Figure 61: Europe Smart Wheelchair Market Share Analysis (%), by Country (2022)
Figure 62: Europe Smart Wheelchair Market Share Analysis (%), by Product (2022)
Figure 63: Europe Smart Wheelchair Market Share Analysis (%), by Usage (2022)
Figure 64: Europe Smart Wheelchair Market Share Analysis (%), by End User (2022)
Figure 65: Europe Smart Wheelchair Historical Market Value (US$ Mn) Analysis, 2012–2021
Figure 66: Europe Smart Wheelchair Current and Future Market Value (US$ Mn), 2022-2032 & Y-o-Y Growth Trend Analysis
Figure 67: Europe Smart Wheelchair Market Attractiveness Analysis, by Country
Figure 68: Europe Smart Wheelchair Market Attractiveness Analysis, by Product
Figure 69: Europe Smart Wheelchair Market Attractiveness Analysis, by Usage
Figure 70: Europe Smart Wheelchair Market Attractiveness Analysis, by End User
Figure 71: Germany Market Value Proportion Analysis, 2021
Figure 72: Global Vs Germany Y-o-Y Growth Comparison, 2021-2032
Figure 73: Germany Smart Wheelchair Market Share Analysis (%), by Product, 2021 & 2032
Figure 74: Germany Smart Wheelchair Market Share Analysis (%), by Usage, 2021 & 2032
Figure 75: Germany Smart Wheelchair Market Share Analysis (%), by End User, 2021 & 2032
Figure 76: Italy Market Value Proportion Analysis, 2021
Figure 77: Global Vs Italy Y-o-Y Growth Comparison, 2021-2032
Figure 78: Italy Smart Wheelchair Market Share Analysis (%), by Product, 2021 & 2032
Figure 79: Italy Smart Wheelchair Market Share Analysis (%), by Usage, 2021 & 2032
Figure 80: Italy Smart Wheelchair Market Share Analysis (%), by End User, 2021 & 2032
Figure 81: France Market Value Proportion Analysis, 2021
Figure 82: Global Vs France Y-o-Y Growth Comparison, 2021-2032
Figure 83: France Smart Wheelchair Market Share Analysis (%), by Product, 2021 & 2032
Figure 84: France Smart Wheelchair Market Share Analysis (%), by Usage, 2021 & 2032
Figure 85: France Smart Wheelchair Market Share Analysis (%), by End User, 2021 & 2032
Figure 86: U.K. Market Value Proportion Analysis, 2021
Figure 87: Global Vs U.K. Y-o-Y Growth Comparison, 2021-2032
Figure 88: U.K. Smart Wheelchair Market Share Analysis (%), by Product, 2021 & 2032
Figure 89: U.K. Smart Wheelchair Market Share Analysis (%), by Usage, 2021 & 2032
Figure 90: U.K. Smart Wheelchair Market Share Analysis (%), by End User, 2021 & 2032
Figure 91: Spain Market Value Proportion Analysis, 2021
Figure 92: Global Vs Spain Y-o-Y Growth Comparison, 2021-2032
Figure 93: Spain Smart Wheelchair Market Share Analysis (%), by Product, 2021 & 2032
Figure 94: Spain Smart Wheelchair Market Share Analysis (%), by Usage, 2021 & 2032
Figure 95: Spain Smart Wheelchair Market Share Analysis (%), by End User, 2021 & 2032
Figure 96: BENELUX Market Value Proportion Analysis, 2021
Figure 97: Global Vs BENELUX Y-o-Y Growth Comparison, 2021-2032
Figure 98: BENELUX Smart Wheelchair Market Share Analysis (%), by Product, 2021 & 2032
Figure 99: BENELUX Smart Wheelchair Market Share Analysis (%), by Usage, 2021 & 2032
Figure 100: BENELUX Smart Wheelchair Market Share Analysis (%), by End User, 2021 & 2032
Figure 101: Russia Market Value Proportion Analysis, 2021
Figure 102: Global Vs Russia Y-o-Y Growth Comparison, 2021-2032
Figure 103: Russia Smart Wheelchair Market Share Analysis (%), by Product, 2021 & 2032
Figure 104: Russia Smart Wheelchair Market Share Analysis (%), by Usage, 2021 & 2032
Figure 105: Russia Smart Wheelchair Market Share Analysis (%), by End User, 2021 & 2032
Figure 106: Switzerland Market Value Proportion Analysis, 2021
Figure 107: Global Vs Switzerland Y-o-Y Growth Comparison, 2021-2032
Figure 108: Switzerland Smart Wheelchair Market Share Analysis (%), by Product, 2021 & 2032
Figure 109: Switzerland Smart Wheelchair Market Share Analysis (%), by Usage, 2021 & 2032
Figure 110: Switzerland Smart Wheelchair Market Share Analysis (%), by End User, 2021 & 2032
Figure 111: Nordic Countries Market Value Proportion Analysis, 2021
Figure 112: Global Vs Nordic Countries Y-o-Y Growth Comparison, 2021-2032
Figure 113: Nordic Countries Smart Wheelchair Market Share Analysis (%), by Product, 2021 & 2032
Figure 114: Nordic Countries Smart Wheelchair Market Share Analysis (%), by Usage, 2021 & 2032
Figure 115: Nordic Countries Smart Wheelchair Market Share Analysis (%), by End User, 2021 & 2032
Figure 116: South Asia Smart Wheelchair Market Share Analysis (%), by Country (2022)
Figure 117: South Asia Smart Wheelchair Market Share Analysis (%), by Product (2022)
Figure 118: South Asia Smart Wheelchair Market Share Analysis (%), by Usage (2022)
Figure 119: South Asia Smart Wheelchair Market Share Analysis (%), by End User (2022)
Figure 120: South Asia Smart Wheelchair Historical Market Value (US$ Mn) Analysis, 2012–2021
Figure 121: South Asia Smart Wheelchair Current and Future Market Value (US$ Mn), 2022-2032 & Y-o-Y Growth Trend Analysis
Figure 122: South Asia Smart Wheelchair Market Attractiveness Analysis, by Country
Figure 123: South Asia Smart Wheelchair Market Attractiveness Analysis, by Product
Figure 124: South Asia Smart Wheelchair Market Attractiveness Analysis, by Usage
Figure 125: South Asia Smart Wheelchair Market Attractiveness Analysis, by End User
Figure 126: India Market Value Proportion Analysis, 2021
Figure 127: Global Vs India Y-o-Y Growth Comparison, 2021-2032
Figure 128: India Smart Wheelchair Market Share Analysis (%), by Product, 2021 & 2032
Figure 129: India Smart Wheelchair Market Share Analysis (%), by Usage, 2021 & 2032
Figure 130: India Smart Wheelchair Market Share Analysis (%), by End User, 2021 & 2032
Figure 131: Thailand Market Value Proportion Analysis, 2021
Figure 132: Global Vs Thailand Y-o-Y Growth Comparison, 2021-2032
Figure 133: Thailand Smart Wheelchair Market Share Analysis (%), by Product, 2021 & 2032
Figure 134: Thailand Smart Wheelchair Market Share Analysis (%), by Usage, 2021 & 2032
Figure 135: Thailand Smart Wheelchair Market Share Analysis (%), by End User, 2021 & 2032
Figure 136: Indonesia Market Value Proportion Analysis, 2021
Figure 137: Global Vs Indonesia Y-o-Y Growth Comparison, 2021-2032
Figure 138: Indonesia Smart Wheelchair Market Share Analysis (%), by Product, 2021 & 2032
Figure 139: Indonesia Smart Wheelchair Market Share Analysis (%), by Usage, 2021 & 2032
Figure 140: Indonesia Smart Wheelchair Market Share Analysis (%), by End User, 2021 & 2032
Figure 141: Malaysia Market Value Proportion Analysis, 2021
Figure 142: Global Vs Malaysia Y-o-Y Growth Comparison, 2021-2032
Figure 143: Malaysia Smart Wheelchair Market Share Analysis (%), by Product, 2021 & 2032
Figure 144: Malaysia Smart Wheelchair Market Share Analysis (%), by Usage, 2021 & 2032
Figure 145: Malaysia Smart Wheelchair Market Share Analysis (%), by End User, 2021 & 2032
Figure 146: Philippines Market Value Proportion Analysis, 2021
Figure 147: Global Vs Philippines Y-o-Y Growth Comparison, 2021-2032
Figure 148: Philippines Smart Wheelchair Market Share Analysis (%), by Product, 2021 & 2032
Figure 149: Philippines Smart Wheelchair Market Share Analysis (%), by Usage, 2021 & 2032
Figure 150: Philippines Smart Wheelchair Market Share Analysis (%), by End User, 2021 & 2032
Figure 151: East Asia Smart Wheelchair Market Share Analysis (%), by Country (2022)
Figure 152: East Asia Smart Wheelchair Market Share Analysis (%), by Product (2022)
Figure 153: East Asia Smart Wheelchair Market Share Analysis (%), by Usage (2022)
Figure 154: East Asia Smart Wheelchair Market Share Analysis (%), by End User (2022)
Figure 155: East Asia Smart Wheelchair Historical Market Value (US$ Mn) Analysis, 2012–2021
Figure 156: East Asia Smart Wheelchair Current and Future Market Value (US$ Mn), 2022-2032 & Y-o-Y Growth Trend Analysis
Figure 157: East Asia Smart Wheelchair Market Attractiveness Analysis, by Country
Figure 158: East Asia Smart Wheelchair Market Attractiveness Analysis, by Product
Figure 159: East Asia Smart Wheelchair Market Attractiveness Analysis, by Usage
Figure 160: East Asia Smart Wheelchair Market Attractiveness Analysis, by End User
Figure 161: China Market Value Proportion Analysis, 2021
Figure 162: Global Vs China Y-o-Y Growth Comparison, 2021-2032
Figure 163: China Smart Wheelchair Market Share Analysis (%), by Product, 2021 & 2032
Figure 164: China Smart Wheelchair Market Share Analysis (%), by Usage, 2021 & 2032
Figure 165: China Smart Wheelchair Market Share Analysis (%), by End User, 2021 & 2032
Figure 166: Japan Market Value Proportion Analysis, 2021
Figure 167: Global Vs Japan Y-o-Y Growth Comparison, 2021-2032
Figure 168: Japan Smart Wheelchair Market Share Analysis (%), by Product, 2021 & 2032
Figure 169: Japan Smart Wheelchair Market Share Analysis (%), by Usage, 2021 & 2032
Figure 170: Japan Smart Wheelchair Market Share Analysis (%), by End User, 2021 & 2032
Figure 171: South Korea Market Value Proportion Analysis, 2021
Figure 172: Global Vs South Korea Y-o-Y Growth Comparison, 2021-2032
Figure 173: South Korea Smart Wheelchair Market Share Analysis (%), by Product, 2021 & 2032
Figure 174: South Korea Smart Wheelchair Market Share Analysis (%), by Usage, 2021 & 2032
Figure 175: South Korea Smart Wheelchair Market Share Analysis (%), by End User, 2021 & 2032
Figure 176: Oceania Smart Wheelchair Market Share Analysis (%), by Country (2022)
Figure 177: Oceania Smart Wheelchair Market Share Analysis (%), by Product (2022)
Figure 178: Oceania Smart Wheelchair Market Share Analysis (%), by Usage (2022)
Figure 179: Oceania Smart Wheelchair Market Share Analysis (%), by End User (2022)
Figure 180: Oceania Smart Wheelchair Historical Market Value (US$ Mn) Analysis, 2012–2021
Figure 181: Oceania Smart Wheelchair Current and Future Market Value (US$ Mn), 2022-2032 & Y-o-Y Growth Trend Analysis
Figure 182: Oceania Smart Wheelchair Market Attractiveness Analysis, by Country
Figure 183: Oceania Smart Wheelchair Market Attractiveness Analysis, by Product
Figure 184: Oceania Smart Wheelchair Market Attractiveness Analysis, by Usage
Figure 185: Oceania Smart Wheelchair Market Attractiveness Analysis, by End User
Figure 186: Australia Market Value Proportion Analysis, 2021
Figure 187: Global Vs Australia Y-o-Y Growth Comparison, 2021-2032
Figure 188: Australia Smart Wheelchair Market Share Analysis (%), by Product, 2021 & 2032
Figure 189: Australia Smart Wheelchair Market Share Analysis (%), by Usage, 2021 & 2032
Figure 190: Australia Smart Wheelchair Market Share Analysis (%), by End User, 2021 & 2032
Figure 191: New Zealand Market Value Proportion Analysis, 2021
Figure 192: Global Vs New Zealand Y-o-Y Growth Comparison, 2021-2032
Figure 193: New Zealand Smart Wheelchair Market Share Analysis (%), by Product, 2021 & 2032
Figure 194: New Zealand Smart Wheelchair Market Share Analysis (%), by Usage, 2021 & 2032
Figure 195: New Zealand Smart Wheelchair Market Share Analysis (%), by End User, 2021 & 2032
Figure 196: Middle East and Africa Smart Wheelchair Market Share Analysis (%), by Country (2022)
Figure 197: Middle East and Africa Smart Wheelchair Market Share Analysis (%), by Product (2022)
Figure 198: Middle East and Africa Smart Wheelchair Market Share Analysis (%), by Usage (2022)
Figure 199: Middle East and Africa Smart Wheelchair Market Share Analysis (%), by End User (2022)
Figure 200: Middle East and Africa Smart Wheelchair Historical Market Value (US$ Mn) Analysis, 2012–2021
Figure 201: Middle East and Africa Smart Wheelchair Current and Future Market Value (US$ Mn), 2022-2032 & Y-o-Y Growth Trend Analysis
Figure 202: Middle East and Africa Smart Wheelchair Market Attractiveness Analysis, by Country
Figure 203: Middle East and Africa Smart Wheelchair Market Attractiveness Analysis, by Product
Figure 204: Middle East and Africa Smart Wheelchair Market Attractiveness Analysis, by Usage
Figure 205: Middle East and Africa Smart Wheelchair Market Attractiveness Analysis, by End User
Figure 206: GCC Countries Market Value Proportion Analysis, 2021
Figure 207: Global Vs GCC Countries Y-o-Y Growth Comparison, 2021-2032
Figure 208: GCC Countries Smart Wheelchair Market Share Analysis (%), by Product, 2021 & 2032
Figure 209: GCC Countries Smart Wheelchair Market Share Analysis (%), by Usage, 2021 & 2032
Figure 210: GCC Countries Smart Wheelchair Market Share Analysis (%), by End User, 2021 & 2032
Figure 211: Israel Market Value Proportion Analysis, 2021
Figure 212: Global Vs Israel Y-o-Y Growth Comparison, 2021-2032
Figure 213: Israel Smart Wheelchair Market Share Analysis (%), by Product, 2021 & 2032
Figure 214: Israel Smart Wheelchair Market Share Analysis (%), by Usage, 2021 & 2032
Figure 215: Israel Smart Wheelchair Market Share Analysis (%), by End User, 2021 & 2032
Figure 216: Turkey Market Value Proportion Analysis, 2021
Figure 217: Global Vs Turkey Y-o-Y Growth Comparison, 2021-2032
Figure 218: Turkey Smart Wheelchair Market Share Analysis (%), by Product, 2021 & 2032
Figure 219: Turkey Smart Wheelchair Market Share Analysis (%), by Usage, 2021 & 2032
Figure 220: Turkey Smart Wheelchair Market Share Analysis (%), by End User, 2021 & 2032
Figure 221: North Africa Market Value Proportion Analysis, 2021
Figure 222: Global Vs North Africa Y-o-Y Growth Comparison, 2021-2032
Figure 223: North Africa Smart Wheelchair Market Share Analysis (%), by Product, 2021 & 2032
Figure 224: North Africa Smart Wheelchair Market Share Analysis (%), by Usage, 2021 & 2032
Figure 225: North Africa Smart Wheelchair Market Share Analysis (%), by End User, 2021 & 2032
Figure 226: South Africa Market Value Proportion Analysis, 2021
Figure 227: Global Vs South Africa Y-o-Y Growth Comparison, 2021-2032
Figure 228: South Africa Smart Wheelchair Market Share Analysis (%), by Product, 2021 & 2032
Figure 229: South Africa Smart Wheelchair Market Share Analysis (%), by Usage, 2021 & 2032
Figure 230: South Africa Smart Wheelchair Market Share Analysis (%), by End User, 2021 & 2032
Figure 231: Rest of MEA Market Value Proportion Analysis, 2021
Figure 232: Global Vs Rest of MEA Y-o-Y Growth Comparison, 2021-2032
Figure 233: Rest of MEA Smart Wheelchair Market Share Analysis (%), by Product, 2021 & 2032
Figure 234: Rest of MEA Smart Wheelchair Market Share Analysis (%), by Usage, 2021 & 2032
Figure 235: Rest of MEA Smart Wheelchair Market Share Analysis (%), by End User, 2021 & 2032
Need specific information?
Request CustomizationExplore Healthcare Insights
View Reports