Smart Tools Market Size and Share Forecast Outlook 2025 to 2035

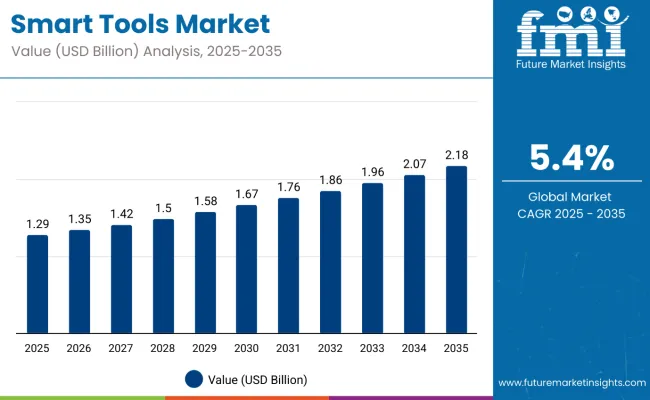
The global smart tools market is projected to grow from USD 1.29 billion in 2025 to approximately USD 2.18 billion by 2035, marking an absolute increase of USD 890 million over the decade. This growth reflects a total expansion of 68.9%, with the market forecast to advance at a compound annual growth rate (CAGR) of 5.4% during the 2025 to 2035 period.

The total market size is expected to grow by nearly 1.7X by the end of the forecast window, supported by the integration of sensor-based diagnostics, predictive analytics, and IoT connectivity in professional-grade and industrial tool applications.
Quick Stats - Smart Tools Market

  • Industry Value (2025): USD 1.29 billion
  • Forecast Value (2035): USD 2.18 billion
  • Forecast CAGR: 5.4%
  • Leading Product (2025): Drills and Drivers (33% share)
  • Key Growth Region: China (7.2% CAGR)
  • Top Key Players: Stanley Black & Decker, Techtronic Industries Co., Ltd., Robert Bosch GmbH, Makita Corporation, Hilti Corporation

Smart Tools Market

Metric Value
Industry Size (2025E) USD 1.29 billion
Industry Size (2035F) USD 2.18 billion
CAGR 2025 to 2035 5.4%

Between 2025 and 2030, the smart tools market is expected to expand from USD 1.29 billion to USD 1.67 billion, resulting in a value addition of USD 0.38 billion, which accounts for approximately 42.7% of the total decade-long growth.

This phase is likely to be characterized by growing penetration of torque-limiting, calibration-enabled, and digitally programmable tools across automotive service centers, aerospace assembly lines, and precision engineering segments. Investments in connected manufacturing and the adoption of Industry 4.0 protocols are expected to strengthen demand across North America, Germany, Japan, and South Korea.

From 2030 to 2035, the market is projected to increase from USD 1.67 billion to USD 2.18 billion, adding another USD 510 million or 57.3% of total forecast growth. During this second half of the decade, demand is anticipated to accelerate due to widespread implementation of condition-monitoring tools, smart fastening systems, and integrated tool-data platforms in production workflows.

This shift is expected to be reinforced by labor optimization efforts, enhanced worker safety standards, and the expansion of AI-driven tool usage across high-volume manufacturing hubs in China, India, and Mexico.

From 2020 to 2025, the smart tools market expanded from USD 1.03 billion to USD 1.29 billion, reflecting a value increase of USD 260 million. This steady growth was supported by early-stage digitization in industrial tooling systems and a rising focus on productivity and safety within maintenance, repair, and overhaul (MRO) operations. Adoption was led by automotive and aerospace OEMs, where programmable torque tools, electronic wrenches, and battery-powered smart drivers improved error-proofing, reduced rework, and enabled data capture for quality traceability.

Manufacturing sectors in the United States, Germany, and Japan demonstrated early uptake of sensor-integrated tools for assembly and inspection tasks. The deployment of smart torque and angle control tools became prevalent in electronics assembly lines, supported by regulatory emphasis on ESD-safe tools and real-time data validation. Tool manufacturers introduced wireless connectivity, modular attachments, and in-built calibration tracking to align with industry requirements for operational intelligence and predictive maintenance.

Analyzing Smart Tools Market by Top Investment Segments

The market is segmented by tool type into drills and drivers, saws, sanders and grinders, outdoor power equipment, and measuring tools, each designed to fulfill distinct operational needs. Based on connectivity and smart capabilities, classifications include Bluetooth-only tools, Wi-Fi-only variants, hybrid models combining both, and tools with app-based control and monitoring functions.

Power source segmentation is divided into cordless battery-powered tools and corded plug-in types. In terms of end-user, the market is distributed across DIY and home users, professional construction teams, infrastructure projects, manufacturing and assembly lines, maintenance and repair operations, as well as the oil and gas, utilities, telecommunications, transportation, and logistics sectors.
Drills and drivers remain the most adopted tool category

Smart Tools Market By Product Type

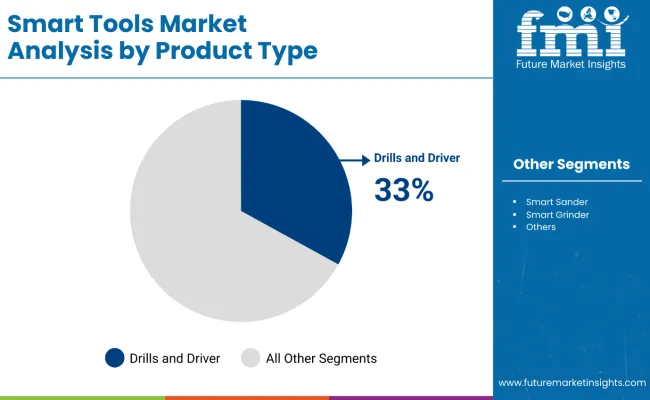
Drills and drivers are estimated to hold 33% of the global smart tools market in 2025, supported by their multipurpose use across DIY, industrial, and professional segments. Their integration with smart sensors and torque control features has improved reliability and process automation in fastening and assembly. Cordless compatibility and growing demand for compact toolsets have further reinforced their dominance, especially in environments requiring flexible and mobile power tool solutions.
Wi-Fi only tools lead among connected formats

Smart Tools Market By Coonectivity

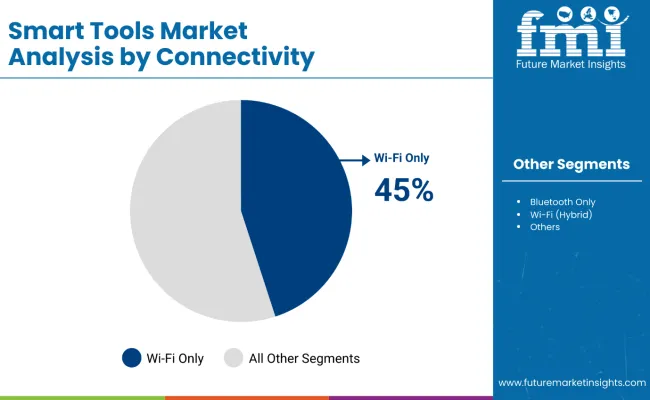
Wi-Fi-only smart tools are projected to contribute 45% of overall market revenue in 2025, driven by demand for seamless integration with enterprise platforms and cloud-based asset monitoring systems. These tools have gained widespread use in factory floors, utilities, and infrastructure maintenance where high-bandwidth connectivity enables real-time updates, remote diagnostics, and operational analytics.
Cordless power tools continue to outperform corded alternatives

Smart Tools Market By Power Source

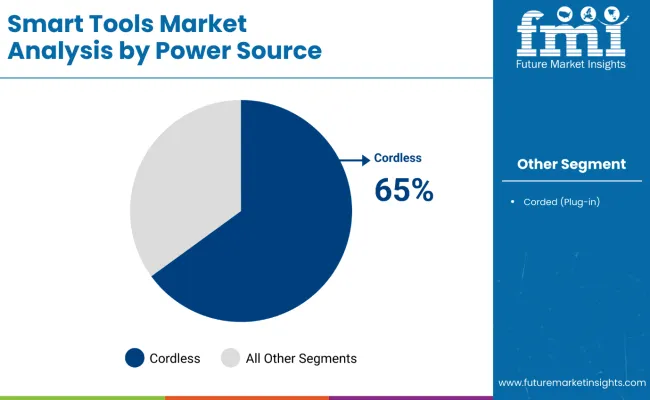
Cordless, battery-powered tools are expected to account for 65% of total sales in 2025, reflecting user preference for enhanced mobility, minimal setup time, and cable-free operation. Improvements in lithium-ion battery technology, fast charging, and smart battery management systems have increased usage across on-site service, construction, and emergency maintenance applications. Their rising adoption is also supported by ergonomic tool designs and declining battery replacement costs.
DIY and home improvement segment drives notable demand

Smart Tools Market By End User

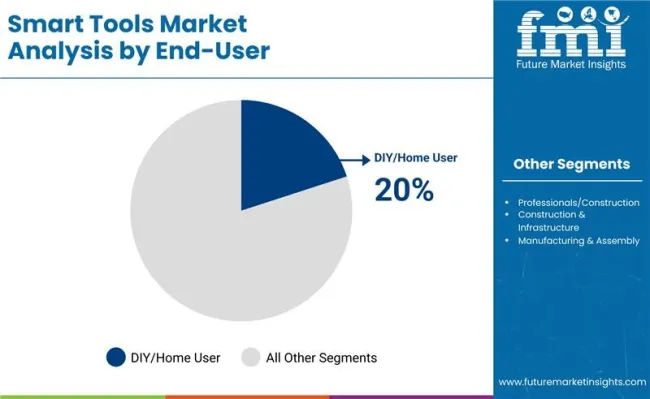
DIY and home users are projected to represent 20% of the market in 2025, reflecting increasing penetration of smart tools in residential applications. Features such as mobile app compatibility, automated control settings, and safety feedback alerts have made smart tools more appealing for home improvement tasks. Online retail channels and bundled tool kits have expanded access for this user group, especially in developed markets where personal ownership of tools is rising.

Why the Smart Tools Market is Growing?

Growth in the smart tools market is being supported by the convergence of Industry 4.0 deployment, demand for operator safety, and the rising importance of traceable assembly operations. As manufacturing facilities transition toward connected ecosystems, the need for intelligent tools that can provide torque control, usage analytics, and automated calibration alerts has gained traction. These features are enabling better compliance with quality standards in industries such as automotive, electronics, and aerospace.

Labor shortages in skilled trades are also encouraging adoption of programmable tools that reduce operator error and simplify complex procedures. End users are increasingly preferring solutions that integrate directly with MES (Manufacturing Execution Systems) or ERP platforms, allowing production data to be recorded and analyzed in real time. Product development is focusing on integrating wireless communication protocols (Bluetooth, WLAN), ergonomic designs, and embedded diagnostics to support predictive maintenance and fleet-level tool management.

Key Trends Shaping the Market

The smart tools market is being driven by automation in industrial workflows, growing need for traceable torque application, and rising compliance with quality management standards across critical sectors. However, adoption is limited by high upfront costs, interoperability challenges with legacy systems, and sensitivity of digital tools in harsh environments.

The lack of skilled operators to handle calibration, diagnostics, and software integration also presents a constraint in mid-scale facilities. Despite these challenges, ongoing advancements in connectivity, miniaturization, and embedded intelligence are shaping next-generation tool platforms.

Connected Assembly Driving Demand for Real-Time Traceability

Tool integration into digital assembly environments is becoming a standard requirement in industries such as automotive, aerospace, and electronics. Smart torque wrenches, angle sensors, and programmable fastening tools are enabling real-time validation, reducing assembly errors, and generating audit trails. This is particularly relevant for high-mix, low-volume production environments where quality and consistency are critical.

Embedded Diagnostics and Predictive Maintenance Expand Industrial Appeal

The ability to track tool usage, predict component wear, and automate calibration alerts is increasing adoption in maintenance-heavy sectors. Predictive maintenance reduces downtime and extends tool life, while also supporting safety protocols by ensuring that tools operate within defined tolerances. These capabilities are being expanded to cover battery management, motor diagnostics, and pressure/load conditions in hand tools and powered systems.

Europe Market Split by Country

Country Value Share 2025
Germany 25%
UK 18%
France 16%
Italy 11%
Spain 8%
BENELUX 7%
Russia 5%
Rest of Europe 10%
Country Value Share 2035
Germany 23%
UK 17%
France 17%
Italy 12%
Spain 9%
BENELUX 8%
Russia 4%
Rest of Europe 10%

Germany is projected to remain the leading market for smart tools in Europe, although its share is expected to decline from 25% in 2025 to 23% by 2035, primarily due to maturing demand and stronger growth in neighboring countries. The United Kingdom will follow with a share moving from 18% to 17%, supported by sustained investment in aerospace and electric vehicle manufacturing, though growth may plateau as local capacity stabilizes.

France is forecast to increase its share slightly from 16% to 17%, driven by factory automation in electronics and defense applications. Italy is projected to grow from 11% to 12%, reflecting rising adoption of smart torque and calibration tools in machinery and automotive components manufacturing. Spain’s market share is expected to improve from 8% to 9%, supported by light industrial expansion and localized electronics assembly.

The BENELUX region is forecast to grow from 7% to 8%, led by precision tool adoption in semiconductor and pharma sectors. Russia is expected to see a drop in share from 5% to 4%, largely due to ongoing import limitations and economic constraints.
Key Countries Growth Outlook

Smart Tools Market Country Wise Analysis

China leads smart manufacturing adoption

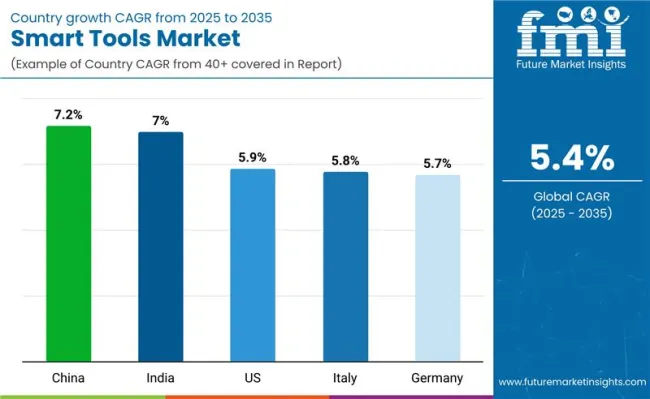
China’s smart tools market is projected to expand at the fastest CAGR of 7.2% between 2025 and 2035. Investments in smart factories and digital assembly lines continue to drive demand for connected, calibrated, and sensor-embedded tools across automotive, electronics, and heavy industry sectors.

  • Integration of Bluetooth-enabled tools in EV and appliance manufacturing
  • Government-led automation upgrades in Tier-2 industrial zones
  • Precision assembly demand from export-focused manufacturers
  • Emphasis on reducing downtime through predictive tool diagnostics

India accelerates tooling upgrades in SME clusters

India’s smart tools market is forecast to grow at a CAGR of 7.0%, supported by rising awareness and government incentives for industrial digitization. Adoption is strong among small and mid-sized manufacturers involved in electronics, automotive parts, and contract machining.
  • Smart torque tools deployed in PLI-backed auto component hubs
  • Growing demand in medical device and solar manufacturing sectors
  • Skill development initiatives promoting smart tool usage
  • High replacement rate in informal manufacturing ecosystems

United States strengthens retrofit demand for precision tools

United States Of Smart Tools Market

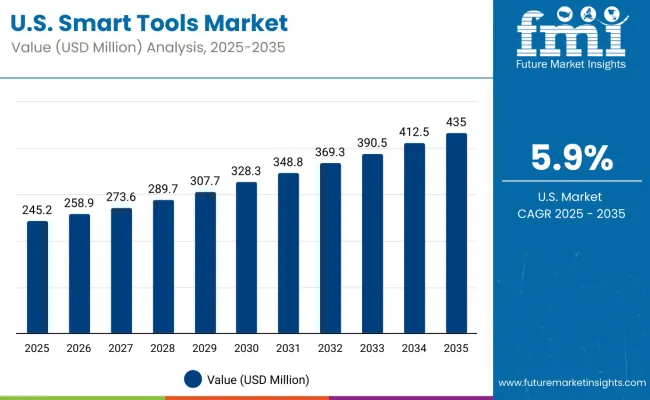
The USA is expected to register a 5.9% CAGR, driven by factory retrofits, aerospace and defense tooling upgrades, and increased adoption of predictive maintenance solutions. Demand is high for tools with integrated telemetry, usage tracking, and remote diagnostics.

  • Aerospace assembly and MRO units integrating digital torque tools
  • Expansion of smart tool fleets across automotive Tier 1 suppliers
  • Emphasis on operational efficiency in logistics and industrial packaging
  • Tool performance data increasingly linked to QA benchmarks

Italy prioritizes high-speed CNC integration

Italy’s market is projected to grow at 5.8% CAGR as CNC machining, automotive assembly, and industrial subcontracting shift toward connected tooling. Manufacturers are embedding smart measurement and fastening tools into digitized production environments.

  • Smart tools enhancing productivity in luxury automotive plants
  • CNC and high-speed machining centers deploying automated calibration
  • Usage growing in food packaging and pharmaceutical equipment manufacturing
  • Increased tool lifecycle tracking across contract fabrication units

Germany focuses on traceability in advanced manufacturing

Germany is set to expand at 5.7% CAGR, supported by its emphasis on data-driven quality control and productivity. Precision tooling is increasingly integrated with ERP and MES platforms across manufacturing clusters in the southern and western regions.

  • Strong demand from robotics, automation, and battery module lines
  • Tier 1 industrial suppliers standardizing smart torque platforms
  • Tool monitoring integrated with factory analytics dashboards
  • Advanced calibration and tool diagnostics gaining procurement traction

Cordless designs dominate tool selection in Japan

In Japan, cordless smart tools are projected to account for 70% of the total market by 2025. Compact industrial setups, ergonomic prioritization, and growing use in confined factory floors have contributed to widespread adoption of battery-powered solutions. Corded tools still retain a 30% share, largely in high-precision assembly lines and applications requiring consistent power supply. This power source distribution aligns with Japan’s emphasis on quiet operation, modular workspaces, and energy-efficient devices.

  • Cordless tools deployed in modular automotive and electronics assembly lines
  • Demand growing from OEMs engaged in EV battery and drive unit assembly
  • Corded tools preferred in high-speed fabrication and metrology labs
  • Industrial tool procurement increasingly driven by total mobility and uptime

Hybrid connectivity gains traction in South Korea’s digital tool systems

South Korea’s market shows a preference for tools with Bluetooth-only connectivity, commanding a 40% share in 2025. Hybrid smart tools that combine both Bluetooth and Wi-Fi functionality are projected to account for 25%, offering flexibility across shop floor networks. App-based control and diagnostics tools represent 15% of the market, supporting localized automation in smart factories. Tools relying solely on Wi-Fi connectivity hold a 20% share, primarily used in fixed automation lines or integrated with cloud-based monitoring platforms.
  • Tier 1 suppliers deploying hybrid tools in EV and display component production
  • Wi-Fi tools used in stationary systems linked to plant-wide data hubs
  • Bluetooth-enabled tools driving adoption in mobile service and repair setups
  • App-controlled platforms favored in SMEs transitioning to Industry 4.0 models

Competition Outlook

Smart Tools Market By Company

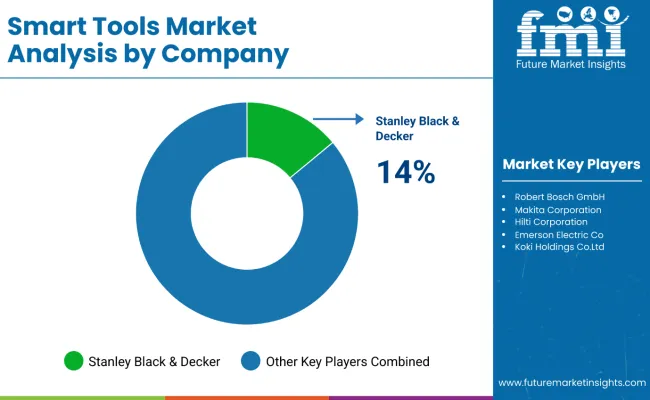
The smart tools market is being shaped by the integration of digital monitoring, connectivity, and predictive maintenance features into power tools. Tools with real-time diagnostics, adaptive performance control, and app-based analytics are being introduced to enhance operational efficiency, safety, and asset management. Wireless connectivity and ecosystem integration are enabling centralized fleet management, usage tracking, and preventive service alerts, particularly in industrial and construction applications.

  • In April 2024, Bosch Power Tools expanded its X-LOCK portfolio with the launch of a large angle grinder integrated with the X-LOCK interface, streamlining the process of changing accessories without the need for additional tools. Designed to improve operational efficiency and user safety, the grinder is compatible with Bosch’s connected tool ecosystem, which leverages Bluetooth modules and the Bosch Toolbox App for diagnostics, service alerts, and usage data. This development reinforces Bosch’s positioning within the evolving smart tools space, where integration of digital monitoring with power tools is enabling predictive maintenance and asset tracking across industrial and construction sectors.
  • In August 2024, BlackZero unveiled its next-generation smart brushless electric drills, introducing real-time torque control, adaptive RPM monitoring, and integrated app-based diagnostics for professional users. The drills are equipped with wireless connectivity for performance analytics and can sync with mobile platforms for task logging and tool usage optimization. BlackZero's smart drill system also features safety alerts for overload prevention and compatibility with a centralized tool fleet management dashboard, offering enhanced control for contractors and field service teams deploying distributed tool sets.

Companies

  • Stanley Black & Decker
  • Techtronic Industries Co., Ltd.
  • Robert Bosch GmbH
  • Makita Corporation
  • Hilti Corporation
  • Emerson Electric Co.
  • Koki Holdings Co., Ltd.
  • Andreas Stihl AG & Co. KG
  • Apex Tool Group, LLC
  • Chervon Group

Scope of the Report

Item Value
Quantitative Units USD 1.29 Billion (2025)
Product Type Smart Drills, Smart Wrenches, Smart Screwdrivers, Smart Sanders, Smart Grinders
Connectivity Bluetooth Only, Wi-Fi Only, Bluetooth + Wi-Fi (Hybrid), App-based Control & Monitoring
Power Source Cordless (Battery-Powered), Corded (Plug-in)
End Use Automotive, Aerospace, Industrial Machinery, Electronics Assembly, DIY & Professional Repair
Regions Covered North America, Europe, East Asia, South Asia & Pacific, Latin America, Middle East & Africa
Countries Covered United States, Germany, United Kingdom, Japan, China
Key Companies Profiled Stanley Black & Decker, Hilti Group, Robert Bosch GmbH, Makita Corporation, Snap-on Incorporated, Milwaukee Tool, Techtronic Industries Co. Ltd., Festool GmbH, Metabo HPT, Ingersoll Rand Inc.

Key Segments

By Tool Types:

  • Drills & Drivers
  • Saws
  • Sanders & Grinders
  • Outdoor Power Equipment
  • Measuring Tools

By Connectivity & Smart Features Types:

  • Bluetooth
  • Wi-Fi
  • Bluetooth + Wi-Fi (hybrid)
  • App-based control & monitoring

By Power Source Types:

  • Cordless (battery-powered)
  • Corded (plug-in)

By End User Types:

  • DIY/Home users
  • Professionals/Construction
  • Construction & Infrastructure
  • Manufacturing & Assembly
  • Maintenance, Repair, and Overhaul (MRO)
  • Oil & Gas / Energy
  • Utilities & Telecommunications
  • Transportation & Logistics

By Enterprise Size:

  • Large Enterprises
  • Small & Medium Sized Enterprises (SMEs)

By Region:

  • North America
  • Latin America
  • Western Europe
  • Eastern Europe
  • East Asia
  • South Asia & Pacific
  • Middle East & Africa

Table of Content

  1. Executive Summary
    • Global Market Outlook
    • Demand-side Trends
    • Supply-side Trends
    • Technology Roadmap Analysis
    • Analysis and Recommendations
  2. Market Overview
    • Market Coverage / Taxonomy
    • Market Definition / Scope / Limitations
  3. Market Background
    • Market Dynamics
      • Drivers
      • Restraints
      • Opportunity
      • Trends
    • Scenario Forecast
      • Demand in Optimistic Scenario
      • Demand in Likely Scenario
      • Demand in Conservative Scenario
    • Key Success Factors
    • Industry Developments
    • Supply Chain Analysis
      • Sourcing and Procurement
        • Raw Material / Component Suppliers
        • Technology Providers
      • Product Manufacturers
      • Channel Partners
      • End Users / Customers
    • Market Assessment Factors
      • Macro-economic Factors
      • Forecast Factors
  4. 3.10. Parent Market Outlook
  5. Global Market Analysis 2020 to 2024 and Forecast, 2025 to 2035
    • Historical Market Size Value (USD Billion) Analysis, 2020 to 2024
    • Current and Future Market Size Value (USD Billion) Projections, 2025 to 2035
      • Y-o-Y Growth Trend Analysis
      • Absolute $ Opportunity Analysis
  6. Global Market Pricing Analysis 2020 to 2024 and Forecast 2025 to 2035
  7. Global Market Analysis 2020 to 2024 and Forecast 2025 to 2035, By Tool Types
    • Introduction / Key Findings
    • Historical Market Size Value (USD Billion) Analysis By Tool Types , 2020 to 2024
    • Current and Future Market Size Value (USD Billion) Analysis and Forecast By Tool Types , 2025 to 2035
      • Drills & Drivers
      • Saws
      • Sanders & Grinders
      • Outdoor Power Equipment
      • Measuring Tools
    • Y-o-Y Growth Trend Analysis By Tool Types , 2020 to 2024
    • Absolute $ Opportunity Analysis By Tool Types , 2025 to 2035
  8. Global Market Analysis 2020 to 2024 and Forecast 2025 to 2035, By Connectivity & Smart Features Types
    • Introduction / Key Findings
    • Historical Market Size Value (USD Billion) Analysis By Connectivity & Smart Features Types , 2020 to 2024
    • Current and Future Market Size Value (USD Billion) Analysis and Forecast By Connectivity & Smart Features Types , 2025 to 2035
      • Bluetooth
      • Wi-Fi
      • Bluetooth + Wi-Fi (hybrid)
      • App-based control & monitoring
    • Y-o-Y Growth Trend Analysis By Connectivity & Smart Features Types , 2020 to 2024
    • Absolute $ Opportunity Analysis By Connectivity & Smart Features Types , 2025 to 2035
  9. Global Market Analysis 2020 to 2024 and Forecast 2025 to 2035, By Power Source Types
    • Introduction / Key Findings
    • Historical Market Size Value (USD Billion) Analysis By Power Source Types, 2020 to 2024
    • Current and Future Market Size Value (USD Billion) Analysis and Forecast By Power Source Types, 2025 to 2035
      • Cordless (battery-powered)
      • Corded (plug-in)
    • Y-o-Y Growth Trend Analysis By Power Source Types, 2020 to 2024
    • Absolute $ Opportunity Analysis By Power Source Types, 2025 to 2035
  10. Global Market Analysis 2020 to 2024 and Forecast 2025 to 2035, By End User Types
    • Introduction / Key Findings
    • Historical Market Size Value (USD Billion) Analysis By End User Types , 2020 to 2024
    • Current and Future Market Size Value (USD Billion) Analysis and Forecast By End User Types , 2025 to 2035
      • DIY/Home users
      • Professionals/Construction
      • Construction & Infrastructure
      • Manufacturing & Assembly
      • Maintenance, Repair, and Overhaul (MRO)
      • Oil & Gas / Energy
      • Utilities & Telecommunications
      • Transportation & Logistics
    • Y-o-Y Growth Trend Analysis By End User Types , 2020 to 2024
    • Absolute $ Opportunity Analysis By End User Types , 2025 to 2035
  11. Global Market Analysis 2020 to 2024 and Forecast 2025 to 2035, By Enterprise Size
    • Introduction / Key Findings
    • Historical Market Size Value (USD Billion) Analysis By Enterprise Size, 2020 to 2024
    • Current and Future Market Size Value (USD Billion) Analysis and Forecast By Enterprise Size, 2025 to 2035
      • Large Enterprises
      • Small & Medium Sized Enterprises (SMEs)
    • Y-o-Y Growth Trend Analysis By Enterprise Size, 2020 to 2024
    • Absolute $ Opportunity Analysis By Enterprise Size, 2025 to 2035
  12. Global Market Analysis 2020 to 2024 and Forecast 2025 to 2035, By Region
    • Introduction
    • Historical Market Size Value (USD Billion) Analysis By Region, 2020 to 2024
    • Current Market Size Value (USD Billion) Analysis and Forecast By Region, 2025 to 2035
      • North America
      • Latin America
      • Western Europe
      • Eastern Europe
      • East Asia
      • South Asia & Pacific
      • Middle East & Africa
    • Market Attractiveness Analysis By Region
  13. North America Market Analysis 2020 to 2024 and Forecast 2025 to 2035, By Country
    • Historical Market Size Value (USD Billion) Trend Analysis By Market Taxonomy, 2020 to 2024
    • Market Size Value (USD Billion) Forecast By Market Taxonomy, 2025 to 2035
      • By Country
        • USA
        • Canada
        • Mexico
      • By Tool Types
      • By Connectivity & Smart Features Types
      • By Power Source Types
      • By End User Types
      • By Enterprise Size
    • Market Attractiveness Analysis
      • By Country
      • By Tool Types
      • By Connectivity & Smart Features Types
      • By Power Source Types
      • By End User Types
      • By Enterprise Size
    • Key Takeaways
  14. Latin America Market Analysis 2020 to 2024 and Forecast 2025 to 2035, By Country
    • Historical Market Size Value (USD Billion) Trend Analysis By Market Taxonomy, 2020 to 2024
    • Market Size Value (USD Billion) Forecast By Market Taxonomy, 2025 to 2035
      • By Country
        • Brazil
        • Argentina
        • Rest of Latin America
      • By Tool Types
      • By Connectivity & Smart Features Types
      • By Power Source Types
      • By End User Types
      • By Enterprise Size
    • Market Attractiveness Analysis
      • By Country
      • By Tool Types
      • By Connectivity & Smart Features Types
      • By Power Source Types
      • By End User Types
      • By Enterprise Size
    • Key Takeaways
  15. Western Europe Market Analysis 2020 to 2024 and Forecast 2025 to 2035, By Country
    • Historical Market Size Value (USD Billion) Trend Analysis By Market Taxonomy, 2020 to 2024
    • Market Size Value (USD Billion) Forecast By Market Taxonomy, 2025 to 2035
      • By Country
        • Germany
        • Italy
        • France
        • UK
        • Spain
        • BENELUX
        • Nordics
        • Rest of W. Europe
      • By Tool Types
      • By Connectivity & Smart Features Types
      • By Power Source Types
      • By End User Types
      • By Enterprise Size
    • Market Attractiveness Analysis
      • By Country
      • By Tool Types
      • By Connectivity & Smart Features Types
      • By Power Source Types
      • By End User Types
      • By Enterprise Size
    • Key Takeaways
  16. Eastern Europe Market Analysis 2020 to 2024 and Forecast 2025 to 2035, By Country
    • Historical Market Size Value (USD Billion) Trend Analysis By Market Taxonomy, 2020 to 2024
    • Market Size Value (USD Billion) Forecast By Market Taxonomy, 2025 to 2035
      • By Country
        • Hungary
        • Poland
        • Russia
        • Balkan & Baltics
        • Rest of E.Europe
      • By Tool Types
      • By Connectivity & Smart Features Types
      • By Power Source Types
      • By End User Types
      • By Enterprise Size
    • Market Attractiveness Analysis
      • By Country
      • By Tool Types
      • By Connectivity & Smart Features Types
      • By Power Source Types
      • By End User Types
      • By Enterprise Size
    • Key Takeaways
  17. East Asia Market Analysis 2020 to 2024 and Forecast 2025 to 2035, By Country
    • Historical Market Size Value (USD Billion) Trend Analysis By Market Taxonomy, 2020 to 2024
    • Market Size Value (USD Billion) Forecast By Market Taxonomy, 2025 to 2035
      • By Country
        • China
        • Japan
        • South Korea
      • By Tool Types
      • By Connectivity & Smart Features Types
      • By Power Source Types
      • By End User Types
      • By Enterprise Size
    • Market Attractiveness Analysis
      • By Country
      • By Tool Types
      • By Connectivity & Smart Features Types
      • By Power Source Types
      • By End User Types
      • By Enterprise Size
    • Key Takeaways
  18. South Asia & Pacific Market Analysis 2020 to 2024 and Forecast 2025 to 2035, By Country
    • Historical Market Size Value (USD Billion) Trend Analysis By Market Taxonomy, 2020 to 2024
    • Market Size Value (USD Billion) Forecast By Market Taxonomy, 2025 to 2035
      • By Country
        • India
        • ASEAN
        • Australia & New Zealand
      • By Tool Types
      • By Connectivity & Smart Features Types
      • By Power Source Types
      • By End User Types
      • By Enterprise Size
    • Market Attractiveness Analysis
      • By Country
      • By Tool Types
      • By Connectivity & Smart Features Types
      • By Power Source Types
      • By End User Types
      • By Enterprise Size
    • Key Takeaways
  19. Middle East & Africa Market Analysis 2020 to 2024 and Forecast 2025 to 2035, By Country
    • Historical Market Size Value (USD Billion) Trend Analysis By Market Taxonomy, 2020 to 2024
    • Market Size Value (USD Billion) Forecast By Market Taxonomy, 2025 to 2035
      • By Country
        • GCC Countries
        • Turkiye
        • Northern Africa
        • South Africa
        • Rest of MEA
      • By Tool Types
      • By Connectivity & Smart Features Types
      • By Power Source Types
      • By End User Types
      • By Enterprise Size
    • Market Attractiveness Analysis
      • By Country
      • By Tool Types
      • By Connectivity & Smart Features Types
      • By Power Source Types
      • By End User Types
      • By Enterprise Size
    • Key Takeaways
  20. Key Countries Market Analysis
    • USA
      • Pricing Analysis
      • Market Share Analysis, 2024
        • By Tool Types
        • By Connectivity & Smart Features Types
        • By Power Source Types
        • By End User Types
        • By Enterprise Size
    • Canada
      • Pricing Analysis
      • Market Share Analysis, 2024
        • By Tool Types
        • By Connectivity & Smart Features Types
        • By Power Source Types
        • By End User Types
        • By Enterprise Size
    • Mexico
      • Pricing Analysis
      • Market Share Analysis, 2024
        • By Tool Types
        • By Connectivity & Smart Features Types
        • By Power Source Types
        • By End User Types
        • By Enterprise Size
    • Brazil
      • Pricing Analysis
      • Market Share Analysis, 2024
        • By Tool Types
        • By Connectivity & Smart Features Types
        • By Power Source Types
        • By End User Types
        • By Enterprise Size
    • Argentina
      • Pricing Analysis
      • Market Share Analysis, 2024
        • By Tool Types
        • By Connectivity & Smart Features Types
        • By Power Source Types
        • By End User Types
        • By Enterprise Size
    • Germany
      • Pricing Analysis
      • Market Share Analysis, 2024
        • By Tool Types
        • By Connectivity & Smart Features Types
        • By Power Source Types
        • By End User Types
        • By Enterprise Size
    • Italy
      • Pricing Analysis
      • Market Share Analysis, 2024
        • By Tool Types
        • By Connectivity & Smart Features Types
        • By Power Source Types
        • By End User Types
        • By Enterprise Size
    • France
      • Pricing Analysis
      • Market Share Analysis, 2024
        • By Tool Types
        • By Connectivity & Smart Features Types
        • By Power Source Types
        • By End User Types
        • By Enterprise Size
    • UK
      • Pricing Analysis
      • Market Share Analysis, 2024
        • By Tool Types
        • By Connectivity & Smart Features Types
        • By Power Source Types
        • By End User Types
        • By Enterprise Size
    • Spain
      • Pricing Analysis
      • Market Share Analysis, 2024
        • By Tool Types
        • By Connectivity & Smart Features Types
        • By Power Source Types
        • By End User Types
        • By Enterprise Size
    • BENELUX
      • Pricing Analysis
      • Market Share Analysis, 2024
        • By Tool Types
        • By Connectivity & Smart Features Types
        • By Power Source Types
        • By End User Types
        • By Enterprise Size
    • Nordics
      • Pricing Analysis
      • Market Share Analysis, 2024
        • By Tool Types
        • By Connectivity & Smart Features Types
        • By Power Source Types
        • By End User Types
        • By Enterprise Size
    • Russia
      • Pricing Analysis
      • Market Share Analysis, 2024
        • By Tool Types
        • By Connectivity & Smart Features Types
        • By Power Source Types
        • By End User Types
        • By Enterprise Size
    • Hungary
      • Pricing Analysis
      • Market Share Analysis, 2024
        • By Tool Types
        • By Connectivity & Smart Features Types
        • By Power Source Types
        • By End User Types
        • By Enterprise Size
    • Poland
      • Pricing Analysis
      • Market Share Analysis, 2024
        • By Tool Types
        • By Connectivity & Smart Features Types
        • By Power Source Types
        • By End User Types
        • By Enterprise Size
    • Balkan & Baltics
      • Pricing Analysis
      • Market Share Analysis, 2024
        • By Tool Types
        • By Connectivity & Smart Features Types
        • By Power Source Types
        • By End User Types
        • By Enterprise Size
    • China
      • Pricing Analysis
      • Market Share Analysis, 2024
        • By Tool Types
        • By Connectivity & Smart Features Types
        • By Power Source Types
        • By End User Types
        • By Enterprise Size
    • Japan
      • Pricing Analysis
      • Market Share Analysis, 2024
        • By Tool Types
        • By Connectivity & Smart Features Types
        • By Power Source Types
        • By End User Types
        • By Enterprise Size
    • South Korea
      • Pricing Analysis
      • Market Share Analysis, 2024
        • By Tool Types
        • By Connectivity & Smart Features Types
        • By Power Source Types
        • By End User Types
        • By Enterprise Size
    • India
      • Pricing Analysis
      • Market Share Analysis, 2024
        • By Tool Types
        • By Connectivity & Smart Features Types
        • By Power Source Types
        • By End User Types
        • By Enterprise Size
    • ASEAN
      • Pricing Analysis
      • Market Share Analysis, 2024
        • By Tool Types
        • By Connectivity & Smart Features Types
        • By Power Source Types
        • By End User Types
        • By Enterprise Size
    • Australia & New Zealand
      • Pricing Analysis
      • Market Share Analysis, 2024
        • By Tool Types
        • By Connectivity & Smart Features Types
        • By Power Source Types
        • By End User Types
        • By Enterprise Size
    • GCC Countries
      • Pricing Analysis
      • Market Share Analysis, 2024
        • By Tool Types
        • By Connectivity & Smart Features Types
        • By Power Source Types
        • By End User Types
        • By Enterprise Size
    • Turkiye
      • Pricing Analysis
      • Market Share Analysis, 2024
        • By Tool Types
        • By Connectivity & Smart Features Types
        • By Power Source Types
        • By End User Types
        • By Enterprise Size
    • Northern Africa
      • Pricing Analysis
      • Market Share Analysis, 2024
        • By Tool Types
        • By Connectivity & Smart Features Types
        • By Power Source Types
        • By End User Types
        • By Enterprise Size
    • South Africa
      • Pricing Analysis
      • Market Share Analysis, 2024
        • By Tool Types
        • By Connectivity & Smart Features Types
        • By Power Source Types
        • By End User Types
        • By Enterprise Size
  21. Market Structure Analysis
    • Competition Dashboard
    • Competition Benchmarking
    • Market Share Analysis of Top Players
      • By Regional
      • By Tool Types
      • By Connectivity & Smart Features Types
      • By Power Source Types
      • By End User Types
      • By Enterprise Size
  22. Competition Analysis
    • Competition Deep Dive
      • Stanley Black & Decker
        • Overview
        • Product Portfolio
        • Profitability by Market Segments
        • Sales Footprint
        • Strategy Overview
      • Techtronic Industries Co., Ltd.
        • Overview
        • Product Portfolio
        • Profitability by Market Segments
        • Sales Footprint
        • Strategy Overview
      • Robert Bosch GmbH
        • Overview
        • Product Portfolio
        • Profitability by Market Segments
        • Sales Footprint
        • Strategy Overview
      • Makita Corporation
        • Overview
        • Product Portfolio
        • Profitability by Market Segments
        • Sales Footprint
        • Strategy Overview
      • Hilti Corporation
        • Overview
        • Product Portfolio
        • Profitability by Market Segments
        • Sales Footprint
        • Strategy Overview
      • Emerson Electric Co.
        • Overview
        • Product Portfolio
        • Profitability by Market Segments
        • Sales Footprint
        • Strategy Overview
      • Koki Holdings Co., Ltd.
        • Overview
        • Product Portfolio
        • Profitability by Market Segments
        • Sales Footprint
        • Strategy Overview
      • Andreas Stihl AG & Co. KG
        • Overview
        • Product Portfolio
        • Profitability by Market Segments
        • Sales Footprint
        • Strategy Overview
      • Apex Tool Group, LLC
        • Overview
        • Product Portfolio
        • Profitability by Market Segments
        • Sales Footprint
        • Strategy Overview
      • Chervon Group
        • Overview
        • Product Portfolio
        • Profitability by Market Segments
        • Sales Footprint
        • Strategy Overview
  23. Assumptions & Acronyms Used
  24. Research Methodology

List of Tables

  • Table 1: Global Market Value (USD Billion) Forecast by Region, 2020-2035
  • Table 2: Global Market Value (USD Billion) Forecast by Tool Types , 2020-2035
  • Table 3: Global Market Value (USD Billion) Forecast by Connectivity & Smart Features Types , 2020-2035
  • Table 4: Global Market Value (USD Billion) Forecast by Power Source Types, 2020-2035
  • Table 5: Global Market Value (USD Billion) Forecast by End User Types , 2020-2035
  • Table 6: Global Market Value (USD Billion) Forecast by Enterprise Size, 2020-2035
  • Table 7: North America Market Value (USD Billion) Forecast by Country, 2020-2035
  • Table 8: North America Market Value (USD Billion) Forecast by Tool Types , 2020-2035
  • Table 9: North America Market Value (USD Billion) Forecast by Connectivity & Smart Features Types , 2020-2035
  • Table 10: North America Market Value (USD Billion) Forecast by Power Source Types, 2020-2035
  • Table 11: North America Market Value (USD Billion) Forecast by End User Types , 2020-2035
  • Table 12: North America Market Value (USD Billion) Forecast by Enterprise Size, 2020-2035
  • Table 13: Latin America Market Value (USD Billion) Forecast by Country, 2020-2035
  • Table 14: Latin America Market Value (USD Billion) Forecast by Tool Types , 2020-2035
  • Table 15: Latin America Market Value (USD Billion) Forecast by Connectivity & Smart Features Types , 2020-2035
  • Table 16: Latin America Market Value (USD Billion) Forecast by Power Source Types, 2020-2035
  • Table 17: Latin America Market Value (USD Billion) Forecast by End User Types , 2020-2035
  • Table 18: Latin America Market Value (USD Billion) Forecast by Enterprise Size, 2020-2035
  • Table 19: Western Europe Market Value (USD Billion) Forecast by Country, 2020-2035
  • Table 20: Western Europe Market Value (USD Billion) Forecast by Tool Types , 2020-2035
  • Table 21: Western Europe Market Value (USD Billion) Forecast by Connectivity & Smart Features Types , 2020-2035
  • Table 22: Western Europe Market Value (USD Billion) Forecast by Power Source Types, 2020-2035
  • Table 23: Western Europe Market Value (USD Billion) Forecast by End User Types , 2020-2035
  • Table 24: Western Europe Market Value (USD Billion) Forecast by Enterprise Size, 2020-2035
  • Table 25: Eastern Europe Market Value (USD Billion) Forecast by Country, 2020-2035
  • Table 26: Eastern Europe Market Value (USD Billion) Forecast by Tool Types , 2020-2035
  • Table 27: Eastern Europe Market Value (USD Billion) Forecast by Connectivity & Smart Features Types , 2020-2035
  • Table 28: Eastern Europe Market Value (USD Billion) Forecast by Power Source Types, 2020-2035
  • Table 29: Eastern Europe Market Value (USD Billion) Forecast by End User Types , 2020-2035
  • Table 30: Eastern Europe Market Value (USD Billion) Forecast by Enterprise Size, 2020-2035
  • Table 31: East Asia Market Value (USD Billion) Forecast by Country, 2020-2035
  • Table 32: East Asia Market Value (USD Billion) Forecast by Tool Types , 2020-2035
  • Table 33: East Asia Market Value (USD Billion) Forecast by Connectivity & Smart Features Types , 2020-2035
  • Table 34: East Asia Market Value (USD Billion) Forecast by Power Source Types, 2020-2035
  • Table 35: East Asia Market Value (USD Billion) Forecast by End User Types , 2020-2035
  • Table 36: East Asia Market Value (USD Billion) Forecast by Enterprise Size, 2020-2035
  • Table 37: South Asia & Pacific Market Value (USD Billion) Forecast by Country, 2020-2035
  • Table 38: South Asia & Pacific Market Value (USD Billion) Forecast by Tool Types , 2020-2035
  • Table 39: South Asia & Pacific Market Value (USD Billion) Forecast by Connectivity & Smart Features Types , 2020-2035
  • Table 40: South Asia & Pacific Market Value (USD Billion) Forecast by Power Source Types, 2020-2035
  • Table 41: South Asia & Pacific Market Value (USD Billion) Forecast by End User Types , 2020-2035
  • Table 42: South Asia & Pacific Market Value (USD Billion) Forecast by Enterprise Size, 2020-2035
  • Table 43: Middle East & Africa Market Value (USD Billion) Forecast by Country, 2020-2035
  • Table 44: Middle East & Africa Market Value (USD Billion) Forecast by Tool Types , 2020-2035
  • Table 45: Middle East & Africa Market Value (USD Billion) Forecast by Connectivity & Smart Features Types , 2020-2035
  • Table 46: Middle East & Africa Market Value (USD Billion) Forecast by Power Source Types, 2020-2035
  • Table 47: Middle East & Africa Market Value (USD Billion) Forecast by End User Types , 2020-2035
  • Table 48: Middle East & Africa Market Value (USD Billion) Forecast by Enterprise Size, 2020-2035

List of Figures

  • Figure 1: Global Market Pricing Analysis
  • Figure 2: Global Market Value (USD Billion) Forecast 2020-2035
  • Figure 3: Global Market Value Share and BPS Analysis by Tool Types , 2025 and 2035
  • Figure 4: Global Market Y-o-Y Growth Comparison by Tool Types , 2025-2035
  • Figure 5: Global Market Attractiveness Analysis by Tool Types
  • Figure 6: Global Market Value Share and BPS Analysis by Connectivity & Smart Features Types , 2025 and 2035
  • Figure 7: Global Market Y-o-Y Growth Comparison by Connectivity & Smart Features Types , 2025-2035
  • Figure 8: Global Market Attractiveness Analysis by Connectivity & Smart Features Types
  • Figure 9: Global Market Value Share and BPS Analysis by Power Source Types, 2025 and 2035
  • Figure 10: Global Market Y-o-Y Growth Comparison by Power Source Types, 2025-2035
  • Figure 11: Global Market Attractiveness Analysis by Power Source Types
  • Figure 12: Global Market Value Share and BPS Analysis by End User Types , 2025 and 2035
  • Figure 13: Global Market Y-o-Y Growth Comparison by End User Types , 2025-2035
  • Figure 14: Global Market Attractiveness Analysis by End User Types
  • Figure 15: Global Market Value Share and BPS Analysis by Enterprise Size, 2025 and 2035
  • Figure 16: Global Market Y-o-Y Growth Comparison by Enterprise Size, 2025-2035
  • Figure 17: Global Market Attractiveness Analysis by Enterprise Size
  • Figure 18: Global Market Value (USD Billion) Share and BPS Analysis by Region, 2025 and 2035
  • Figure 19: Global Market Y-o-Y Growth Comparison by Region, 2025-2035
  • Figure 20: Global Market Attractiveness Analysis by Region
  • Figure 21: North America Market Incremental $ Opportunity, 2025-2035
  • Figure 22: Latin America Market Incremental $ Opportunity, 2025-2035
  • Figure 23: Western Europe Market Incremental $ Opportunity, 2025-2035
  • Figure 24: Eastern Europe Market Incremental $ Opportunity, 2025-2035
  • Figure 25: East Asia Market Incremental $ Opportunity, 2025-2035
  • Figure 26: South Asia & Pacific Market Incremental $ Opportunity, 2025-2035
  • Figure 27: Middle East & Africa Market Incremental $ Opportunity, 2025-2035
  • Figure 28: North America Market Value Share and BPS Analysis by Country, 2025 and 2035
  • Figure 29: North America Market Value Share and BPS Analysis by Tool Types , 2025 and 2035
  • Figure 30: North America Market Y-o-Y Growth Comparison by Tool Types , 2025-2035
  • Figure 31: North America Market Attractiveness Analysis by Tool Types
  • Figure 32: North America Market Value Share and BPS Analysis by Connectivity & Smart Features Types , 2025 and 2035
  • Figure 33: North America Market Y-o-Y Growth Comparison by Connectivity & Smart Features Types , 2025-2035
  • Figure 34: North America Market Attractiveness Analysis by Connectivity & Smart Features Types
  • Figure 35: North America Market Value Share and BPS Analysis by Power Source Types, 2025 and 2035
  • Figure 36: North America Market Y-o-Y Growth Comparison by Power Source Types, 2025-2035
  • Figure 37: North America Market Attractiveness Analysis by Power Source Types
  • Figure 38: North America Market Value Share and BPS Analysis by End User Types , 2025 and 2035
  • Figure 39: North America Market Y-o-Y Growth Comparison by End User Types , 2025-2035
  • Figure 40: North America Market Attractiveness Analysis by End User Types
  • Figure 41: North America Market Value Share and BPS Analysis by Enterprise Size, 2025 and 2035
  • Figure 42: North America Market Y-o-Y Growth Comparison by Enterprise Size, 2025-2035
  • Figure 43: North America Market Attractiveness Analysis by Enterprise Size
  • Figure 44: Latin America Market Value Share and BPS Analysis by Country, 2025 and 2035
  • Figure 45: Latin America Market Value Share and BPS Analysis by Tool Types , 2025 and 2035
  • Figure 46: Latin America Market Y-o-Y Growth Comparison by Tool Types , 2025-2035
  • Figure 47: Latin America Market Attractiveness Analysis by Tool Types
  • Figure 48: Latin America Market Value Share and BPS Analysis by Connectivity & Smart Features Types , 2025 and 2035
  • Figure 49: Latin America Market Y-o-Y Growth Comparison by Connectivity & Smart Features Types , 2025-2035
  • Figure 50: Latin America Market Attractiveness Analysis by Connectivity & Smart Features Types
  • Figure 51: Latin America Market Value Share and BPS Analysis by Power Source Types, 2025 and 2035
  • Figure 52: Latin America Market Y-o-Y Growth Comparison by Power Source Types, 2025-2035
  • Figure 53: Latin America Market Attractiveness Analysis by Power Source Types
  • Figure 54: Latin America Market Value Share and BPS Analysis by End User Types , 2025 and 2035
  • Figure 55: Latin America Market Y-o-Y Growth Comparison by End User Types , 2025-2035
  • Figure 56: Latin America Market Attractiveness Analysis by End User Types
  • Figure 57: Latin America Market Value Share and BPS Analysis by Enterprise Size, 2025 and 2035
  • Figure 58: Latin America Market Y-o-Y Growth Comparison by Enterprise Size, 2025-2035
  • Figure 59: Latin America Market Attractiveness Analysis by Enterprise Size
  • Figure 60: Western Europe Market Value Share and BPS Analysis by Country, 2025 and 2035
  • Figure 61: Western Europe Market Value Share and BPS Analysis by Tool Types , 2025 and 2035
  • Figure 62: Western Europe Market Y-o-Y Growth Comparison by Tool Types , 2025-2035
  • Figure 63: Western Europe Market Attractiveness Analysis by Tool Types
  • Figure 64: Western Europe Market Value Share and BPS Analysis by Connectivity & Smart Features Types , 2025 and 2035
  • Figure 65: Western Europe Market Y-o-Y Growth Comparison by Connectivity & Smart Features Types , 2025-2035
  • Figure 66: Western Europe Market Attractiveness Analysis by Connectivity & Smart Features Types
  • Figure 67: Western Europe Market Value Share and BPS Analysis by Power Source Types, 2025 and 2035
  • Figure 68: Western Europe Market Y-o-Y Growth Comparison by Power Source Types, 2025-2035
  • Figure 69: Western Europe Market Attractiveness Analysis by Power Source Types
  • Figure 70: Western Europe Market Value Share and BPS Analysis by End User Types , 2025 and 2035
  • Figure 71: Western Europe Market Y-o-Y Growth Comparison by End User Types , 2025-2035
  • Figure 72: Western Europe Market Attractiveness Analysis by End User Types
  • Figure 73: Western Europe Market Value Share and BPS Analysis by Enterprise Size, 2025 and 2035
  • Figure 74: Western Europe Market Y-o-Y Growth Comparison by Enterprise Size, 2025-2035
  • Figure 75: Western Europe Market Attractiveness Analysis by Enterprise Size
  • Figure 76: Eastern Europe Market Value Share and BPS Analysis by Country, 2025 and 2035
  • Figure 77: Eastern Europe Market Value Share and BPS Analysis by Tool Types , 2025 and 2035
  • Figure 78: Eastern Europe Market Y-o-Y Growth Comparison by Tool Types , 2025-2035
  • Figure 79: Eastern Europe Market Attractiveness Analysis by Tool Types
  • Figure 80: Eastern Europe Market Value Share and BPS Analysis by Connectivity & Smart Features Types , 2025 and 2035
  • Figure 81: Eastern Europe Market Y-o-Y Growth Comparison by Connectivity & Smart Features Types , 2025-2035
  • Figure 82: Eastern Europe Market Attractiveness Analysis by Connectivity & Smart Features Types
  • Figure 83: Eastern Europe Market Value Share and BPS Analysis by Power Source Types, 2025 and 2035
  • Figure 84: Eastern Europe Market Y-o-Y Growth Comparison by Power Source Types, 2025-2035
  • Figure 85: Eastern Europe Market Attractiveness Analysis by Power Source Types
  • Figure 86: Eastern Europe Market Value Share and BPS Analysis by End User Types , 2025 and 2035
  • Figure 87: Eastern Europe Market Y-o-Y Growth Comparison by End User Types , 2025-2035
  • Figure 88: Eastern Europe Market Attractiveness Analysis by End User Types
  • Figure 89: Eastern Europe Market Value Share and BPS Analysis by Enterprise Size, 2025 and 2035
  • Figure 90: Eastern Europe Market Y-o-Y Growth Comparison by Enterprise Size, 2025-2035
  • Figure 91: Eastern Europe Market Attractiveness Analysis by Enterprise Size
  • Figure 92: East Asia Market Value Share and BPS Analysis by Country, 2025 and 2035
  • Figure 93: East Asia Market Value Share and BPS Analysis by Tool Types , 2025 and 2035
  • Figure 94: East Asia Market Y-o-Y Growth Comparison by Tool Types , 2025-2035
  • Figure 95: East Asia Market Attractiveness Analysis by Tool Types
  • Figure 96: East Asia Market Value Share and BPS Analysis by Connectivity & Smart Features Types , 2025 and 2035
  • Figure 97: East Asia Market Y-o-Y Growth Comparison by Connectivity & Smart Features Types , 2025-2035
  • Figure 98: East Asia Market Attractiveness Analysis by Connectivity & Smart Features Types
  • Figure 99: East Asia Market Value Share and BPS Analysis by Power Source Types, 2025 and 2035
  • Figure 100: East Asia Market Y-o-Y Growth Comparison by Power Source Types, 2025-2035
  • Figure 101: East Asia Market Attractiveness Analysis by Power Source Types
  • Figure 102: East Asia Market Value Share and BPS Analysis by End User Types , 2025 and 2035
  • Figure 103: East Asia Market Y-o-Y Growth Comparison by End User Types , 2025-2035
  • Figure 104: East Asia Market Attractiveness Analysis by End User Types
  • Figure 105: East Asia Market Value Share and BPS Analysis by Enterprise Size, 2025 and 2035
  • Figure 106: East Asia Market Y-o-Y Growth Comparison by Enterprise Size, 2025-2035
  • Figure 107: East Asia Market Attractiveness Analysis by Enterprise Size
  • Figure 108: South Asia & Pacific Market Value Share and BPS Analysis by Country, 2025 and 2035
  • Figure 109: South Asia & Pacific Market Value Share and BPS Analysis by Tool Types , 2025 and 2035
  • Figure 110: South Asia & Pacific Market Y-o-Y Growth Comparison by Tool Types , 2025-2035
  • Figure 111: South Asia & Pacific Market Attractiveness Analysis by Tool Types
  • Figure 112: South Asia & Pacific Market Value Share and BPS Analysis by Connectivity & Smart Features Types , 2025 and 2035
  • Figure 113: South Asia & Pacific Market Y-o-Y Growth Comparison by Connectivity & Smart Features Types , 2025-2035
  • Figure 114: South Asia & Pacific Market Attractiveness Analysis by Connectivity & Smart Features Types
  • Figure 115: South Asia & Pacific Market Value Share and BPS Analysis by Power Source Types, 2025 and 2035
  • Figure 116: South Asia & Pacific Market Y-o-Y Growth Comparison by Power Source Types, 2025-2035
  • Figure 117: South Asia & Pacific Market Attractiveness Analysis by Power Source Types
  • Figure 118: South Asia & Pacific Market Value Share and BPS Analysis by End User Types , 2025 and 2035
  • Figure 119: South Asia & Pacific Market Y-o-Y Growth Comparison by End User Types , 2025-2035
  • Figure 120: South Asia & Pacific Market Attractiveness Analysis by End User Types
  • Figure 121: South Asia & Pacific Market Value Share and BPS Analysis by Enterprise Size, 2025 and 2035
  • Figure 122: South Asia & Pacific Market Y-o-Y Growth Comparison by Enterprise Size, 2025-2035
  • Figure 123: South Asia & Pacific Market Attractiveness Analysis by Enterprise Size
  • Figure 124: Middle East & Africa Market Value Share and BPS Analysis by Country, 2025 and 2035
  • Figure 125: Middle East & Africa Market Value Share and BPS Analysis by Tool Types , 2025 and 2035
  • Figure 126: Middle East & Africa Market Y-o-Y Growth Comparison by Tool Types , 2025-2035
  • Figure 127: Middle East & Africa Market Attractiveness Analysis by Tool Types
  • Figure 128: Middle East & Africa Market Value Share and BPS Analysis by Connectivity & Smart Features Types , 2025 and 2035
  • Figure 129: Middle East & Africa Market Y-o-Y Growth Comparison by Connectivity & Smart Features Types , 2025-2035
  • Figure 130: Middle East & Africa Market Attractiveness Analysis by Connectivity & Smart Features Types
  • Figure 131: Middle East & Africa Market Value Share and BPS Analysis by Power Source Types, 2025 and 2035
  • Figure 132: Middle East & Africa Market Y-o-Y Growth Comparison by Power Source Types, 2025-2035
  • Figure 133: Middle East & Africa Market Attractiveness Analysis by Power Source Types
  • Figure 134: Middle East & Africa Market Value Share and BPS Analysis by End User Types , 2025 and 2035
  • Figure 135: Middle East & Africa Market Y-o-Y Growth Comparison by End User Types , 2025-2035
  • Figure 136: Middle East & Africa Market Attractiveness Analysis by End User Types
  • Figure 137: Middle East & Africa Market Value Share and BPS Analysis by Enterprise Size, 2025 and 2035
  • Figure 138: Middle East & Africa Market Y-o-Y Growth Comparison by Enterprise Size, 2025-2035
  • Figure 139: Middle East & Africa Market Attractiveness Analysis by Enterprise Size
  • Figure 140: Global Market - Tier Structure Analysis
  • Figure 141: Global Market - Company Share Analysis

Frequently Asked Questions

What is the market size of the smart tools industry in 2025?

The global smart tools market is expected to be valued at USD 1.29 billion in 2025.

What is the projected market value for smart tools by 2035?

The market is forecast to reach USD 2.18 billion by 2035, expanding at a CAGR of 5.4% over the period.

Which type of power source is more preferred in Japan?

Cordless, battery-powered smart tools dominate the Japanese market with a 70% share due to demand for mobility and ergonomic convenience.

What kind of connectivity is most popular in South Korea?

Bluetooth-only tools lead the South Korean market, though hybrid connectivity tools (Bluetooth + Wi-Fi) are also gaining rapid adoption.

Which end-use sectors are driving demand for smart tools?

Key sectors include automotive, industrial machinery, aerospace, electronics, and professional repair services.

Who are the leading companies in the global smart tools market?

Major players include Stanley Black & Decker, Bosch, Hilti, Makita, Snap-on, and Techtronic Industries.

What trends are influencing the growth of the smart tools market?

Growth is supported by the rise of connected manufacturing, increasing demand for productivity monitoring, and adoption of Industry 4.0 automation tools.

Explore Similar Insights

Future Market Insights

Smart Tools Market