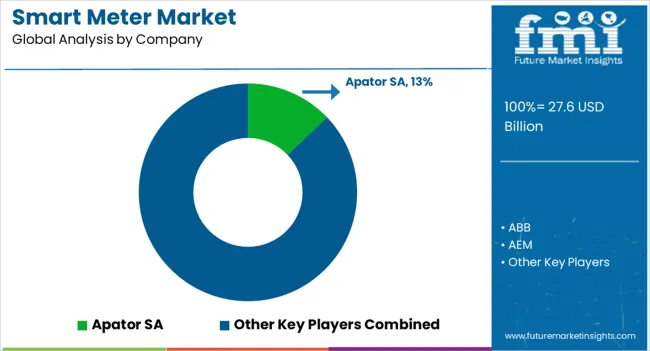
The Smart Meter Market is estimated to be valued at USD 27.6 billion in 2025 and is projected to reach USD 67.7 billion by 2035, registering a compound annual growth rate (CAGR) of 9.4% over the forecast period.
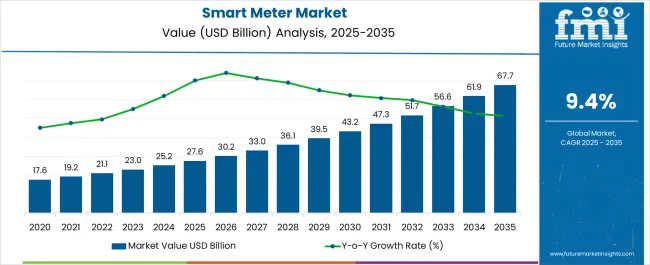
| Metric | Value |
|---|---|
| Smart Meter Market Estimated Value in (2025 E) | USD 27.6 billion |
| Smart Meter Market Forecast Value in (2035 F) | USD 67.7 billion |
| Forecast CAGR (2025 to 2035) | 9.4% |
The smart meter market is experiencing steady expansion, driven by increasing global initiatives to modernize power distribution systems and enhance energy efficiency. The transition from conventional meters to smart meters is being accelerated by rising electricity demand, integration of renewable energy sources, and the need for real-time monitoring of energy consumption. Governments and regulatory authorities are actively mandating smart metering infrastructure to improve billing accuracy, reduce energy theft, and promote demand-side management.
Technological advances in wireless communication, cloud connectivity, and data analytics are improving device functionality and enabling value-added services for utilities and consumers. Investments in grid modernization programs and smart city projects are further reinforcing adoption, particularly across urban areas.
The ability of smart meters to provide two-way communication, support dynamic pricing, and deliver detailed usage insights is reshaping energy management strategies As utilities prioritize operational efficiency and customers demand transparency in energy usage, the smart meter market is positioned to continue its growth trajectory, supported by expanding deployments across residential, commercial, and industrial segments.
The smart meter market is segmented by product type, technology, application, and geographic regions. By product type, smart meter market is divided into Smart Electric Meter, Smart Gas Meter, and Smart Water Meter. In terms of technology, smart meter market is classified into Radio Frequency (RF) and Power Line Carrier (PLC). Based on application, smart meter market is segmented into Residential Application and Commercial Application. Regionally, the smart meter industry is classified into North America, Latin America, Western Europe, Eastern Europe, Balkan & Baltic Countries, Russia & Belarus, Central Asia, East Asia, South Asia & Pacific, and the Middle East & Africa.
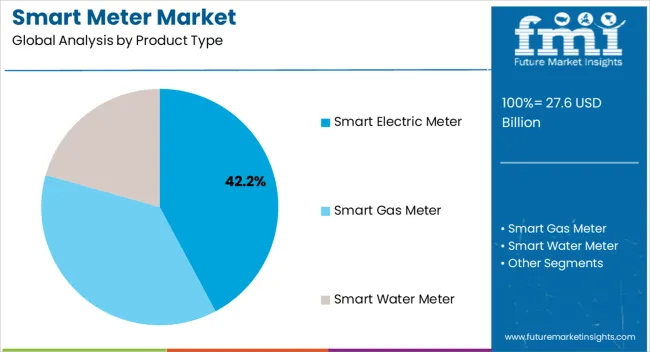
The smart electric meter segment is projected to capture 42.2% of the smart meter market revenue share in 2025, positioning it as the leading product type. This leadership is being reinforced by the widespread electrification of urban and rural areas, coupled with the need for accurate and transparent electricity consumption monitoring. Unlike other meter types, smart electric meters enable precise measurement of real-time usage and facilitate two-way communication between consumers and utilities, improving billing accuracy and reducing losses.
Strong government mandates for energy efficiency and renewable integration are accelerating adoption, as these meters are central to managing variable loads and distributed energy sources. Advances in digital technology and interoperability standards are enabling smoother integration into smart grids, allowing utilities to optimize operations and reduce downtime.
Growing emphasis on minimizing non-technical losses, coupled with consumer demand for detailed consumption insights, is further driving the adoption of smart electric meters Their scalability, long-term reliability, and role in grid modernization are ensuring continued dominance in the overall smart meter market.
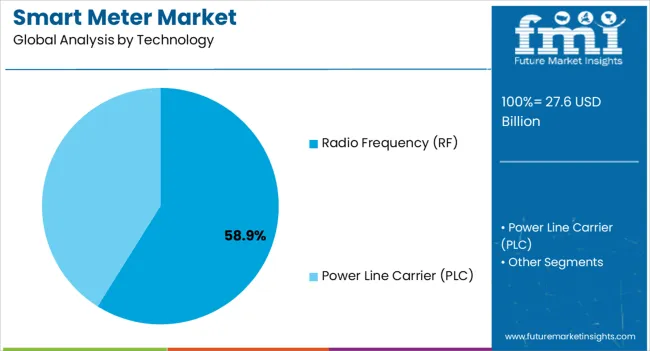
The radio frequency technology segment is expected to account for 58.9% of the smart meter market revenue share in 2025, making it the most widely adopted communication technology. Its dominance is being driven by the ability to transmit data reliably over long distances without the need for physical connectivity, thereby reducing infrastructure costs. Radio frequency technology enables real-time and secure data transmission, which is essential for utilities managing large-scale smart metering networks.
The segment is benefiting from its scalability, as it can support millions of meters across urban and rural areas, ensuring efficient communication even in dense environments. Its flexibility in integrating with advanced metering infrastructure and compatibility with evolving grid technologies are further reinforcing adoption.
Utilities are increasingly prioritizing radio frequency systems due to their proven reliability in remote reading, outage detection, and load balancing With growing focus on enhancing operational efficiency, reducing manual intervention, and ensuring seamless communication, radio frequency is expected to maintain its leadership as the preferred technology for smart meter deployment globally.
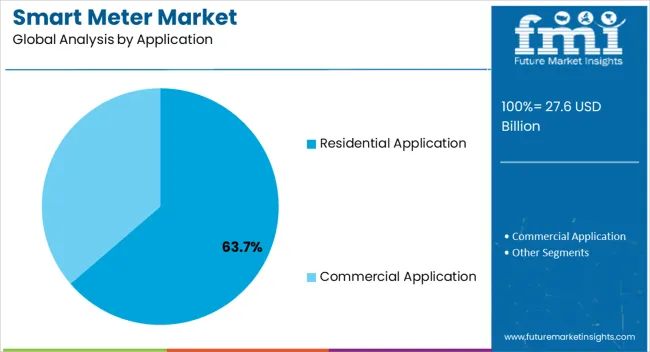
The residential application segment is anticipated to hold 63.7% of the smart meter market revenue share in 2025, making it the leading application area. This dominance is being reinforced by rising electricity demand in households and government-led initiatives aimed at improving energy efficiency at the consumer level. Widespread installation programs across developed and developing countries are accelerating adoption, as residential users benefit from improved billing transparency and greater control over energy consumption.
The integration of smart meters in homes is enabling consumers to monitor usage patterns in real time, encouraging behavioral changes that support energy conservation. Utility companies are favoring residential deployment due to the high volume of consumption data generated, which improves demand forecasting and load management.
The segment’s growth is further supported by the increasing prevalence of smart appliances and home automation systems, which complement smart meters in optimizing energy usage As energy efficiency regulations tighten and digital transformation accelerates, the residential sector is expected to remain the primary driver of smart meter adoption worldwide.
Efforts to reduce carbon footprints and meet climate goals encourage the use of meters that are smart to promote energy conservation and the integration of renewable energy sources. Advances in communication technologies, such as IoT, cellular networks, and low-power wide-area networks (LPWAN), facilitate better and more reliable data transmission.
Enhanced data analytics and AI capabilities allow utilities to make better use of the data collected by meters that are smart, leading to improved energy management and predictive maintenance. Meters that are smart reduce operational costs by enabling remote meter readings, decreasing the need for manual readings, and minimizing errors. They ensure accurate and real-time billing, reducing disputes and enhancing customer satisfaction.
Both consumers and utilities can use detailed consumption data to optimize energy use, leading to cost savings. Consumers are becoming more aware of their energy consumption patterns and are seeking ways to reduce their bills and environmental impact.
Meters that are smart provide detailed insights that help in achieving these goals. Integration with home automation systems is increasingly appealing to tech-savvy consumers who want to manage their energy use efficiently.
Smart meters enable demand response programs that help balance supply and demand, contributing to grid stability. They provide real-time data on outages and power quality, allowing utilities to respond more quickly to issues and reduce downtime. As the adoption of renewable energy sources like solar and wind increases, smart meters facilitate the integration of these distributed energy resources into the grid.
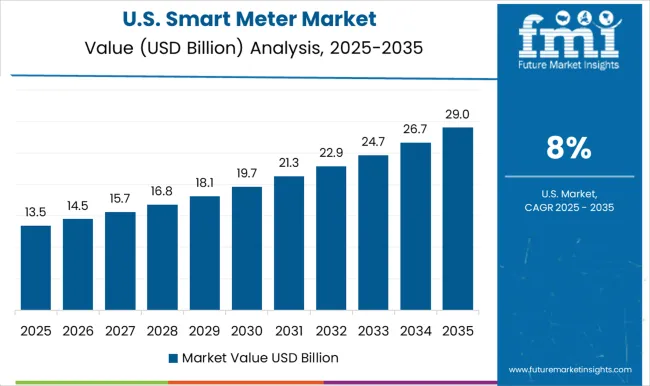
In the United States, the adoption of meters with smart capabilities has been significantly driven by state-level energy efficiency initiatives and the need to modernize the aging electricity grid. Many states have implemented programs that encourage utilities to deploy meters with smart capabilities, allowing consumers to monitor and manage their energy usage in real-time.
Thus, this has led to improved grid reliability and provided consumers with the tools to make informed decisions about their energy consumption. This has contributed to an increase in consumer awareness and acceptance of meters with smart technologies.
The push for grid modernization has led to substantial investments in smart grid technologies, with meters with smart capabilities are being a critical component. These investments aim to enhance the efficiency and resilience of the power grid, ensuring it can meet future energy demands.
The combination of these factors has contributed to a steady rise in the demand for meters that are smart across the United States, positioning the country as a significant player in the global smart meter market.
In the United Kingdom, the government has mandated the installation of meters with smart capabilities in every household and small business by 2025. This ambitious policy is part of the country's broader strategy to reduce carbon emissions and promote energy efficiency.
Despite facing challenges with the rollout, such as technical issues and varying levels of consumer engagement, a substantial proportion of United Kingdom households now benefit from meters with smart technologies. This mandate has positioned the United Kingdom as a leader in smart meter deployment, reflecting its commitment to sustainable energy practices and modern infrastructure.
The United Kingdom's smart meter rollout is a critical component of its energy policy, aiming to empower consumers with real-time data on their energy usage and encourage more efficient energy consumption.
The benefits of intelligent meters, including more accurate billing and the ability to identify energy-saving opportunities, have been key selling points for the program. As the country progresses towards its 2025 target, the demand for meters with smart technology continues to grow, driven by both regulatory requirements and consumer interest in energy efficiency.
In India, the demand is driven by efforts to improve electricity access and reliability, especially in rural and underserved areas. Government initiatives such as the Ujwal DISCOM Assurance Yojana (UDAY) prioritize the installation of smart meters to reduce distribution losses and enhance billing accuracy.
The scale of deployment is immense, given India's large population and diverse infrastructure challenges. This has necessitated phased rollout plans to effectively integrate smart meters into the country's energy ecosystem.
The deployment of intelligent meters in India is seen as a crucial step towards reducing power theft and ensuring a more reliable electricity supply. By providing accurate and real-time data on energy consumption, smart meters help improve the financial health of distribution companies and support the broader goals of India's energy reforms.
As these initiatives progress, the demand for meters that are smart is expected to rise, contributing to the country's efforts to modernize its energy infrastructure and improve overall energy efficiency.
Smart electric meters are transforming the way electricity consumption is measured, managed, and optimized. Their usage spans a variety of applications that benefit consumers, utilities, and the broader energy infrastructure. Meters with smart capabilities provide real-time data on electricity usage, allowing consumers to monitor their consumption patterns throughout the day.
This real-time monitoring enables households and businesses to identify high-usage periods and adjust their habits to reduce energy consumption and costs. By providing detailed insights into energy use, meters with smart capabilities empower users to make informed decisions about their energy consumption, leading to more efficient use of electricity.
Radiofrequency technology enables smart meters to transmit data wirelessly and efficiently, providing real-time updates on energy consumption. This eliminates the need for manual meter readings and reduces the risk of human error.
The reliable transmission of data ensures that utilities receive accurate and timely information, which is crucial for effective energy management and billing processes. The convenience and accuracy provided by radio frequency-enabled smart meters are major drivers of their demand.
The use of radio frequency technology in smart meters significantly reduces operational costs for utilities. Automated meter readings eliminate the need for meter readers to visit each property, reducing labor costs and logistical challenges.
The real-time data provided by radio frequency technology allows utilities to quickly detect and address issues such as power outages, faults, and energy theft. These operational efficiencies lead to cost savings, making RF-enabled smart meters an attractive investment for utilities.
Key players in the smart meter industry are investing in large-scale manufacturing to reduce costs. Achieving economies of scale not only makes smart meters more affordable but also increases market penetration. Forming partnerships with utility companies is crucial.
These collaborations ensure large-scale deployments and provide a steady demand for meters with smart technologies. Utilities benefit from the enhanced data accuracy and operational efficiencies provided by smart meters.
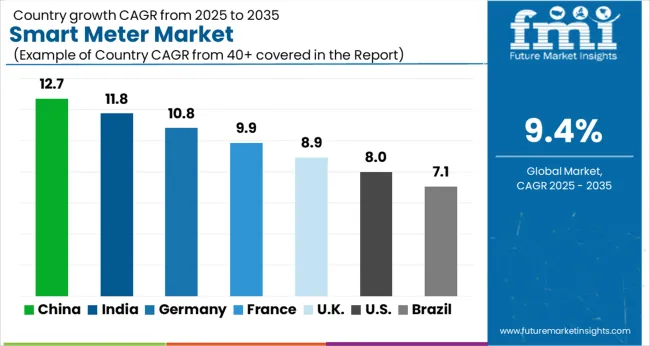
| Country | CAGR |
|---|---|
| China | 12.7% |
| India | 11.8% |
| Germany | 10.8% |
| France | 9.9% |
| UK | 8.9% |
| USA | 8.0% |
| Brazil | 7.1% |
The Smart Meter Market is expected to register a CAGR of 9.4% during the forecast period, exhibiting varied country level momentum. China leads with the highest CAGR of 12.7%, followed by India at 11.8%. Developed markets such as Germany, France, and the UK continue to expand steadily, while the USA is likely to grow at consistent rates. Brazil posts the lowest CAGR at 7.1%, yet still underscores a broadly positive trajectory for the global Smart Meter Market. In 2024, Germany held a dominant revenue in the Western Europe market and is expected to grow with a CAGR of 10.8%. The USA Smart Meter Market is estimated to be valued at USD 9.5 billion in 2025 and is anticipated to reach a valuation of USD 20.6 billion by 2035. Sales are projected to rise at a CAGR of 8.0% over the forecast period between 2025 and 2035. While Japan and South Korea markets are estimated to be valued at USD 1.5 billion and USD 840.3 million respectively in 2025.
| Item | Value |
|---|---|
| Quantitative Units | USD 27.6 Billion |
| Product Type | Smart Electric Meter, Smart Gas Meter, and Smart Water Meter |
| Technology | Radio Frequency (RF) and Power Line Carrier (PLC) |
| Application | Residential Application and Commercial Application |
| Regions Covered | North America, Europe, Asia-Pacific, Latin America, Middle East & Africa |
| Country Covered | United States, Canada, Germany, France, United Kingdom, China, Japan, India, Brazil, South Africa |
| Key Companies Profiled | Apator SA, ABB, AEM, Aclara Technologies LLC, ARAD Group, B Meters Metering Solutions, Badger Meter, Inc., Chint Group, General Electric, Honeywell International, Inc., Itron, Inc., Iskraemeco Group, Kamstrup, Larsen & Toubro Limited, Landis + Gyr, Ningbo Water Meter Co., Ltd., and Osaki Electric Co., Ltd. |
The global smart meter market is estimated to be valued at USD 27.6 billion in 2025.
The market size for the smart meter market is projected to reach USD 67.7 billion by 2035.
The smart meter market is expected to grow at a 9.4% CAGR between 2025 and 2035.
The key product types in smart meter market are smart electric meter, smart gas meter and smart water meter.
In terms of technology, radio frequency (rf) segment to command 58.9% share in the smart meter market in 2025.


Our Research Products

The "Full Research Suite" delivers actionable market intel, deep dives on markets or technologies, so clients act faster, cut risk, and unlock growth.

The Leaderboard benchmarks and ranks top vendors, classifying them as Established Leaders, Leading Challengers, or Disruptors & Challengers.

Locates where complements amplify value and substitutes erode it, forecasting net impact by horizon

We deliver granular, decision-grade intel: market sizing, 5-year forecasts, pricing, adoption, usage, revenue, and operational KPIs—plus competitor tracking, regulation, and value chains—across 60 countries broadly.

Spot the shifts before they hit your P&L. We track inflection points, adoption curves, pricing moves, and ecosystem plays to show where demand is heading, why it is changing, and what to do next across high-growth markets and disruptive tech

Real-time reads of user behavior. We track shifting priorities, perceptions of today’s and next-gen services, and provider experience, then pace how fast tech moves from trial to adoption, blending buyer, consumer, and channel inputs with social signals (#WhySwitch, #UX).

Partner with our analyst team to build a custom report designed around your business priorities. From analysing market trends to assessing competitors or crafting bespoke datasets, we tailor insights to your needs.
Supplier Intelligence
Discovery & Profiling
Capacity & Footprint
Performance & Risk
Compliance & Governance
Commercial Readiness
Who Supplies Whom
Scorecards & Shortlists
Playbooks & Docs
Category Intelligence
Definition & Scope
Demand & Use Cases
Cost Drivers
Market Structure
Supply Chain Map
Trade & Policy
Operating Norms
Deliverables
Buyer Intelligence
Account Basics
Spend & Scope
Procurement Model
Vendor Requirements
Terms & Policies
Entry Strategy
Pain Points & Triggers
Outputs
Pricing Analysis
Benchmarks
Trends
Should-Cost
Indexation
Landed Cost
Commercial Terms
Deliverables
Brand Analysis
Positioning & Value Prop
Share & Presence
Customer Evidence
Go-to-Market
Digital & Reputation
Compliance & Trust
KPIs & Gaps
Outputs
Full Research Suite comprises of:
Market outlook & trends analysis
Interviews & case studies
Strategic recommendations
Vendor profiles & capabilities analysis
5-year forecasts
8 regions and 60+ country-level data splits
Market segment data splits
12 months of continuous data updates
DELIVERED AS:
PDF EXCEL ONLINE
Smart Water Metering Market Size and Share Forecast Outlook 2025 to 2035
Smart Pulse Oximeters Market Size and Share Forecast Outlook 2025 to 2035
Smart Electric Meter Market Analysis – Size, Trends & Forecast 2025 to 2035
RF Smart Electric Meter Market Size and Share Forecast Outlook 2025 to 2035
Commercial Smart Water Meter Market Size and Share Forecast Outlook 2025 to 2035
Residential Smart Gas Meter Market Size and Share Forecast Outlook 2025 to 2035
Residential Smart Water Metering Market Size and Share Forecast Outlook 2025 to 2035
Residential RF Smart Electric Meter Market Size and Share Forecast Outlook 2025 to 2035
Smart Meeting Pod Market Size and Share Forecast Outlook 2025 to 2035
Smart Electrogastrogram Recorder Market Size and Share Forecast Outlook 2025 to 2035
Smart Aerial Work Robots Market Size and Share Forecast Outlook 2025 to 2035
Smart Bladder Scanner Market Size and Share Forecast Outlook 2025 to 2035
Smart School Bus Platform Market Size and Share Forecast Outlook 2025 to 2035
Smart Home Wireless Smoke Detector Market Size and Share Forecast Outlook 2025 to 2035
Smart Bus Platform Market Size and Share Forecast Outlook 2025 to 2035
Smart Vision Processing Chips Market Size and Share Forecast Outlook 2025 to 2035
Smart Touch Screen Scale Market Size and Share Forecast Outlook 2025 to 2035
Smart Magnetic Drive Conveyor System Market Size and Share Forecast Outlook 2025 to 2035
Smart Wheelchair market Size and Share Forecast Outlook 2025 to 2035
Smart Mining Technologies Market Size and Share Forecast Outlook 2025 to 2035

Thank you!
You will receive an email from our Business Development Manager. Please be sure to check your SPAM/JUNK folder too.
Chat With
MaRIA