Reports

- Global Locations -

Headquarters

Future Market Insights, Inc.

Christiana Corporate, 200
Continental Drive, Suite 401,
Newark, Delaware - 19713,
United States

T: +1-347-918-3531

Americas

Future Market Insights, Inc.

616 Corporate Way, Suite 2-9018,
Valley Cottage, NY 10989, United States

MEA

Future Market Insights

1602-6 Jumeirah Bay X2 Tower, Plot No: JLT-PH2-X2A,
Jumeirah Lakes Towers, Dubai,
United Arab Emirates

Europe

Future Market Insights

3rd Floor, 207 Regent Street,
W1B 3HH London
United Kingdom

T: + 44 (0) 20 8123 9659

Asia Pacific

Future Market Insights

IndiaLand Global Tech Park, Unit UG-1, Behind Grand HighStreet, Phase 1, Hinjawadi, MH, Pune – 411057, India

Smart Mirror Market Outlook (2023 to 2033)

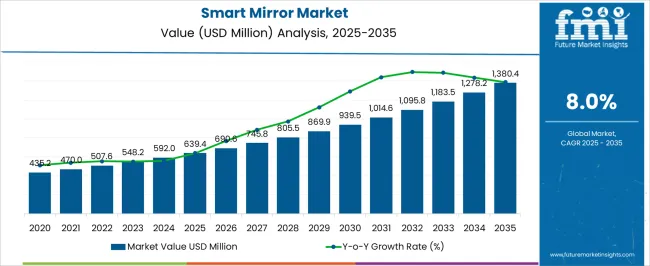
The global smart mirror market is anticipated to hold a market value of US$ 548.21 Million in 2023 and US$ 1,183.54 Million by 2033. The smart mirror manufacturing market growth rate is projected to be nearly 8% during the forecast period from 2023 to 2033.

Smart mirrors, also known as interactive mirrors, mirror TVs, and magic mirrors, are experiencing rapid growth due to the increased demand for smart mirrors in commercial places and offices. The growing use of smart mirrors in the retail industry to improve customer experience is driving the industry's growth. This trend is expected to remain a prominent smart mirror market growth factor in augmenting product demand throughout the forecast period. Furthermore, key companies have been amplifying their product portfolios by incorporating new and innovative products, to gain maximum industry share.

Report Attributes Details
Estimated Market Value in 2023 US$ 548.21 Million
Estimated Market Value in 2033 US$ 1,183.54 Million
Projected CAGR from 2023 to 2033 8%

Don't pay for what you don't need

Customize your report by selecting specific countries or regions and save 30%!

Revenue Analysis of Smart Mirror Market 2018 to 2022 vs. Future Outlook 2023 to 2033

The global smart mirror market garnered US$ 507.6 Million in 2022, expanding at a historical CAGR of 6%. Smart mirrors in stores are intended to improve customer shopping. Recently, Visa and Monse approached Nobal Technologies, a company based in Calgary, to work on an innovative mirror that would let consumers examine and buy things through the touchscreen mirror.

The mirror’s underlying technology enables it to gather consumer information about shopping preferences, colors, styles, and trends to aid customers in making better purchasing decisions. Furthermore, companies like Magic Mirror are introducing new ways for retailers to make their products available. When consumers use a smart mirror to shop, it creates a hassle-free process for both consumers and retailers. During the forecast period, the industry is also anticipated to be driven by rising expenditures on Research and Development and product development by the manufacturers. The estimation reveals that the industry is projected to secure a market value of US$ 1,183.54 Million by 2033.

What are the Growth Drivers of Smart Mirror Market?

Growing Automation in Mirrors to Aid Market Growth

Smart mirrors allow consumers to access voice assistance and other preferred content through the apps inbuilt, which connect the mobile phone screen to the mirrored display. These mirrors further allow users to access weather, stream entertainment, listen to music, access social media feeds, run downloadable applications, and more, which is expected to drive their demand in the residential segment. Developed countries are likely to witness tremendous growth in product adoption during the forecast period.

The industry is growing rapidly because smart mirrors combine a mirror with automation and monitoring features to show information over the home décor mirror. The combination of mirrors with intelligence and technology allows for interaction between smart mirrors and people by displaying information for carrying out daily tasks like running office programs, games, media players, and many more so that people can live an easier and more convenient life using this technology. The demand for smart mirrors with built-in advanced technology is growing, and many manufacturers are working on product development to meet the increasing demand.

For instance, in January 2022, an Indian company named Wellnesys Inc. introduced ARIA, a smart mirror that combines AR/VR, computer vision, and smart sensing technologies to give users engaging and immersive digital experiences through smart TVs and smart mirrors. Companies are focusing on strategic acquisitions to expand their presence and reinforce their positions in the industry. In the near term, global companies are likely to acquire small- and medium-sized companies in a bid to facilitate regional expansion.

For instance, in June 2020, Lululemon, a manufacturer of women's fitness apparel, acquired the smart mirror manufacturer, Mirror, for USD 500 million as demand for at-home workout streaming surged due to the coronavirus pandemic. The company Mirror provides smart mirrors that have an intuitive touch screen and lets consumers view & take part in exercise courses from the comfort of their own homes. In addition, the company will function as a separate division of Lululemon. Improving Lululemon’s “digital and interactive” was the primary goal behind the acquisition.

Sudip Saha
Sudip Saha

Principal Consultant

Talk to Analyst

Find your sweet spots for generating winning opportunities in this market.

What are the Challenges Projected to be Faced by the Market?

Increased Chances of Security Breach of Personal Data to Hinder Market Growth

A security breach of confidential data is one of the major restraining factors. This is due to the tracking of the personal data of users through smart mirrors. For instance, smart mirrors deployed in retail stores can easily track shoppers' buying experiences, and spending habits in the store.
Country-Wise Analysis

What is the Contribution of North America to Increasing Demand for Outsourcing Pharma?

Increase in the Number of Households in the Region to Increase Consumer Demand

North America emerged as the largest region in 2022 and accounted for the maximum share of more than 48% of the total revenue. The segment is expected to maintain its dominance over the forecast period owing to an increase in the number of households, coupled with the increasing number of manufacturers, and shifting preferences toward healthy drinks.

Increasing demand for a variety of smart mirrors from these regions is anticipated to drive the regional market. A growing number of product launches and investments in advanced technology are further expected to augment the region’s growth.
What is the Growth Outlook for smart mirrors in Europe?

Increasing Investments in Product Penetration to Boost Regional Market

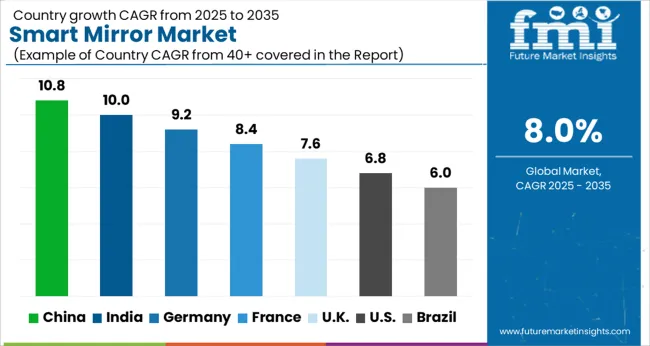
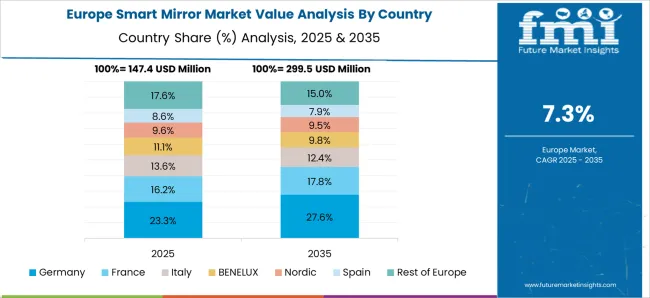
Europe is also expected to grow at a significant CAGR during the forecast period. Increasing product penetration in developed countries, such as the United Kingdom, Germany, and France, is likely to bode well with regional growth. Many regional and international players are launching their products in these countries where the population has a significant per-capita income to generate greater revenue and increase the customer base for their products. For instance, MirrorMedia Ltd., a United Kingdom-based smart mirror manufacturer offers a wide range of smart mirrors for residential and commercial applications.

Get the data you need at a Fraction of the cost

Personalize your report by choosing insights you need
and save 40%!

Category-Wise Insights

Which Type of Installation is Boosting the Growth of the Market?

Wall-Mounted Smart Mirror Segment to Boost the Growth of Outsourcing Pharma Industry

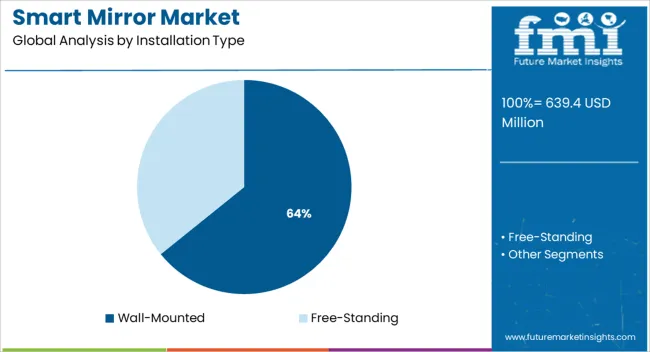
The wall-mounted smart mirror segment led the market in 2022 and accounted for the maximum share of 85.5% of the overall revenue. The segment is projected to expand further at the fastest growth rate during the forecast period. The growth of the segment can be attributed to the rising consumer preference for wall-mounted mirrors over free-standing smart mirrors. With free-standing mirrors, there is usually a higher risk of falling, which is decreased by wall-mounted mirrors. In addition, compared to ordinary mirrors, smart mirrors are quite expensive, which tends to increase consumer preference for wall-mounted installation-type smart mirrors.

A wall-mounted smart mirror may also conserve space and improve the appearance of a room. Moreover, increasing demand for smart housing facilities across the globe is driving the demand for smart bathrooms & personalized kitchen mirrors. Manufacturers are making customized smart mirrors for bathrooms and kitchens that are typically wall-mounted due to concerns about the associated risks and available space required for free-standing mirrors in bathrooms & kitchens. For instance, in January 2019, Kohler announced its new wall-mounted Verdera Voice smart mirror with Google Assistant built-in providing seamless integration of voice control for the bathroom space. All the above-mentioned factors strongly support the growth of the segment.

What is the Role of the Application Segment in Propelling the Market?

Commercial Application Segment to Dominate the Market

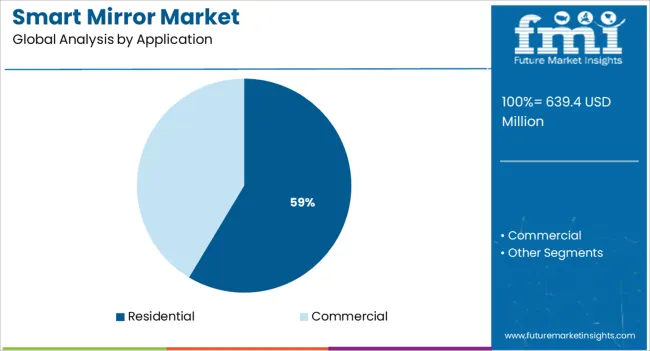
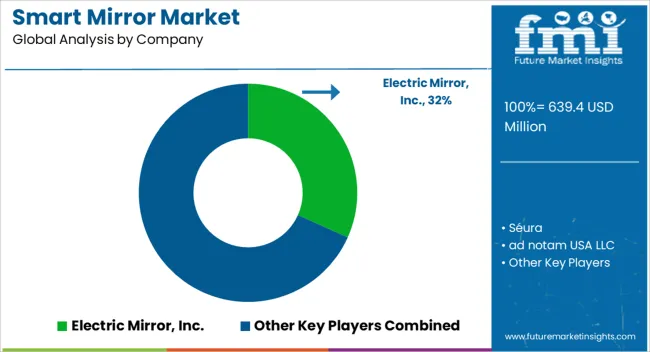
The commercial application segment dominated the global industry in 2022 and accounted for the largest share of more than 57% of the overall revenue. The segment is expected to register the fastest growth rate maintaining its dominant position throughout the forecast years. Furthermore, smart mirrors for commercial applications are expected to grow at the fastest CAGR during the forecast period. The key companies are launching new products with innovative designs and sizes specifically for the hospitality and commercial sectors. For instance, Prestop company, Electric Mirror, Inc., and ProDisplay have separate sets of product portfolios of smart mirrors for commercial applications.

The residential application segment is also expected to witness significant growth over the forecast period. This is attributed to the growth of the residential sector in most of the developed countries. For instance, governments of various countries, including Australia, the United States, and Canada, have planned strategies like concessions for first-time buyers, subsidies for veterans, the golden visa, low-cost affordable housing schemes, and reductions in transactional taxes, which are anticipated to spur the growth of the residential sector during the forecast period.

By Distribution, Which Segment is Projected to Lead the Market?

Offline Channel Segment is Estimated to Hold the Largest Share

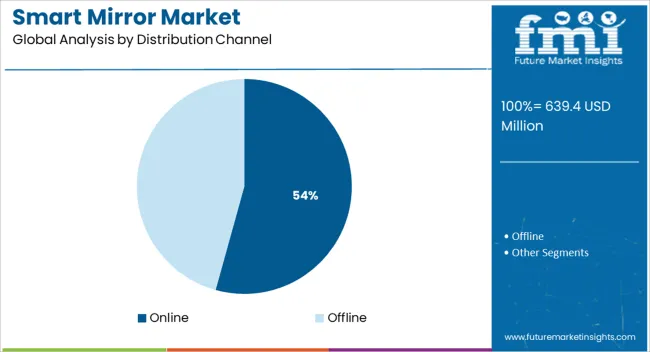
The offline channels segment dominated the global industry in 2022 and accounted for the maximum share of 73.5% of the total revenue. The growth of the segment is driven by the increasing consumer preference for shopping in person. According to 2020 Raydiant's second annual State of Consumer Behavior Report, 33% of respondents prefer shopping at physical stores because they like to view, touch, and interact with actual products. In addition, 26% of respondents enjoy the overall shopping experience that a physical location offers, and 13% appreciate the immediate satisfaction that in-store shopping offers as opposed to waiting for delivery.

In the near future, this is anticipated to drive the segment growth and will maintain its dominant position in the market. However, the online channels segment is expected to grow at the fastest CAGR during the forecast period. The popularity of e-commerce channels is expected to increase over the projected period, compared to offline distribution channels, given the increasing number of market players marking their presence online.

Industry players have been offering customers the ability to place and track orders online on their own platforms, e-commerce sites, or third-party platforms like Shopify. In this regard, the emergence of high-end online shopping platforms is expected to act as a driver for the market in the forecast period.

Start-ups for Smart Mirror Market

Some of the key start-ups working towards smart mirror key trends for 2033 in the market are-

  • The Verse Smart mirror is an interactive mirror, which displays relevant information in a new, futuristic way. The mirror’s UI is fully customizable and offers many different Widgets, such as e-mails, a calendar, and the news, to help keep yourself up-to-date. The integrated voice- and gesture recognition allow easy, quick but most importantly fingerprint-less interaction with the mirror itself. The slim, modern design enables the Verse Smartmirror to look just like a conventional mirror - That is, until it turns on when you enter the room of course.
  • Making its entry as the first smart LiDAR sensor with built-in software, in November 2023, Blickfeld announced the launch of the Qb2 LiDAR sensor. The Qb2 packages high-performance detection and ranging with onboard software to improve performance and setup time without requiring complex custom software development. In addition, the device includes built-in Wi-Fi support, ensuring that the Qb2 can be deployed anywhere without messy cable routing. The data produced by the Qb2 may be accessed through a simple web interface, making it an attractive 3D monitoring solution for various applications.

Competitive Landscape

The smart mirror top manufacturers are focusing to increase their global influence and adopt strategies such as; acquisition, collaboration, and partnerships. Some of the recent key developments among leading companies of smart mirrors are:

  • In May 2022, H&M piloted new tech features at select COS stores in the USA The stores feature smart mirrors in fitting rooms that can identify customers’ products, including the size & color, and provide personalized product or styling recommendations.
  • In January 2022, MySize launched a new smart mirror that allows shoppers to virtually try on a garment and provide fit recommendations.
  • In December 2021, Capstone Connected, a brand known for creating consumer-driven products, launched a new smart mirror, Thin Cast Smart Mirror. The mirror comes with an 18.5-inch touchscreen display, Android compatibility, dual speakers, and two ways to interact with them. The company introduced its two sizes and is equipped with multiple lifestyle features.

Smart Mirror Market- Report Scope

Report Attributes Details
Forecast Period 2023 to 2033
Historical Data 2018 to 2022
Expected Market Value in 2023 US$ 548.21 Million
Projected Value in 2033 US$ 1,183.54 Million
Key Regions Covered
  • North America
  • Latin America
  • Europe
  • East Asia
  • South Asia
  • Middle East & Africa
  • Oceania
Key Countries Covered
  • USA
  • Canada
  • Brazil
  • Mexico
  • Germany
  • United Kingdom
  • France
  • Spain
  • Italy
  • India
  • Malaysia
  • Singapore
  • Thailand
  • China
  • Japan
  • South Korea
  • Australia
  • New Zealand
  • GCC Countries
  • South Africa
  • Israel
Key Segments Covered
  • Installation Type
  • Application
  • Distribution Channel
  • Region
Pricing Available upon Request

Key Market Segments Covered in the Global Smart Mirror Market

By Installation Type:

  • Wall-Mounted
  • Free-Standing

By Application:

  • Residential
  • Commercial

By Distribution Channel:

  • Online
  • Offline

By Region:

  • North America
  • Latin America
  • Europe
  • East Asia
  • South Asia
  • Oceania
  • Middle East & Africa

Frequently Asked Questions

How opportunistic will the smart mirror market be in North America?

North America will account for 48% of global smart mirror demand

What is the predicted value CAGR for the market from 2023 to 2033?

From 2023 to 2033, the market is projected to expand at an 8% value CAGR, as per FMI

What is the projected market value for smart mirrors in 2033?

By 2033, smart mirror market demand is expected to reach US$ 1183.54 Million

What is the anticipated market value for smart mirrors in 2023?

By 2023, demand for smart mirrors is forecast to be valued at US$ 548.21 Million

What was the market worth for smart mirrors in 2022?

As of 2022, the market for smart mirrors was valued at US$ 507.6 Million

Table of Content

1. Executive Summary | Smart Mirror Market

    1.1. Global Market Outlook

    1.2. Demand-side Trends

    1.3. Supply-side Trends

    1.4. Technology Roadmap Analysis

    1.5. Analysis and Recommendations

2. Market Overview

    2.1. Market Coverage / Taxonomy

    2.2. Market Definition / Scope / Limitations

3. Market Background

    3.1. Market Dynamics

        3.1.1. Drivers

        3.1.2. Restraints

        3.1.3. Opportunity

        3.1.4. Trends

    3.2. Scenario Forecast

        3.2.1. Demand in Optimistic Scenario

        3.2.2. Demand in Likely Scenario

        3.2.3. Demand in Conservative Scenario

    3.3. Opportunity Map Analysis

    3.4. Investment Feasibility Matrix

    3.5. PESTLE and Porter’s Analysis

    3.6. Regulatory Landscape

        3.6.1. By Key Regions

        3.6.2. By Key Countries

    3.7. Regional Parent Market Outlook

4. Global Market Analysis 2018 to 2022 and Forecast, 2023 to 2033

    4.1. Historical Market Size Value (US$ Million) Analysis, 2018 to 2022

    4.2. Current and Future Market Size Value (US$ Million) Projections, 2023 to 2033

        4.2.1. Y-o-Y Growth Trend Analysis

        4.2.2. Absolute $ Opportunity Analysis

5. Global Market Analysis 2018 to 2022 and Forecast 2023 to 2033, By Installation Type

    5.1. Introduction / Key Findings

    5.2. Historical Market Size Value (US$ Million) Analysis By Installation Type, 2018 to 2022

    5.3. Current and Future Market Size Value (US$ Million) Analysis and Forecast By Installation Type, 2023 to 2033

        5.3.1. Wall-Mounted

        5.3.2. Free-Standing

    5.4. Y-o-Y Growth Trend Analysis By Installation Type, 2018 to 2022

    5.5. Absolute $ Opportunity Analysis By Installation Type, 2023 to 2033

6. Global Market Analysis 2018 to 2022 and Forecast 2023 to 2033, By Application

    6.1. Introduction / Key Findings

    6.2. Historical Market Size Value (US$ Million) Analysis By Application, 2018 to 2022

    6.3. Current and Future Market Size Value (US$ Million) Analysis and Forecast By Application, 2023 to 2033

        6.3.1. Residential

        6.3.2. Commercial

    6.4. Y-o-Y Growth Trend Analysis By Application, 2018 to 2022

    6.5. Absolute $ Opportunity Analysis By Application, 2023 to 2033

7. Global Market Analysis 2018 to 2022 and Forecast 2023 to 2033, By Distribution Channel

    7.1. Introduction / Key Findings

    7.2. Historical Market Size Value (US$ Million) Analysis By Distribution Channel, 2018 to 2022

    7.3. Current and Future Market Size Value (US$ Million) Analysis and Forecast By Distribution Channel, 2023 to 2033

        7.3.1. Online

        7.3.2. Offline

    7.4. Y-o-Y Growth Trend Analysis By Distribution Channel, 2018 to 2022

    7.5. Absolute $ Opportunity Analysis By Distribution Channel, 2023 to 2033

8. Global Market Analysis 2018 to 2022 and Forecast 2023 to 2033, By Region

    8.1. Introduction

    8.2. Historical Market Size Value (US$ Million) Analysis By Region, 2018 to 2022

    8.3. Current Market Size Value (US$ Million) Analysis and Forecast By Region, 2023 to 2033

        8.3.1. North America

        8.3.2. Latin America

        8.3.3. Europe

        8.3.4. South Asia

        8.3.5. East Asia

        8.3.6. Oceania

        8.3.7. Middle East and Africa(MEA)

    8.4. Market Attractiveness Analysis By Region

9. North America Market Analysis 2018 to 2022 and Forecast 2023 to 2033, By Country

    9.1. Historical Market Size Value (US$ Million) Trend Analysis By Market Taxonomy, 2018 to 2022

    9.2. Market Size Value (US$ Million) Forecast By Market Taxonomy, 2023 to 2033

        9.2.1. By Country

            9.2.1.1. USA

            9.2.1.2. Canada

        9.2.2. By Installation Type

        9.2.3. By Application

        9.2.4. By Distribution Channel

    9.3. Market Attractiveness Analysis

        9.3.1. By Country

        9.3.2. By Installation Type

        9.3.3. By Application

        9.3.4. By Distribution Channel

    9.4. Key Takeaways

10. Latin America Market Analysis 2018 to 2022 and Forecast 2023 to 2033, By Country

    10.1. Historical Market Size Value (US$ Million) Trend Analysis By Market Taxonomy, 2018 to 2022

    10.2. Market Size Value (US$ Million) Forecast By Market Taxonomy, 2023 to 2033

        10.2.1. By Country

            10.2.1.1. Brazil

            10.2.1.2. Mexico

            10.2.1.3. Rest of Latin America

        10.2.2. By Installation Type

        10.2.3. By Application

        10.2.4. By Distribution Channel

    10.3. Market Attractiveness Analysis

        10.3.1. By Country

        10.3.2. By Installation Type

        10.3.3. By Application

        10.3.4. By Distribution Channel

    10.4. Key Takeaways

11. Europe Market Analysis 2018 to 2022 and Forecast 2023 to 2033, By Country

    11.1. Historical Market Size Value (US$ Million) Trend Analysis By Market Taxonomy, 2018 to 2022

    11.2. Market Size Value (US$ Million) Forecast By Market Taxonomy, 2023 to 2033

        11.2.1. By Country

            11.2.1.1. Germany

            11.2.1.2. United Kingdom

            11.2.1.3. France

            11.2.1.4. Spain

            11.2.1.5. Italy

            11.2.1.6. Rest of Europe

        11.2.2. By Installation Type

        11.2.3. By Application

        11.2.4. By Distribution Channel

    11.3. Market Attractiveness Analysis

        11.3.1. By Country

        11.3.2. By Installation Type

        11.3.3. By Application

        11.3.4. By Distribution Channel

    11.4. Key Takeaways

12. South Asia Market Analysis 2018 to 2022 and Forecast 2023 to 2033, By Country

    12.1. Historical Market Size Value (US$ Million) Trend Analysis By Market Taxonomy, 2018 to 2022

    12.2. Market Size Value (US$ Million) Forecast By Market Taxonomy, 2023 to 2033

        12.2.1. By Country

            12.2.1.1. India

            12.2.1.2. Malaysia

            12.2.1.3. Singapore

            12.2.1.4. Thailand

            12.2.1.5. Rest of South Asia

        12.2.2. By Installation Type

        12.2.3. By Application

        12.2.4. By Distribution Channel

    12.3. Market Attractiveness Analysis

        12.3.1. By Country

        12.3.2. By Installation Type

        12.3.3. By Application

        12.3.4. By Distribution Channel

    12.4. Key Takeaways

13. East Asia Market Analysis 2018 to 2022 and Forecast 2023 to 2033, By Country

    13.1. Historical Market Size Value (US$ Million) Trend Analysis By Market Taxonomy, 2018 to 2022

    13.2. Market Size Value (US$ Million) Forecast By Market Taxonomy, 2023 to 2033

        13.2.1. By Country

            13.2.1.1. China

            13.2.1.2. Japan

            13.2.1.3. South Korea

        13.2.2. By Installation Type

        13.2.3. By Application

        13.2.4. By Distribution Channel

    13.3. Market Attractiveness Analysis

        13.3.1. By Country

        13.3.2. By Installation Type

        13.3.3. By Application

        13.3.4. By Distribution Channel

    13.4. Key Takeaways

14. Oceania Market Analysis 2018 to 2022 and Forecast 2023 to 2033, By Country

    14.1. Historical Market Size Value (US$ Million) Trend Analysis By Market Taxonomy, 2018 to 2022

    14.2. Market Size Value (US$ Million) Forecast By Market Taxonomy, 2023 to 2033

        14.2.1. By Country

            14.2.1.1. Australia

            14.2.1.2. New Zealand

        14.2.2. By Installation Type

        14.2.3. By Application

        14.2.4. By Distribution Channel

    14.3. Market Attractiveness Analysis

        14.3.1. By Country

        14.3.2. By Installation Type

        14.3.3. By Application

        14.3.4. By Distribution Channel

    14.4. Key Takeaways

15. MEA Market Analysis 2018 to 2022 and Forecast 2023 to 2033, By Country

    15.1. Historical Market Size Value (US$ Million) Trend Analysis By Market Taxonomy, 2018 to 2022

    15.2. Market Size Value (US$ Million) Forecast By Market Taxonomy, 2023 to 2033

        15.2.1. By Country

            15.2.1.1. GCC Countries

            15.2.1.2. South Africa

            15.2.1.3. Israel

            15.2.1.4. Rest of Middle East and Africa(MEA)

        15.2.2. By Installation Type

        15.2.3. By Application

        15.2.4. By Distribution Channel

    15.3. Market Attractiveness Analysis

        15.3.1. By Country

        15.3.2. By Installation Type

        15.3.3. By Application

        15.3.4. By Distribution Channel

    15.4. Key Takeaways

16. Key Countries Market Analysis

    16.1. USA

        16.1.1. Pricing Analysis

        16.1.2. Market Share Analysis, 2021

            16.1.2.1. By Installation Type

            16.1.2.2. By Application

            16.1.2.3. By Distribution Channel

    16.2. Canada

        16.2.1. Pricing Analysis

        16.2.2. Market Share Analysis, 2021

            16.2.2.1. By Installation Type

            16.2.2.2. By Application

            16.2.2.3. By Distribution Channel

    16.3. Brazil

        16.3.1. Pricing Analysis

        16.3.2. Market Share Analysis, 2021

            16.3.2.1. By Installation Type

            16.3.2.2. By Application

            16.3.2.3. By Distribution Channel

    16.4. Mexico

        16.4.1. Pricing Analysis

        16.4.2. Market Share Analysis, 2021

            16.4.2.1. By Installation Type

            16.4.2.2. By Application

            16.4.2.3. By Distribution Channel

    16.5. Germany

        16.5.1. Pricing Analysis

        16.5.2. Market Share Analysis, 2021

            16.5.2.1. By Installation Type

            16.5.2.2. By Application

            16.5.2.3. By Distribution Channel

    16.6. United Kingdom

        16.6.1. Pricing Analysis

        16.6.2. Market Share Analysis, 2021

            16.6.2.1. By Installation Type

            16.6.2.2. By Application

            16.6.2.3. By Distribution Channel

    16.7. France

        16.7.1. Pricing Analysis

        16.7.2. Market Share Analysis, 2021

            16.7.2.1. By Installation Type

            16.7.2.2. By Application

            16.7.2.3. By Distribution Channel

    16.8. Spain

        16.8.1. Pricing Analysis

        16.8.2. Market Share Analysis, 2021

            16.8.2.1. By Installation Type

            16.8.2.2. By Application

            16.8.2.3. By Distribution Channel

    16.9. Italy

        16.9.1. Pricing Analysis

        16.9.2. Market Share Analysis, 2021

            16.9.2.1. By Installation Type

            16.9.2.2. By Application

            16.9.2.3. By Distribution Channel

    16.10. India

        16.10.1. Pricing Analysis

        16.10.2. Market Share Analysis, 2021

            16.10.2.1. By Installation Type

            16.10.2.2. By Application

            16.10.2.3. By Distribution Channel

    16.11. Malaysia

        16.11.1. Pricing Analysis

        16.11.2. Market Share Analysis, 2021

            16.11.2.1. By Installation Type

            16.11.2.2. By Application

            16.11.2.3. By Distribution Channel

    16.12. Singapore

        16.12.1. Pricing Analysis

        16.12.2. Market Share Analysis, 2021

            16.12.2.1. By Installation Type

            16.12.2.2. By Application

            16.12.2.3. By Distribution Channel

    16.13. Thailand

        16.13.1. Pricing Analysis

        16.13.2. Market Share Analysis, 2021

            16.13.2.1. By Installation Type

            16.13.2.2. By Application

            16.13.2.3. By Distribution Channel

    16.14. China

        16.14.1. Pricing Analysis

        16.14.2. Market Share Analysis, 2021

            16.14.2.1. By Installation Type

            16.14.2.2. By Application

            16.14.2.3. By Distribution Channel

    16.15. Japan

        16.15.1. Pricing Analysis

        16.15.2. Market Share Analysis, 2021

            16.15.2.1. By Installation Type

            16.15.2.2. By Application

            16.15.2.3. By Distribution Channel

    16.16. South Korea

        16.16.1. Pricing Analysis

        16.16.2. Market Share Analysis, 2021

            16.16.2.1. By Installation Type

            16.16.2.2. By Application

            16.16.2.3. By Distribution Channel

    16.17. Australia

        16.17.1. Pricing Analysis

        16.17.2. Market Share Analysis, 2021

            16.17.2.1. By Installation Type

            16.17.2.2. By Application

            16.17.2.3. By Distribution Channel

    16.18. New Zealand

        16.18.1. Pricing Analysis

        16.18.2. Market Share Analysis, 2021

            16.18.2.1. By Installation Type

            16.18.2.2. By Application

            16.18.2.3. By Distribution Channel

    16.19. GCC Countries

        16.19.1. Pricing Analysis

        16.19.2. Market Share Analysis, 2021

            16.19.2.1. By Installation Type

            16.19.2.2. By Application

            16.19.2.3. By Distribution Channel

    16.20. South Africa

        16.20.1. Pricing Analysis

        16.20.2. Market Share Analysis, 2021

            16.20.2.1. By Installation Type

            16.20.2.2. By Application

            16.20.2.3. By Distribution Channel

    16.21. Israel

        16.21.1. Pricing Analysis

        16.21.2. Market Share Analysis, 2021

            16.21.2.1. By Installation Type

            16.21.2.2. By Application

            16.21.2.3. By Distribution Channel

17. Market Structure Analysis

    17.1. Competition Dashboard

    17.2. Competition Benchmarking

    17.3. Market Share Analysis of Top Players

        17.3.1. By Regional

        17.3.2. By Installation Type

        17.3.3. By Application

        17.3.4. By Distribution Channel

18. Competition Analysis

    18.1. Competition Deep Dive

        18.1.1. Electric Mirror, Inc.

            18.1.1.1. Overview

            18.1.1.2. Product Portfolio

            18.1.1.3. Profitability by Market Segments

            18.1.1.4. Sales Footprint

            18.1.1.5. Strategy Overview

                18.1.1.5.1. Marketing Strategy

        18.1.2. Séura

            18.1.2.1. Overview

            18.1.2.2. Product Portfolio

            18.1.2.3. Profitability by Market Segments

            18.1.2.4. Sales Footprint

            18.1.2.5. Strategy Overview

                18.1.2.5.1. Marketing Strategy

        18.1.3. ad notam USA LLC

            18.1.3.1. Overview

            18.1.3.2. Product Portfolio

            18.1.3.3. Profitability by Market Segments

            18.1.3.4. Sales Footprint

            18.1.3.5. Strategy Overview

                18.1.3.5.1. Marketing Strategy

        18.1.4. Majestic Mirror & Frame

            18.1.4.1. Overview

            18.1.4.2. Product Portfolio

            18.1.4.3. Profitability by Market Segments

            18.1.4.4. Sales Footprint

            18.1.4.5. Strategy Overview

                18.1.4.5.1. Marketing Strategy

        18.1.5. Avis Electronics

            18.1.5.1. Overview

            18.1.5.2. Product Portfolio

            18.1.5.3. Profitability by Market Segments

            18.1.5.4. Sales Footprint

            18.1.5.5. Strategy Overview

                18.1.5.5.1. Marketing Strategy

        18.1.6. Foshan Eterna Intelligent Bathroom Co., Ltd.

            18.1.6.1. Overview

            18.1.6.2. Product Portfolio

            18.1.6.3. Profitability by Market Segments

            18.1.6.4. Sales Footprint

            18.1.6.5. Strategy Overview

                18.1.6.5.1. Marketing Strategy

        18.1.7. MirrorMedia Ltd.

            18.1.7.1. Overview

            18.1.7.2. Product Portfolio

            18.1.7.3. Profitability by Market Segments

            18.1.7.4. Sales Footprint

            18.1.7.5. Strategy Overview

                18.1.7.5.1. Marketing Strategy

        18.1.8. LumiDesign

            18.1.8.1. Overview

            18.1.8.2. Product Portfolio

            18.1.8.3. Profitability by Market Segments

            18.1.8.4. Sales Footprint

            18.1.8.5. Strategy Overview

                18.1.8.5.1. Marketing Strategy

        18.1.9. Evervue USA Inc.

            18.1.9.1. Overview

            18.1.9.2. Product Portfolio

            18.1.9.3. Profitability by Market Segments

            18.1.9.4. Sales Footprint

            18.1.9.5. Strategy Overview

                18.1.9.5.1. Marketing Strategy

        18.1.10. Videotree

            18.1.10.1. Overview

            18.1.10.2. Product Portfolio

            18.1.10.3. Profitability by Market Segments

            18.1.10.4. Sales Footprint

            18.1.10.5. Strategy Overview

                18.1.10.5.1. Marketing Strategy

19. Assumptions & Acronyms Used

20. Research Methodology

List of Tables

Table 1: Global Market Value (US$ Million) Forecast by Region, 2018 to 2033

Table 2: Global Market Value (US$ Million) Forecast by Installation Type, 2018 to 2033

Table 3: Global Market Value (US$ Million) Forecast by Application, 2018 to 2033

Table 4: Global Market Value (US$ Million) Forecast by Distribution Channel, 2018 to 2033

Table 5: North America Market Value (US$ Million) Forecast by Country, 2018 to 2033

Table 6: North America Market Value (US$ Million) Forecast by Installation Type, 2018 to 2033

Table 7: North America Market Value (US$ Million) Forecast by Application, 2018 to 2033

Table 8: North America Market Value (US$ Million) Forecast by Distribution Channel, 2018 to 2033

Table 9: Latin America Market Value (US$ Million) Forecast by Country, 2018 to 2033

Table 10: Latin America Market Value (US$ Million) Forecast by Installation Type, 2018 to 2033

Table 11: Latin America Market Value (US$ Million) Forecast by Application, 2018 to 2033

Table 12: Latin America Market Value (US$ Million) Forecast by Distribution Channel, 2018 to 2033

Table 13: Europe Market Value (US$ Million) Forecast by Country, 2018 to 2033

Table 14: Europe Market Value (US$ Million) Forecast by Installation Type, 2018 to 2033

Table 15: Europe Market Value (US$ Million) Forecast by Application, 2018 to 2033

Table 16: Europe Market Value (US$ Million) Forecast by Distribution Channel, 2018 to 2033

Table 17: South Asia Market Value (US$ Million) Forecast by Country, 2018 to 2033

Table 18: South Asia Market Value (US$ Million) Forecast by Installation Type, 2018 to 2033

Table 19: South Asia Market Value (US$ Million) Forecast by Application, 2018 to 2033

Table 20: South Asia Market Value (US$ Million) Forecast by Distribution Channel, 2018 to 2033

Table 21: East Asia Market Value (US$ Million) Forecast by Country, 2018 to 2033

Table 22: East Asia Market Value (US$ Million) Forecast by Installation Type, 2018 to 2033

Table 23: East Asia Market Value (US$ Million) Forecast by Application, 2018 to 2033

Table 24: East Asia Market Value (US$ Million) Forecast by Distribution Channel, 2018 to 2033

Table 25: Oceania Market Value (US$ Million) Forecast by Country, 2018 to 2033

Table 26: Oceania Market Value (US$ Million) Forecast by Installation Type, 2018 to 2033

Table 27: Oceania Market Value (US$ Million) Forecast by Application, 2018 to 2033

Table 28: Oceania Market Value (US$ Million) Forecast by Distribution Channel, 2018 to 2033

Table 29: MEA Market Value (US$ Million) Forecast by Country, 2018 to 2033

Table 30: MEA Market Value (US$ Million) Forecast by Installation Type, 2018 to 2033

Table 31: MEA Market Value (US$ Million) Forecast by Application, 2018 to 2033

Table 32: MEA Market Value (US$ Million) Forecast by Distribution Channel, 2018 to 2033

List of Charts

Figure 1: Global Market Value (US$ Million) by Installation Type, 2023 to 2033

Figure 2: Global Market Value (US$ Million) by Application, 2023 to 2033

Figure 3: Global Market Value (US$ Million) by Distribution Channel, 2023 to 2033

Figure 4: Global Market Value (US$ Million) by Region, 2023 to 2033

Figure 5: Global Market Value (US$ Million) Analysis by Region, 2018 to 2033

Figure 6: Global Market Value Share (%) and BPS Analysis by Region, 2023 to 2033

Figure 7: Global Market Y-o-Y Growth (%) Projections by Region, 2023 to 2033

Figure 8: Global Market Value (US$ Million) Analysis by Installation Type, 2018 to 2033

Figure 9: Global Market Value Share (%) and BPS Analysis by Installation Type, 2023 to 2033

Figure 10: Global Market Y-o-Y Growth (%) Projections by Installation Type, 2023 to 2033

Figure 11: Global Market Value (US$ Million) Analysis by Application, 2018 to 2033

Figure 12: Global Market Value Share (%) and BPS Analysis by Application, 2023 to 2033

Figure 13: Global Market Y-o-Y Growth (%) Projections by Application, 2023 to 2033

Figure 14: Global Market Value (US$ Million) Analysis by Distribution Channel, 2018 to 2033

Figure 15: Global Market Value Share (%) and BPS Analysis by Distribution Channel, 2023 to 2033

Figure 16: Global Market Y-o-Y Growth (%) Projections by Distribution Channel, 2023 to 2033

Figure 17: Global Market Attractiveness by Installation Type, 2023 to 2033

Figure 18: Global Market Attractiveness by Application, 2023 to 2033

Figure 19: Global Market Attractiveness by Distribution Channel, 2023 to 2033

Figure 20: Global Market Attractiveness by Region, 2023 to 2033

Figure 21: North America Market Value (US$ Million) by Installation Type, 2023 to 2033

Figure 22: North America Market Value (US$ Million) by Application, 2023 to 2033

Figure 23: North America Market Value (US$ Million) by Distribution Channel, 2023 to 2033

Figure 24: North America Market Value (US$ Million) by Country, 2023 to 2033

Figure 25: North America Market Value (US$ Million) Analysis by Country, 2018 to 2033

Figure 26: North America Market Value Share (%) and BPS Analysis by Country, 2023 to 2033

Figure 27: North America Market Y-o-Y Growth (%) Projections by Country, 2023 to 2033

Figure 28: North America Market Value (US$ Million) Analysis by Installation Type, 2018 to 2033

Figure 29: North America Market Value Share (%) and BPS Analysis by Installation Type, 2023 to 2033

Figure 30: North America Market Y-o-Y Growth (%) Projections by Installation Type, 2023 to 2033

Figure 31: North America Market Value (US$ Million) Analysis by Application, 2018 to 2033

Figure 32: North America Market Value Share (%) and BPS Analysis by Application, 2023 to 2033

Figure 33: North America Market Y-o-Y Growth (%) Projections by Application, 2023 to 2033

Figure 34: North America Market Value (US$ Million) Analysis by Distribution Channel, 2018 to 2033

Figure 35: North America Market Value Share (%) and BPS Analysis by Distribution Channel, 2023 to 2033

Figure 36: North America Market Y-o-Y Growth (%) Projections by Distribution Channel, 2023 to 2033

Figure 37: North America Market Attractiveness by Installation Type, 2023 to 2033

Figure 38: North America Market Attractiveness by Application, 2023 to 2033

Figure 39: North America Market Attractiveness by Distribution Channel, 2023 to 2033

Figure 40: North America Market Attractiveness by Country, 2023 to 2033

Figure 41: Latin America Market Value (US$ Million) by Installation Type, 2023 to 2033

Figure 42: Latin America Market Value (US$ Million) by Application, 2023 to 2033

Figure 43: Latin America Market Value (US$ Million) by Distribution Channel, 2023 to 2033

Figure 44: Latin America Market Value (US$ Million) by Country, 2023 to 2033

Figure 45: Latin America Market Value (US$ Million) Analysis by Country, 2018 to 2033

Figure 46: Latin America Market Value Share (%) and BPS Analysis by Country, 2023 to 2033

Figure 47: Latin America Market Y-o-Y Growth (%) Projections by Country, 2023 to 2033

Figure 48: Latin America Market Value (US$ Million) Analysis by Installation Type, 2018 to 2033

Figure 49: Latin America Market Value Share (%) and BPS Analysis by Installation Type, 2023 to 2033

Figure 50: Latin America Market Y-o-Y Growth (%) Projections by Installation Type, 2023 to 2033

Figure 51: Latin America Market Value (US$ Million) Analysis by Application, 2018 to 2033

Figure 52: Latin America Market Value Share (%) and BPS Analysis by Application, 2023 to 2033

Figure 53: Latin America Market Y-o-Y Growth (%) Projections by Application, 2023 to 2033

Figure 54: Latin America Market Value (US$ Million) Analysis by Distribution Channel, 2018 to 2033

Figure 55: Latin America Market Value Share (%) and BPS Analysis by Distribution Channel, 2023 to 2033

Figure 56: Latin America Market Y-o-Y Growth (%) Projections by Distribution Channel, 2023 to 2033

Figure 57: Latin America Market Attractiveness by Installation Type, 2023 to 2033

Figure 58: Latin America Market Attractiveness by Application, 2023 to 2033

Figure 59: Latin America Market Attractiveness by Distribution Channel, 2023 to 2033

Figure 60: Latin America Market Attractiveness by Country, 2023 to 2033

Figure 61: Europe Market Value (US$ Million) by Installation Type, 2023 to 2033

Figure 62: Europe Market Value (US$ Million) by Application, 2023 to 2033

Figure 63: Europe Market Value (US$ Million) by Distribution Channel, 2023 to 2033

Figure 64: Europe Market Value (US$ Million) by Country, 2023 to 2033

Figure 65: Europe Market Value (US$ Million) Analysis by Country, 2018 to 2033

Figure 66: Europe Market Value Share (%) and BPS Analysis by Country, 2023 to 2033

Figure 67: Europe Market Y-o-Y Growth (%) Projections by Country, 2023 to 2033

Figure 68: Europe Market Value (US$ Million) Analysis by Installation Type, 2018 to 2033

Figure 69: Europe Market Value Share (%) and BPS Analysis by Installation Type, 2023 to 2033

Figure 70: Europe Market Y-o-Y Growth (%) Projections by Installation Type, 2023 to 2033

Figure 71: Europe Market Value (US$ Million) Analysis by Application, 2018 to 2033

Figure 72: Europe Market Value Share (%) and BPS Analysis by Application, 2023 to 2033

Figure 73: Europe Market Y-o-Y Growth (%) Projections by Application, 2023 to 2033

Figure 74: Europe Market Value (US$ Million) Analysis by Distribution Channel, 2018 to 2033

Figure 75: Europe Market Value Share (%) and BPS Analysis by Distribution Channel, 2023 to 2033

Figure 76: Europe Market Y-o-Y Growth (%) Projections by Distribution Channel, 2023 to 2033

Figure 77: Europe Market Attractiveness by Installation Type, 2023 to 2033

Figure 78: Europe Market Attractiveness by Application, 2023 to 2033

Figure 79: Europe Market Attractiveness by Distribution Channel, 2023 to 2033

Figure 80: Europe Market Attractiveness by Country, 2023 to 2033

Figure 81: South Asia Market Value (US$ Million) by Installation Type, 2023 to 2033

Figure 82: South Asia Market Value (US$ Million) by Application, 2023 to 2033

Figure 83: South Asia Market Value (US$ Million) by Distribution Channel, 2023 to 2033

Figure 84: South Asia Market Value (US$ Million) by Country, 2023 to 2033

Figure 85: South Asia Market Value (US$ Million) Analysis by Country, 2018 to 2033

Figure 86: South Asia Market Value Share (%) and BPS Analysis by Country, 2023 to 2033

Figure 87: South Asia Market Y-o-Y Growth (%) Projections by Country, 2023 to 2033

Figure 88: South Asia Market Value (US$ Million) Analysis by Installation Type, 2018 to 2033

Figure 89: South Asia Market Value Share (%) and BPS Analysis by Installation Type, 2023 to 2033

Figure 90: South Asia Market Y-o-Y Growth (%) Projections by Installation Type, 2023 to 2033

Figure 91: South Asia Market Value (US$ Million) Analysis by Application, 2018 to 2033

Figure 92: South Asia Market Value Share (%) and BPS Analysis by Application, 2023 to 2033

Figure 93: South Asia Market Y-o-Y Growth (%) Projections by Application, 2023 to 2033

Figure 94: South Asia Market Value (US$ Million) Analysis by Distribution Channel, 2018 to 2033

Figure 95: South Asia Market Value Share (%) and BPS Analysis by Distribution Channel, 2023 to 2033

Figure 96: South Asia Market Y-o-Y Growth (%) Projections by Distribution Channel, 2023 to 2033

Figure 97: South Asia Market Attractiveness by Installation Type, 2023 to 2033

Figure 98: South Asia Market Attractiveness by Application, 2023 to 2033

Figure 99: South Asia Market Attractiveness by Distribution Channel, 2023 to 2033

Figure 100: South Asia Market Attractiveness by Country, 2023 to 2033

Figure 101: East Asia Market Value (US$ Million) by Installation Type, 2023 to 2033

Figure 102: East Asia Market Value (US$ Million) by Application, 2023 to 2033

Figure 103: East Asia Market Value (US$ Million) by Distribution Channel, 2023 to 2033

Figure 104: East Asia Market Value (US$ Million) by Country, 2023 to 2033

Figure 105: East Asia Market Value (US$ Million) Analysis by Country, 2018 to 2033

Figure 106: East Asia Market Value Share (%) and BPS Analysis by Country, 2023 to 2033

Figure 107: East Asia Market Y-o-Y Growth (%) Projections by Country, 2023 to 2033

Figure 108: East Asia Market Value (US$ Million) Analysis by Installation Type, 2018 to 2033

Figure 109: East Asia Market Value Share (%) and BPS Analysis by Installation Type, 2023 to 2033

Figure 110: East Asia Market Y-o-Y Growth (%) Projections by Installation Type, 2023 to 2033

Figure 111: East Asia Market Value (US$ Million) Analysis by Application, 2018 to 2033

Figure 112: East Asia Market Value Share (%) and BPS Analysis by Application, 2023 to 2033

Figure 113: East Asia Market Y-o-Y Growth (%) Projections by Application, 2023 to 2033

Figure 114: East Asia Market Value (US$ Million) Analysis by Distribution Channel, 2018 to 2033

Figure 115: East Asia Market Value Share (%) and BPS Analysis by Distribution Channel, 2023 to 2033

Figure 116: East Asia Market Y-o-Y Growth (%) Projections by Distribution Channel, 2023 to 2033

Figure 117: East Asia Market Attractiveness by Installation Type, 2023 to 2033

Figure 118: East Asia Market Attractiveness by Application, 2023 to 2033

Figure 119: East Asia Market Attractiveness by Distribution Channel, 2023 to 2033

Figure 120: East Asia Market Attractiveness by Country, 2023 to 2033

Figure 121: Oceania Market Value (US$ Million) by Installation Type, 2023 to 2033

Figure 122: Oceania Market Value (US$ Million) by Application, 2023 to 2033

Figure 123: Oceania Market Value (US$ Million) by Distribution Channel, 2023 to 2033

Figure 124: Oceania Market Value (US$ Million) by Country, 2023 to 2033

Figure 125: Oceania Market Value (US$ Million) Analysis by Country, 2018 to 2033

Figure 126: Oceania Market Value Share (%) and BPS Analysis by Country, 2023 to 2033

Figure 127: Oceania Market Y-o-Y Growth (%) Projections by Country, 2023 to 2033

Figure 128: Oceania Market Value (US$ Million) Analysis by Installation Type, 2018 to 2033

Figure 129: Oceania Market Value Share (%) and BPS Analysis by Installation Type, 2023 to 2033

Figure 130: Oceania Market Y-o-Y Growth (%) Projections by Installation Type, 2023 to 2033

Figure 131: Oceania Market Value (US$ Million) Analysis by Application, 2018 to 2033

Figure 132: Oceania Market Value Share (%) and BPS Analysis by Application, 2023 to 2033

Figure 133: Oceania Market Y-o-Y Growth (%) Projections by Application, 2023 to 2033

Figure 134: Oceania Market Value (US$ Million) Analysis by Distribution Channel, 2018 to 2033

Figure 135: Oceania Market Value Share (%) and BPS Analysis by Distribution Channel, 2023 to 2033

Figure 136: Oceania Market Y-o-Y Growth (%) Projections by Distribution Channel, 2023 to 2033

Figure 137: Oceania Market Attractiveness by Installation Type, 2023 to 2033

Figure 138: Oceania Market Attractiveness by Application, 2023 to 2033

Figure 139: Oceania Market Attractiveness by Distribution Channel, 2023 to 2033

Figure 140: Oceania Market Attractiveness by Country, 2023 to 2033

Figure 141: MEA Market Value (US$ Million) by Installation Type, 2023 to 2033

Figure 142: MEA Market Value (US$ Million) by Application, 2023 to 2033

Figure 143: MEA Market Value (US$ Million) by Distribution Channel, 2023 to 2033

Figure 144: MEA Market Value (US$ Million) by Country, 2023 to 2033

Figure 145: MEA Market Value (US$ Million) Analysis by Country, 2018 to 2033

Figure 146: MEA Market Value Share (%) and BPS Analysis by Country, 2023 to 2033

Figure 147: MEA Market Y-o-Y Growth (%) Projections by Country, 2023 to 2033

Figure 148: MEA Market Value (US$ Million) Analysis by Installation Type, 2018 to 2033

Figure 149: MEA Market Value Share (%) and BPS Analysis by Installation Type, 2023 to 2033

Figure 150: MEA Market Y-o-Y Growth (%) Projections by Installation Type, 2023 to 2033

Figure 151: MEA Market Value (US$ Million) Analysis by Application, 2018 to 2033

Figure 152: MEA Market Value Share (%) and BPS Analysis by Application, 2023 to 2033

Figure 153: MEA Market Y-o-Y Growth (%) Projections by Application, 2023 to 2033

Figure 154: MEA Market Value (US$ Million) Analysis by Distribution Channel, 2018 to 2033

Figure 155: MEA Market Value Share (%) and BPS Analysis by Distribution Channel, 2023 to 2033

Figure 156: MEA Market Y-o-Y Growth (%) Projections by Distribution Channel, 2023 to 2033

Figure 157: MEA Market Attractiveness by Installation Type, 2023 to 2033

Figure 158: MEA Market Attractiveness by Application, 2023 to 2033

Figure 159: MEA Market Attractiveness by Distribution Channel, 2023 to 2033

Figure 160: MEA Market Attractiveness by Country, 2023 to 2033

Recommendations

Technology

Smart Fitness Market

Published : June 2023

Consumer Product

Bathroom Mirror Wiper Market

Published : October 2021

Consumer Product

Fog Free Mirrors Market

Published : September 2021

Explore Consumer Product Insights

View Reports