Smart Pet Collar Market Size and Share Forecast Outlook 2025 to 2035

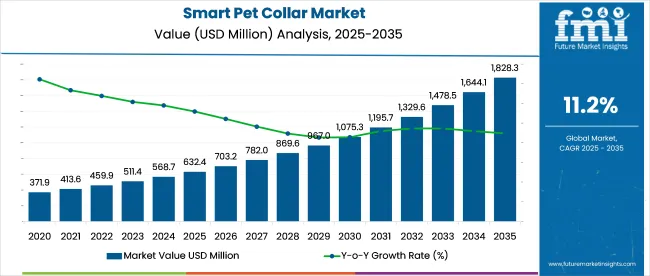
Global sales of smart pet collar market are forecast to grow from USD 632.4 million in 2025 to USD 1,820.7 million by 2035, with a CAGR of 11.2%. Demand is driven by GPS tracking, biometric sensing, and bundled subscription services that raise average revenue per unit. Manufacturers are improving battery efficiency and integrating low-latency chipsets.

Quick Stats of the Smart Pet Collar Market

  • Industry Value (2025): USD 632.4 million
  • Forecast Value (2035): USD 1,820.7 million
  • Global CAGR (2025 to 2035): 11.2%
  • Leading Segment in 2025: GPS-Based Collars (~61% share)
  • Key Growth Region: Asia Pacific
  • Key Companies: Whistle Labs Inc., Garmin Ltd., Fi, Tractive GmbH, PetPace Ltd., Wagz Inc.

Smart Pet Collar Market

Metric Value
Industry Value (2025) USD 632.4 million
Industry Value (2035) USD 1,820.7 million
CAGR (2025 to 2035) 11.2%

OEM agreements are securing access to encrypted connectivity stacks, while regulatory compliance in North America and Europe is shaping firmware standards. Production is shifting closer to East Asia to shorten lead times. Dual-band GPS and eSIM functionality are being added alongside preventive health features.

At CES 2025, SATELLAI introduced a satellite-enabled smart pet collar featuring health monitoring, activity tracking, and an AI coaching system for personalized care guidance. Founded by Mark Mao, formerly of Huami, the device integrates seven sensors to track metrics like heart and breath rate.

Unlike typical LTE-based devices, it uses a Qualcomm 9205S modem for direct satellite communication, ensuring location tracking in remote areas. Dual-band GPS (L1 and L5) enhances accuracy around dense obstacles, while built-in solar charging extends usability. Additional functions include virtual fencing and behavioral feedback to prevent unwanted activity, positioning SATELLAI as a next-gen player in smart pet tech.

The smart pet collar market accounts for approximately 6-8% of the broader pet tech market, reflecting increasing adoption of connected pet devices. Within the wearable technology market, its share remains limited at around 0.5-0.7%, given the dominance of human-focused wearables. In the IoT devices ecosystem, where smart home and industrial applications dominate, smart pet collars represent less than 0.3% of total devices.

As part of the GPS tracking and location services segment, they contribute about 1-2%, with use cases centered on geofencing and real-time pet tracking. In the animal health monitoring systems category, the share is higher at 4-5%, as collars equipped with biometric sensors gain ground for activity tracking, early illness detection, and behavior analysis in companion animals

Analyzing Smart Pet Collar Market by Top Investment Segments

The industry is segmented by product type (GPS-based, others), component (displays, others), sales channel (online, others), price (mass/economic, premium), and application (tracking, training, monitoring, others). Regional analysis includes North America, Latin America, Western Europe, Eastern Europe, Russia & Belarus, Central Asia, East Asia, South Asia & Pacific, and Middle East & Africa.
GPS-Based Collars Dominate Product Type Segment

Smart Pet Collar Market Analysis By Product Type

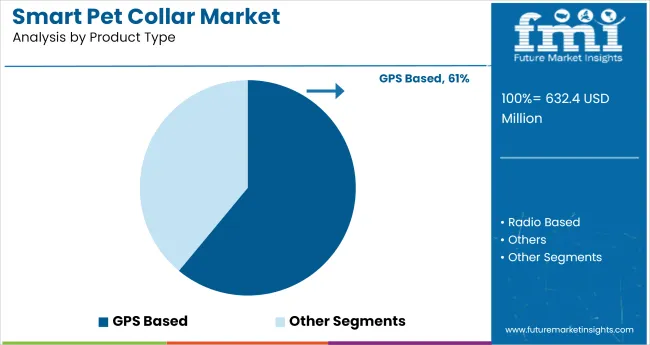
GPS-based collars are projected to lead the product type segment, accounting for 61% of the industry share in 2025. Brands like Tractive, Fi, and Whistle have popularized collars offering real-time location, escape alerts, and multi-pet tracking via mobile apps.

These products are particularly favored in dense metropolitansectors such as New York, London, and Tokyo. Integration with Apple Find My and Google Maps has improved accessibility and range precision. GPS collars are also being bundled with activity and health monitoring features to support lifestyle tracking.
  • Tractive’s GPS 2.0 offers global coverage with 5-day battery life.
  • Fi Smart Collar uses LTE-M for low-power, long-range tracking.
  • Geofencing features support compliance in leash-regulated metropolitan zones.

Displays Lead the Component Segment

Smart Pet Collar Market Analysis By Component

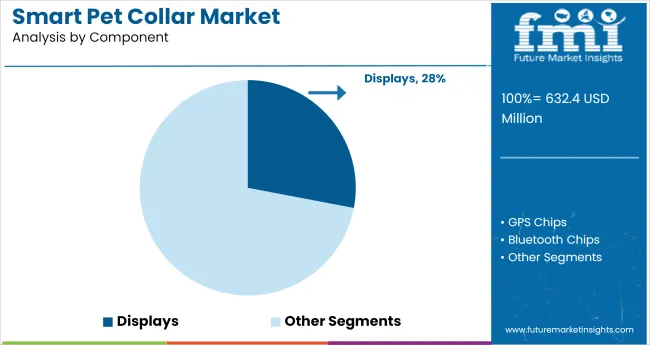
Displays are expected to hold 28% of the component segment in 2025. Collars with built-in screens from brands like Wagz and PetBiz allow immediate access to pet stats, reducing reliance on smartphone apps. E-ink displays are gaining traction for their energy efficiency and visibility in outdoor conditions.

In dog parks and shared-use environments, visible alerts such as “needs rest” or “battery low” are helpful for caretakers. Display-enabled collars are also being used by dog walkers and pet boarders who require quick access to status updates without app logins.
  • Wagz Freedom Smart Collar uses on-screen prompts to indicate location mode.
  • PetBiz Fitness Tracker shows hydration and calorie burn status.
  • OLED-based displays support scrolling data for active monitoring.

Online Sales Channels Drive Consumer Reach

Smart Pet Collar Market Analysis By Sales Channel

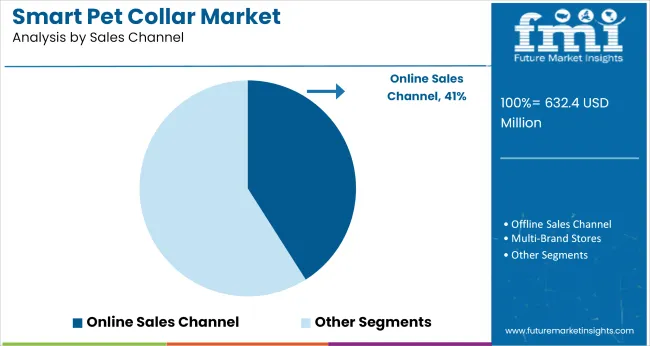
Online sales are projected to contribute 41% share in 2025. Brands such as Halo Collar, Link My Pet, and PetPace drive most of their volume through D2C channels, offering firmware upgrades, warranties, and bundled services online.

Amazon and Chewy have become key third-party platforms for multi-brand visibility. E-commerce also allows for cross-selling of accessories like smart feeders and Wi-Fi-enabled pet doors. Online buyers benefit from customer reviews and video tutorials, which aid in adoption.
  • Halo Collar partners with pet trainers for digital onboarding.
  • PetPace offers app-based firmware support via D2C channels.
  • Subscription renewals for GPS services are integrated at checkout.

Mass/Economic Collars Capture Price-Sensitive Demand

Smart Pet Collar Market Analysis By Price

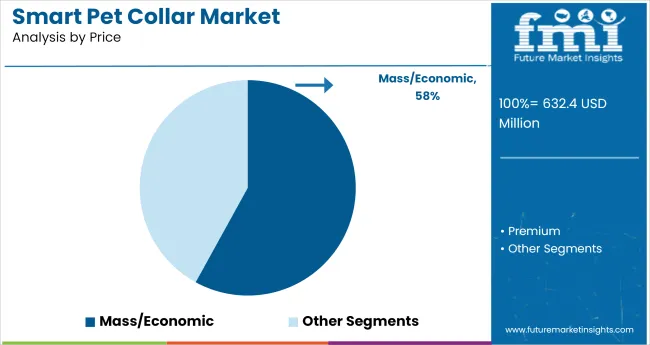
Mass/economic collars are forecasted to represent 58% of sales by 2025. Products like the FitBark GPS Dog Tracker and BARTUN Mini Pet Tracker offer basic tracking at half the cost of premium models. These devices are popular in multi-pet households and entry-level segments across India, Brazil, and Indonesia. Brands are focusing on modular software models, where users can unlock premium features over time. Bluetooth-only variants are also gaining traction in rural zones with limited mobile coverage.
  • FitBark offers wellness scoring at sub-USD 100 price points.
  • BARTUN GPS works with both 2G SIM and Wi-Fi fallback.
  • Modular feature upgrades allow users to access services as needed.

Tracking Applications Lead Use-Case Adoption

Smart Pet Collar Market Analysis By Application

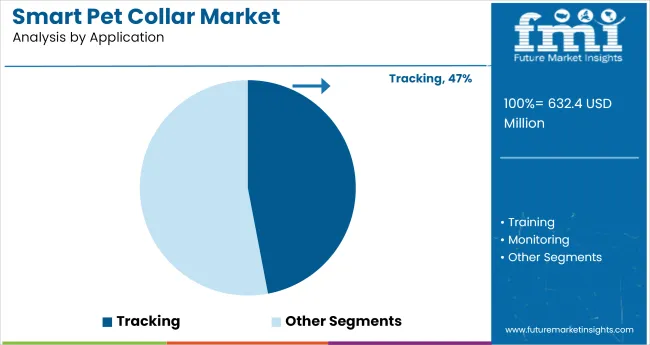
Tracking is expected to dominate the application segment, capturing 47% share in 2025. Pet owners use collars like Jiobit Smart Tag and Link AKC to monitor pet movements, enforce geofences, and review daily route history. For active pets or those prone to wandering, GPS + LTE combinations have become standard. Insurance providers such as Trupanion and Petplan are beginning to use collar data to assess claims. Veterinary groups in the USA and Europe are also integrating location logs into behavioral diagnostics.

  • Jiobit Smart Tag enables multi-day route logs for analysis.
  • Link AKC offers adventure mode for off-grid tracking.
  • Pet insurers are testing collars as wellness scoring inputs.

Top Smart Pet Collar Market Dynamics

The industry is being shaped by a convergence of pet humanization, remote monitoring needs, and expanding connected-device ecosystems. As spending on companion animal wellness continues to rise, manufacturers are prioritizing collars with GPS tracking, biometric monitoring, and app-based behavior alerts. The short battery cycles, regional connectivity issues, and limited standardization across platforms are posing operational challenges.

Surge in Demand for Connected Pet Health and Safety Tools

Pet owners are increasingly adopting smart collars that offer real-time location, heart rate monitoring, and boundary alerts. Integration with mobile apps allows data sharing with veterinarians and behaviorists, enhancing preventive care. The rise in pet insurance and wellness subscription models is reinforcing collar-linked diagnostics, mainly in metropolitan sectors.

  • GPS, geofencing, and vitals tracking are being bundled in mid- to high-range models.
  • Pet owners drive collar adoption through app ecosystems.
  • Collar-based data supports insurer risk models and tele-vet diagnostics.

Product Fragmentation, Connectivity Constraints, and User Fatigue

Hardware limitations, battery life inconsistencies, and app synchronization issues continue to hinder user retention. Connectivity lapses in rural or indoor settings reduce tracking accuracy. As collar SKUs proliferate, product differentiation is increasingly tied to subscription ecosystems and customer service experience rather than hardware alone.
  • Short battery cycles and poor indoor reception reduce real-time tracking reliability.
  • Fragmented app compatibility limits ease-of-use across devices and brands.
  • Subscription fatigue sets in as overlapping services blur value propositions.

Top Countries Designing, Distributing, and Scaling Smart Pet Collar Adoption

Country Wise Analysis Of Smart Pet Collar Market

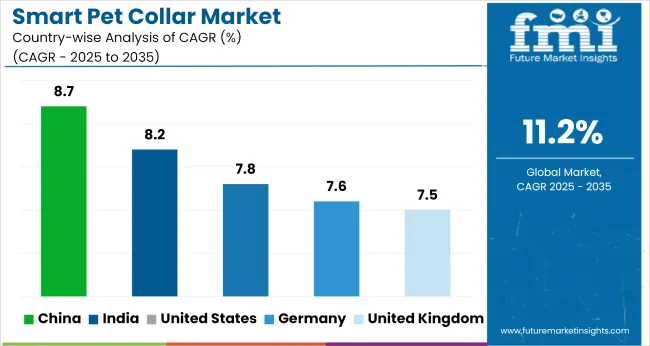
The report covers detailed analysis of 40+ countries and the top five countries have been shared as a reference.

Countries CAGR (2025 to 2035)
United States 7.8%
United Kingdom 7.5%
Germany 7.6%
India 8.2%
China 8.7%

The global smart pet collar market is projected to grow at an 11.2% CAGR from 2025 to 2035. China leads the profiled countries with 8.7%, although still 2.5 percentage points below the global pace. Growth is being supported by rising pet ownership and expanding demand for GPS-enabled, health-monitoring collars. India follows at 8.2%, with strong interest in activity-tracking features and growing availability through D2C platforms and pet care retailers.

The United States posts a 7.8% CAGR, while Germany and the United Kingdom trail closely at 7.6% and 7.5% respectively. These OECD markets are underperforming the global average by more than 3 points. Slower product upgrade cycles, stricter compliance around location tracking, and limited price accessibility outside core demand pockets are holding back broader adoption.

Growth Outlook of the Smart Pet Collar Market in the United States

Demand for smart pet collar in the United States is expect to expand at a CAGR of 7.8% from 2025 to 2035. Demand is led by households investing in GPS tracking, health monitoring, and behavior analytics. Widespread integration with home automation systems enhances collar utility.

Retailers and e-commerce platforms are bundling collars with wellness services, driving adoption in households with multiple pets. The market benefits from a mix of regulated standards and high compatibility with smart devices.

  • Strong demand for GPS and wellness tracking integration
  • Premium product growth supported by smart home adoption
  • High e-commerce penetration in pet tech categories

Growth Forecast of the Smart Pet Collar Market in the United Kingdom

The UK smart pet collar industry is anticipated to grow at a 7.5% CAGR through 2035. Demand is concentrated in households prioritizing pet safety and activity monitoring. Collars with geofencing, real-time alerts, and mobile app pairing are increasingly preferred. Consumers are responsive to pet well-being trends, particularly among dog owners. Industry share is shifting toward brands offering reliable support, simplified interfaces, and locally adapted pricing models.

  • Demand for geofencing and behavior-linked analytics
  • Growth in pet spending across flexible work households
  • UK-based brands gaining share through local distribution

Smart Pet Collar Market Analysis in Germany

Sales for smart pet collarsin Germanyare growing at a CAGR of 7.6% from 2025 to 2035. Tech-enabled pet care is gaining momentum, with consumers favoring collars offering GPS, temperature sensing, and real-time monitoring. Buyers prioritize EU-standard safety compliance and software integration with German-language platforms. Local manufacturers are scaling niche solutions with enhanced durability and low power usage, appealing to buyers with performance and quality expectations.

  • Preference for EU-compliant, high-specification products
  • Integration with smart home and wearables infrastructure
  • Compliance-driven growth across premium product categories

Growth Trajectory of the Smart Pet Collar Market in India

The smart pet collar industry in India is expanding at an 8.2% CAGR, fueled by a rising pet population in large cities and mid-sized towns. Online-first adoption dominates, with price-sensitive buyers opting for collars offering GPS and anti-theft features. Mobile app compatibility, Hindi-language UI, and wallet-friendly pricing have strengthened local brand traction. Health-focused features are gradually emerging, although demand remains strongest for tracking, zone alerts, and real-time location updates.

  • Mobile-first adoption with Android-linked collar demand
  • D2C brands penetrating the non-metro industry with cost innovation
  • Strong growth in tracking and anti-theft feature adoption

Smart Pet Collar Demand Outlook in China

The Chinese market for smart pet collars is forecast to grow at an 8.7% CAGR from 2025 to 2035. Mass ownership of companion animals combined with in-house manufacturing strength has led to cost-efficient innovation. Feature-rich collars with AI behavior recognition, biometric sensors, and bilingual app support are being mass-produced. Local governments have begun promoting collar use in cities with dense pet populations, reinforcing public health and animal control goals.
  • AI-enhanced collars with real-time data feedback
  • Mass industry growth supported by domestic production scale
  • Pet registration policies accelerating GPS collar adoption

Leading Companies in Smart Pet Collar Market

Smart Pet Collar Market Analysis By Company

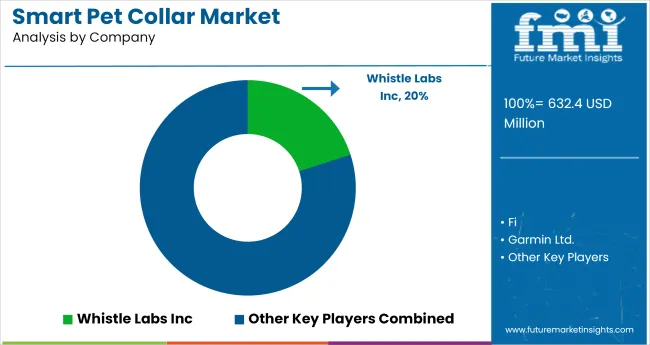
Leading Company - Whistle Labs Inc.Industry Share - ~20%

In the smart pet collar industry, companies are scaling through a mix of IoT innovation, health monitoring integration, and pet lifestyle connectivity. Leading firms like Whistle Labs Inc., Fi, and Garmin Ltd. dominate by offering GPS-enabled collars with biometric tracking, leveraging strong brand equity and omni-channel reach across North America and Europe. Their infrastructure supports real-time diagnostics, cloud-based pet profiles, and subscription models.

Key players such as PetPace Ltd., Link AKC, and Tractive GmbH focus on niche segments like geriatric pets or outdoor tracking, with localized tech compliance. Emerging players including Wagz Inc., Dogtra, and Scollar are expanding through app-based ecosystems, flexible pricing, and direct-to-consumer channels. Success depends on three priorities real-time health insights, app-collar integration, and platform scalability across device families.

Recent Industry News

  • In January 2025, Tractive debuted its next-generation smart collar at CES, featuring GPS tracking, Bark Monitoring, and alerts for heart rate and respiration. This launch reflects growing emphasis on behavior-based diagnostics in pet health monitoring systems.
  • In June 2025, Fi introduced the world’s first AI-powered smart dog collar, the Series 3+, capable of tracking location, health indicators, licking and scratching behavior, and detecting escape attempts. Integrated with Apple Watch, the device signals a shift toward real-time, AI-driven pet wellness solutions.

Key Companies in Smart Pet Collar Market

  • Whistle
  • Fit Bark
  • Findster
  • Link AKC
  • KYON
  • Tractive
  • Pet Pace
  • PETBLE
  • Find My Pet
  • DOTT

Research Coverage and Scope Summary

Report Attributes Details
Industry Size (2025) USD 632.4 million
Projected Industry Size (2035) USD 1,820.7 million
CAGR (2025 to 2035) 11.2%
Base Year for Estimation 2024
Historical Period 2020 to 2024
Projections Period 2025 to 2035
Quantitative Units USD million for value and million units for volume
Product Types Analyzed (Segment 1) GPS Based, Radio Based, Others
Components Analyzed (Segment 2) Displays, GPS Chips, Bluetooth Chips, Sensors
Sales Channels Analyzed (Segment 3) Online Sales Channel, Offline Sales Channel, Multi-Brand Stores, Supermarkets/Hypermarkets, Other Sales Channel
Price Tiers Analyzed (Segment 4) Mass/Economic, Premium
Applications Analyzed (Segment 5) Training, Tracking, Monitoring
Regions Covered North America, Latin America, Western Europe, Eastern Europe, Asia Pacific, East Asia, Middle East & Africa
Countries Covered United States, Canada, Germany, United Kingdom, France, Italy, Spain, China, India, Japan, South Korea, Australia, Brazil, Mexico, Argentina, Saudi Arabia, UAE, South Africa
Key Players Whistle, Fit Bark, Findster, Link AKC, KYON, Tractive, Pet Pace, PETBLE, Find My Pet, DOTT
Additional Attributes Dollar sales, share by product and application, real-time GPS tracking adoption, expansion in premium collar segment, regional e-commerce penetration and pet ownership patterns

Key Segments

By Product Type:

The segment is categorized into GPS Based, Radio Based, and Others.

By Component:

This includes Displays, GPS Chips, Bluetooth Chips, and Sensors.

By Sales Channel:

The industry is segmented into Online Sales Channel, Offline Sales Channel, Multi-Brand Stores, Supermarkets/Hypermarkets, and Other Sales Channel.

By Price:

The segment is divided into Mass/Economic and Premium.

By Application:

This segment covers Training, Tracking, and Monitoring.

By Region:

Regional analysis includes North America, Latin America, Western Europe, Eastern Europe, Asia Pacific, East Asia, and Middle East & Africa.

Table of Content

  1. Executive Summary
    • Global Market Outlook
    • Demand-side Trends
    • Supply-side Trends
    • Technology Roadmap Analysis
    • Analysis and Recommendations
  2. Market Overview
    • Market Coverage/Taxonomy
    • Market Definition/Scope/Limitations
  3. Market Background
    • Market Dynamics
      • Drivers
      • Restraints
      • Opportunity
      • Trends
    • Scenario Forecast
      • Demand in Optimistic Scenario
      • Demand in Likely Scenario
      • Demand in Conservative Scenario
    • Opportunity Map Analysis
    • Product Life Cycle Analysis
    • Supply Chain Analysis
      • Supply Side Participants and their Roles
        • Producers
        • Mid-Level Participants (Traders/ Agents/ Brokers)
        • Wholesalers and Distributors
      • Value Added and Value Created at Node in the Supply Chain
      • List of Raw Material Suppliers
      • List of Existing and Potential Buyer’s
    • Investment Feasibility Matrix
    • Value Chain Analysis
      • Profit Margin Analysis
      • Wholesalers and Distributors
      • Retailers
    • PESTLE and Porter’s Analysis
    • Regulatory Landscape
      • By Key Regions
      • By Key Countries
    • Regional Parent Market Outlook
    • Production and Consumption Statistics
    • Import and Export Statistics
  4. Global Market Analysis 2020 to 2024 and Forecast, 2025 to 2035
    • Historical Market Size Value (USD Million) & Volume (Million Units) Analysis, 2020 to 2024
    • Current and Future Market Size Value (USD Million) & Volume (Million Units) Projections, 2025 to 2035
      • Y-o-Y Growth Trend Analysis
      • Absolute $ Opportunity Analysis
  5. Global Market Pricing Analysis 2020 to 2024 and Forecast 2025 to 2035
  6. Global Market Analysis 2020 to 2024 and Forecast 2025 to 2035, By Product Type
    • Introduction/Key Findings
    • Historical Market Size Value (USD Million) & Volume (Million Units) Analysis by Product Type, 2020 to 2024
    • Current and Future Market Size Value (USD Million) & Volume (Million Units) Analysis and Forecast by Product Type, 2025 to 2035
      • GPS Based
      • Radio Based
      • Others
    • Y-o-Y Growth Trend Analysis by Product Type, 2020 to 2024
    • Absolute $ Opportunity Analysis By Product Type, 2025 to 2035
  7. Global Market Analysis 2020 to 2024 and Forecast 2025 to 2035, By Component
    • Introduction/Key Findings
    • Historical Market Size Value (USD Million) & Volume (Million Units) Analysis By Component, 2020 to 2024
    • Current and Future Market Size Value (USD Million) & Volume (Million Units) Analysis and Forecast By Component, 2025 to 2035
      • Displays
      • GPS Chips
      • Bluetooth Chips
      • Sensors
    • Y-o-Y Growth Trend Analysis By Component, 2020 to 2024
    • Absolute $ Opportunity Analysis By Component, 2025 to 2035
  8. Global Market Analysis 2020 to 2024 and Forecast 2025 to 2035, By Sales Channel
    • Introduction/Key Findings
    • Historical Market Size Value (USD Million) & Volume (Million Units) Analysis By Sales Channel, 2020 to 2024
    • Current and Future Market Size Value (USD Million) & Volume (Million Units) Analysis and Forecast By Sales Channel, 2025 to 2035
      • Online Sales Channel
      • Offline Sales Channel
      • Multi-Brand Stores
      • Supermarkets/Hypermarkets
      • Other Sales Channel
    • Y-o-Y Growth Trend Analysis By Sales Channel, 2020 to 2024
    • Absolute $ Opportunity Analysis By Sales Channel, 2025 to 2035
  9. Global Market Analysis 2020 to 2024 and Forecast 2025 to 2035, By Price
    • Introduction/Key Findings
    • Historical Market Size Value (USD Million) & Volume (Million Units) Analysis By Price, 2020 to 2024
    • Current and Future Market Size Value (USD Million) & Volume (Million Units) Analysis and Forecast By Price, 2025 to 2035
      • Mass/Economic
      • Premium
    • Y-o-Y Growth Trend Analysis By Price, 2020 to 2024
    • Absolute $ Opportunity Analysis By Price, 2025 to 2035
  10. Global Market Analysis 2020 to 2024 and Forecast 2025 to 2035, By Application
    • Introduction/Key Findings
    • Historical Market Size Value (USD Million) & Volume (Million Units) Analysis By Application, 2020 to 2024
    • Current and Future Market Size Value (USD Million) & Volume (Million Units) Analysis and Forecast By Application, 2025 to 2035
      • Training
      • Tracking
      • Monitoring
    • Y-o-Y Growth Trend Analysis By Application, 2020 to 2024
    • Absolute $ Opportunity Analysis By Application, 2025 to 2035
  11. Global Market Analysis 2020 to 2024 and Forecast 2025 to 2035, By Region
    • Introduction
    • Historical Market Size Value (USD Million) & Volume (Million Units) Analysis By Region, 2020 to 2024
    • Current Market Size Value (USD Million) & Volume (Million Units) Analysis and Forecast By Region, 2025 to 2035
      • North America
      • Latin America
      • Western Europe
      • Eastern Europe
      • East Asia
      • South Asia & Pacific
      • Middle East and Africa
    • Market Attractiveness Analysis By Region
  12. North America Market Analysis 2020 to 2024 and Forecast 2025 to 2035, By Country
    • Historical Market Size Value (USD Million) & Volume (Million Units) Trend Analysis By Market Taxonomy, 2020 to 2024
    • Market Size Value (USD Million) & Volume (Million Units) Forecast By Market Taxonomy, 2025 to 2035
      • By Country
        • USA
        • Canada
        • Mexico
      • By Product Type
      • By Component
      • By Sales Channel
      • By Price
      • By Application
    • Market Attractiveness Analysis
      • By Country
      • By Product Type
      • By Component
      • By Sales Channel
      • By Price
      • By Application
    • Key Takeaways
  13. Latin America Market Analysis 2020 to 2024 and Forecast 2025 to 2035, By Country
    • Historical Market Size Value (USD Million) & Volume (Million Units) Trend Analysis By Market Taxonomy, 2020 to 2024
    • Market Size Value (USD Million) & Volume (Million Units) Forecast By Market Taxonomy, 2025 to 2035
      • By Country
        • Brazil
        • Argentina
        • Rest of LATAM
      • By Product Type
      • By Component
      • By Sales Channel
      • By Price
      • By Application
    • Market Attractiveness Analysis
      • By Country
      • By Product Type
      • By Component
      • By Sales Channel
      • By Price
      • By Application
    • Key Takeaways
  14. Western Europe Market Analysis 2020 to 2024 and Forecast 2025 to 2035, By Country
    • Historical Market Size Value (USD Million) & Volume (Million Units) Trend Analysis By Market Taxonomy, 2020 to 2024
    • Market Size Value (USD Million) & Volume (Million Units) Forecast By Market Taxonomy, 2025 to 2035
      • By Country
        • Germany
        • Italy
        • France
        • UK
        • Spain
        • BENELUX
        • Nordic
        • Rest of W.Europe
      • By Product Type
      • By Component
      • By Sales Channel
      • By Price
      • By Application
    • Market Attractiveness Analysis
      • By Country
      • By Product Type
      • By Component
      • By Sales Channel
      • By Price
      • By Application
    • Key Takeaways
  15. Eastern Europe Market Analysis 2020 to 2024 and Forecast 2025 to 2035, By Country
    • Historical Market Size Value (USD Million) & Volume (Million Units) Trend Analysis By Market Taxonomy, 2020 to 2024
    • Market Size Value (USD Million) & Volume (Million Units) Forecast By Market Taxonomy, 2025 to 2035
      • By Country
        • Russia
        • Hungary
        • Poland
        • Balkan & Baltics
        • Rest of E. Europe
      • By Product Type
      • By Component
      • By Sales Channel
      • By Price
      • By Application
    • Market Attractiveness Analysis
      • By Country
      • By Product Type
      • By Component
      • By Sales Channel
      • By Price
      • By Application
    • Key Takeaways
  16. East Asia Market Analysis 2020 to 2024 and Forecast 2025 to 2035, By Country
    • Historical Market Size Value (USD Million) & Volume (Million Units) Trend Analysis By Market Taxonomy, 2020 to 2024
    • Market Size Value (USD Million) & Volume (Million Units) Forecast By Market Taxonomy, 2025 to 2035
      • By Country
        • China
        • Japan
        • South Korea
      • By Product Type
      • By Component
      • By Sales Channel
      • By Price
      • By Application
    • Market Attractiveness Analysis
      • By Country
      • By Product Type
      • By Component
      • By Sales Channel
      • By Price
      • By Application
    • Key Takeaways
  17. South Asia & Pacific Market Analysis 2020 to 2024 and Forecast 2025 to 2035, By Country
    • Historical Market Size Value (USD Million) & Volume (Million Units) Trend Analysis By Market Taxonomy, 2020 to 2024
    • Market Size Value (USD Million) & Volume (Million Units) Forecast By Market Taxonomy, 2025 to 2035
      • By Country
        • India
        • Australia & New Zealand
        • ASEAN
        • Rest of SAP
      • By Product Type
      • By Component
      • By Sales Channel
      • By Price
      • By Application
    • Market Attractiveness Analysis
      • By Country
      • By Product Type
      • By Component
      • By Sales Channel
      • By Price
      • By Application
    • Key Takeaways
  18. Middle East and Africa Market Analysis 2020 to 2024 and Forecast 2025 to 2035, By Country
    • Historical Market Size Value (USD Million) & Volume (Million Units) Trend Analysis By Market Taxonomy, 2020 to 2024
    • Market Size Value (USD Million) & Volume (Million Units) Forecast By Market Taxonomy, 2025 to 2035
      • By Country
        • GCC Countries
        • Northern Africa
        • South Africa
        • Turkiye
        • Rest of MEA
      • By Product Type
      • By Component
      • By Sales Channel
      • By Price
      • By Application
    • Market Attractiveness Analysis
      • By Country
      • By Product Type
      • By Component
      • By Sales Channel
      • By Price
      • By Application
    • Key Takeaways
  19. Key Countries Market Analysis
    • USA
      • Pricing Analysis
      • Market Share Analysis, 2024
        • By Product Type
        • By Component
        • By Sales Channel
        • By Price
        • By Application
    • Canada
      • Pricing Analysis
      • Market Share Analysis, 2024
        • By Product Type
        • By Component
        • By Sales Channel
        • By Price
        • By Application
    • Brazil
      • Pricing Analysis
      • Market Share Analysis, 2024
        • By Product Type
        • By Component
        • By Sales Channel
        • By Price
        • By Application
    • Mexico
      • Pricing Analysis
      • Market Share Analysis, 2024
        • By Product Type
        • By Component
        • By Sales Channel
        • By Price
        • By Application
    • Argentina
      • Pricing Analysis
      • Market Share Analysis, 2024
        • By Product Type
        • By Component
        • By Sales Channel
        • By Price
        • By Application
  20. Market Structure Analysis
    • Competition Dashboard
    • Competition Benchmarking
    • Market Share Analysis of Top Players
      • By Regional
      • By Product Type
      • By Component
      • By Sales Channel
      • By Price
      • By Application
  21. Competition Analysis
    • Competition Deep Dive
      • Whistle
        • Overview
        • Product Portfolio
        • Profitability by Market Segments (Product/Age /Sales Channel/Region)
        • Sales Footprint
        • Strategy Overview
          • Marketing Strategy
          • Product Strategy
          • Channel Strategy
      • Fit Bark
        • Overview
        • Product Portfolio
        • Profitability by Market Segments (Product/Age /Sales Channel/Region)
        • Sales Footprint
        • Strategy Overview
          • Marketing Strategy
          • Product Strategy
          • Channel Strategy
      • Findster
        • Overview
        • Product Portfolio
        • Profitability by Market Segments (Product/Age /Sales Channel/Region)
        • Sales Footprint
        • Strategy Overview
          • Marketing Strategy
          • Product Strategy
          • Channel Strategy
      • Link AKC
        • Overview
        • Product Portfolio
        • Profitability by Market Segments (Product/Age /Sales Channel/Region)
        • Sales Footprint
        • Strategy Overview
          • Marketing Strategy
          • Product Strategy
          • Channel Strategy
      • KYON
        • Overview
        • Product Portfolio
        • Profitability by Market Segments (Product/Age /Sales Channel/Region)
        • Sales Footprint
        • Strategy Overview
          • Marketing Strategy
          • Product Strategy
          • Channel Strategy
      • Tractive
        • Overview
        • Product Portfolio
        • Profitability by Market Segments (Product/Age /Sales Channel/Region)
        • Sales Footprint
        • Strategy Overview
          • Marketing Strategy
          • Product Strategy
          • Channel Strategy
      • Pet Pace
        • Overview
        • Product Portfolio
        • Profitability by Market Segments (Product/Age /Sales Channel/Region)
        • Sales Footprint
        • Strategy Overview
          • Marketing Strategy
          • Product Strategy
          • Channel Strategy
      • PETBLE
        • Overview
        • Product Portfolio
        • Profitability by Market Segments (Product/Age /Sales Channel/Region)
        • Sales Footprint
        • Strategy Overview
          • Marketing Strategy
          • Product Strategy
          • Channel Strategy
      • Find My Pet
        • Overview
        • Product Portfolio
        • Profitability by Market Segments (Product/Age /Sales Channel/Region)
        • Sales Footprint
        • Strategy Overview
          • Marketing Strategy
          • Product Strategy
          • Channel Strategy
      • DOTT
        • Overview
        • Product Portfolio
        • Profitability by Market Segments (Product/Age /Sales Channel/Region)
        • Sales Footprint
        • Strategy Overview
          • Marketing Strategy
          • Product Strategy
          • Channel Strategy
  22. Assumptions & Acronyms Used
  23. Research Methodology

List of Tables

  • Table 1: Global Market Value (USD Million) Forecast by Region, 2020-2035
  • Table 2: Global Market Volume (Million Units) Forecast by Region, 2020-2035
  • Table 3: Global Market Value (USD Million) Forecast by Product Type, 2020-2035
  • Table 4: Global Market Volume (Million Units) Forecast by Product Type, 2020-2035
  • Table 5: Global Market Value (USD Million) Forecast by Component, 2020-2035
  • Table 6: Global Market Volume (Million Units) Forecast by Component, 2020-2035
  • Table 7: Global Market Value (USD Million) Forecast by Sales Channel, 2020-2035
  • Table 8: Global Market Volume (Million Units) Forecast by Sales Channel, 2020-2035
  • Table 9: Global Market Value (USD Million) Forecast by Price, 2020-2035
  • Table 10: Global Market Volume (Million Units) Forecast by Price, 2020-2035
  • Table 11: Global Market Value (USD Million) Forecast by Application, 2020-2035
  • Table 12: Global Market Volume (Million Units) Forecast by Application, 2020-2035
  • Table 13: North America Market Value (USD Million) Forecast by Country, 2020-2035
  • Table 14: North America Market Volume (Million Units) Forecast by Country, 2020-2035
  • Table 15: North America Market Value (USD Million) Forecast by Product Type, 2020-2035
  • Table 16: North America Market Volume (Million Units) Forecast by Product Type, 2020-2035
  • Table 17: North America Market Value (USD Million) Forecast by Component, 2020-2035
  • Table 18: North America Market Volume (Million Units) Forecast by Component, 2020-2035
  • Table 19: North America Market Value (USD Million) Forecast by Sales Channel, 2020-2035
  • Table 20: North America Market Volume (Million Units) Forecast by Sales Channel, 2020-2035
  • Table 21: North America Market Value (USD Million) Forecast by Price, 2020-2035
  • Table 22: North America Market Volume (Million Units) Forecast by Price, 2020-2035
  • Table 23: North America Market Value (USD Million) Forecast by Application, 2020-2035
  • Table 24: North America Market Volume (Million Units) Forecast by Application, 2020-2035
  • Table 25: Latin America Market Value (USD Million) Forecast by Country, 2020-2035
  • Table 26: Latin America Market Volume (Million Units) Forecast by Country, 2020-2035
  • Table 27: Latin America Market Value (USD Million) Forecast by Product Type, 2020-2035
  • Table 28: Latin America Market Volume (Million Units) Forecast by Product Type, 2020-2035
  • Table 29: Latin America Market Value (USD Million) Forecast by Component, 2020-2035
  • Table 30: Latin America Market Volume (Million Units) Forecast by Component, 2020-2035
  • Table 31: Latin America Market Value (USD Million) Forecast by Sales Channel, 2020-2035
  • Table 32: Latin America Market Volume (Million Units) Forecast by Sales Channel, 2020-2035
  • Table 33: Latin America Market Value (USD Million) Forecast by Price, 2020-2035
  • Table 34: Latin America Market Volume (Million Units) Forecast by Price, 2020-2035
  • Table 35: Latin America Market Value (USD Million) Forecast by Application, 2020-2035
  • Table 36: Latin America Market Volume (Million Units) Forecast by Application, 2020-2035
  • Table 37: Western Europe Market Value (USD Million) Forecast by Country, 2020-2035
  • Table 38: Western Europe Market Volume (Million Units) Forecast by Country, 2020-2035
  • Table 39: Western Europe Market Value (USD Million) Forecast by Product Type, 2020-2035
  • Table 40: Western Europe Market Volume (Million Units) Forecast by Product Type, 2020-2035
  • Table 41: Western Europe Market Value (USD Million) Forecast by Component, 2020-2035
  • Table 42: Western Europe Market Volume (Million Units) Forecast by Component, 2020-2035
  • Table 43: Western Europe Market Value (USD Million) Forecast by Sales Channel, 2020-2035
  • Table 44: Western Europe Market Volume (Million Units) Forecast by Sales Channel, 2020-2035
  • Table 45: Western Europe Market Value (USD Million) Forecast by Price, 2020-2035
  • Table 46: Western Europe Market Volume (Million Units) Forecast by Price, 2020-2035
  • Table 47: Western Europe Market Value (USD Million) Forecast by Application, 2020-2035
  • Table 48: Western Europe Market Volume (Million Units) Forecast by Application, 2020-2035
  • Table 49: Eastern Europe Market Value (USD Million) Forecast by Country, 2020-2035
  • Table 50: Eastern Europe Market Volume (Million Units) Forecast by Country, 2020-2035
  • Table 51: Eastern Europe Market Value (USD Million) Forecast by Product Type, 2020-2035
  • Table 52: Eastern Europe Market Volume (Million Units) Forecast by Product Type, 2020-2035
  • Table 53: Eastern Europe Market Value (USD Million) Forecast by Component, 2020-2035
  • Table 54: Eastern Europe Market Volume (Million Units) Forecast by Component, 2020-2035
  • Table 55: Eastern Europe Market Value (USD Million) Forecast by Sales Channel, 2020-2035
  • Table 56: Eastern Europe Market Volume (Million Units) Forecast by Sales Channel, 2020-2035
  • Table 57: Eastern Europe Market Value (USD Million) Forecast by Price, 2020-2035
  • Table 58: Eastern Europe Market Volume (Million Units) Forecast by Price, 2020-2035
  • Table 59: Eastern Europe Market Value (USD Million) Forecast by Application, 2020-2035
  • Table 60: Eastern Europe Market Volume (Million Units) Forecast by Application, 2020-2035
  • Table 61: East Asia Market Value (USD Million) Forecast by Country, 2020-2035
  • Table 62: East Asia Market Volume (Million Units) Forecast by Country, 2020-2035
  • Table 63: East Asia Market Value (USD Million) Forecast by Product Type, 2020-2035
  • Table 64: East Asia Market Volume (Million Units) Forecast by Product Type, 2020-2035
  • Table 65: East Asia Market Value (USD Million) Forecast by Component, 2020-2035
  • Table 66: East Asia Market Volume (Million Units) Forecast by Component, 2020-2035
  • Table 67: East Asia Market Value (USD Million) Forecast by Sales Channel, 2020-2035
  • Table 68: East Asia Market Volume (Million Units) Forecast by Sales Channel, 2020-2035
  • Table 69: East Asia Market Value (USD Million) Forecast by Price, 2020-2035
  • Table 70: East Asia Market Volume (Million Units) Forecast by Price, 2020-2035
  • Table 71: East Asia Market Value (USD Million) Forecast by Application, 2020-2035
  • Table 72: East Asia Market Volume (Million Units) Forecast by Application, 2020-2035
  • Table 73: South Asia & Pacific Market Value (USD Million) Forecast by Country, 2020-2035
  • Table 74: South Asia & Pacific Market Volume (Million Units) Forecast by Country, 2020-2035
  • Table 75: South Asia & Pacific Market Value (USD Million) Forecast by Product Type, 2020-2035
  • Table 76: South Asia & Pacific Market Volume (Million Units) Forecast by Product Type, 2020-2035
  • Table 77: South Asia & Pacific Market Value (USD Million) Forecast by Component, 2020-2035
  • Table 78: South Asia & Pacific Market Volume (Million Units) Forecast by Component, 2020-2035
  • Table 79: South Asia & Pacific Market Value (USD Million) Forecast by Sales Channel, 2020-2035
  • Table 80: South Asia & Pacific Market Volume (Million Units) Forecast by Sales Channel, 2020-2035
  • Table 81: South Asia & Pacific Market Value (USD Million) Forecast by Price, 2020-2035
  • Table 82: South Asia & Pacific Market Volume (Million Units) Forecast by Price, 2020-2035
  • Table 83: South Asia & Pacific Market Value (USD Million) Forecast by Application, 2020-2035
  • Table 84: South Asia & Pacific Market Volume (Million Units) Forecast by Application, 2020-2035
  • Table 85: Middle East and Africa Market Value (USD Million) Forecast by Country, 2020-2035
  • Table 86: Middle East and Africa Market Volume (Million Units) Forecast by Country, 2020-2035
  • Table 87: Middle East and Africa Market Value (USD Million) Forecast by Product Type, 2020-2035
  • Table 88: Middle East and Africa Market Volume (Million Units) Forecast by Product Type, 2020-2035
  • Table 89: Middle East and Africa Market Value (USD Million) Forecast by Component, 2020-2035
  • Table 90: Middle East and Africa Market Volume (Million Units) Forecast by Component, 2020-2035
  • Table 91: Middle East and Africa Market Value (USD Million) Forecast by Sales Channel, 2020-2035
  • Table 92: Middle East and Africa Market Volume (Million Units) Forecast by Sales Channel, 2020-2035
  • Table 93: Middle East and Africa Market Value (USD Million) Forecast by Price, 2020-2035
  • Table 94: Middle East and Africa Market Volume (Million Units) Forecast by Price, 2020-2035
  • Table 95: Middle East and Africa Market Value (USD Million) Forecast by Application, 2020-2035
  • Table 96: Middle East and Africa Market Volume (Million Units) Forecast by Application, 2020-2035

List of Figures

  • Figure 1: Global Market Volume (Million Units) Forecast 2020-2035
  • Figure 2: Global Market Pricing Analysis
  • Figure 3: Global Market Value (USD Million) Forecast 2020-2035
  • Figure 4: Global Market Value Share and BPS Analysis by Product Type, 2025 and 2035
  • Figure 5: Global Market Y-o-Y Growth Comparison by Product Type, 2025-2035
  • Figure 6: Global Market Attractiveness Analysis by Product Type
  • Figure 7: Global Market Value Share and BPS Analysis by Component, 2025 and 2035
  • Figure 8: Global Market Y-o-Y Growth Comparison by Component, 2025-2035
  • Figure 9: Global Market Attractiveness Analysis by Component
  • Figure 10: Global Market Value Share and BPS Analysis by Sales Channel, 2025 and 2035
  • Figure 11: Global Market Y-o-Y Growth Comparison by Sales Channel, 2025-2035
  • Figure 12: Global Market Attractiveness Analysis by Sales Channel
  • Figure 13: Global Market Value Share and BPS Analysis by Price, 2025 and 2035
  • Figure 14: Global Market Y-o-Y Growth Comparison by Price, 2025-2035
  • Figure 15: Global Market Attractiveness Analysis by Price
  • Figure 16: Global Market Value Share and BPS Analysis by Application, 2025 and 2035
  • Figure 17: Global Market Y-o-Y Growth Comparison by Application, 2025-2035
  • Figure 18: Global Market Attractiveness Analysis by Application
  • Figure 19: Global Market Value (USD Million) Share and BPS Analysis by Region, 2025 and 2035
  • Figure 20: Global Market Y-o-Y Growth Comparison by Region, 2025-2035
  • Figure 21: Global Market Attractiveness Analysis by Region
  • Figure 22: North America Market Incremental $ Opportunity, 2025-2035
  • Figure 23: Latin America Market Incremental $ Opportunity, 2025-2035
  • Figure 24: Western Europe Market Incremental $ Opportunity, 2025-2035
  • Figure 25: Eastern Europe Market Incremental $ Opportunity, 2025-2035
  • Figure 26: East Asia Market Incremental $ Opportunity, 2025-2035
  • Figure 27: South Asia & Pacific Market Incremental $ Opportunity, 2025-2035
  • Figure 28: Middle East and Africa Market Incremental $ Opportunity, 2025-2035
  • Figure 29: North America Market Value Share and BPS Analysis by Country, 2025 and 2035
  • Figure 30: North America Market Value Share and BPS Analysis by Product Type, 2025 and 2035
  • Figure 31: North America Market Y-o-Y Growth Comparison by Product Type, 2025-2035
  • Figure 32: North America Market Attractiveness Analysis by Product Type
  • Figure 33: North America Market Value Share and BPS Analysis by Component, 2025 and 2035
  • Figure 34: North America Market Y-o-Y Growth Comparison by Component, 2025-2035
  • Figure 35: North America Market Attractiveness Analysis by Component
  • Figure 36: North America Market Value Share and BPS Analysis by Sales Channel, 2025 and 2035
  • Figure 37: North America Market Y-o-Y Growth Comparison by Sales Channel, 2025-2035
  • Figure 38: North America Market Attractiveness Analysis by Sales Channel
  • Figure 39: North America Market Value Share and BPS Analysis by Price, 2025 and 2035
  • Figure 40: North America Market Y-o-Y Growth Comparison by Price, 2025-2035
  • Figure 41: North America Market Attractiveness Analysis by Price
  • Figure 42: North America Market Value Share and BPS Analysis by Application, 2025 and 2035
  • Figure 43: North America Market Y-o-Y Growth Comparison by Application, 2025-2035
  • Figure 44: North America Market Attractiveness Analysis by Application
  • Figure 45: Latin America Market Value Share and BPS Analysis by Country, 2025 and 2035
  • Figure 46: Latin America Market Value Share and BPS Analysis by Product Type, 2025 and 2035
  • Figure 47: Latin America Market Y-o-Y Growth Comparison by Product Type, 2025-2035
  • Figure 48: Latin America Market Attractiveness Analysis by Product Type
  • Figure 49: Latin America Market Value Share and BPS Analysis by Component, 2025 and 2035
  • Figure 50: Latin America Market Y-o-Y Growth Comparison by Component, 2025-2035
  • Figure 51: Latin America Market Attractiveness Analysis by Component
  • Figure 52: Latin America Market Value Share and BPS Analysis by Sales Channel, 2025 and 2035
  • Figure 53: Latin America Market Y-o-Y Growth Comparison by Sales Channel, 2025-2035
  • Figure 54: Latin America Market Attractiveness Analysis by Sales Channel
  • Figure 55: Latin America Market Value Share and BPS Analysis by Price, 2025 and 2035
  • Figure 56: Latin America Market Y-o-Y Growth Comparison by Price, 2025-2035
  • Figure 57: Latin America Market Attractiveness Analysis by Price
  • Figure 58: Latin America Market Value Share and BPS Analysis by Application, 2025 and 2035
  • Figure 59: Latin America Market Y-o-Y Growth Comparison by Application, 2025-2035
  • Figure 60: Latin America Market Attractiveness Analysis by Application
  • Figure 61: Western Europe Market Value Share and BPS Analysis by Country, 2025 and 2035
  • Figure 62: Western Europe Market Value Share and BPS Analysis by Product Type, 2025 and 2035
  • Figure 63: Western Europe Market Y-o-Y Growth Comparison by Product Type, 2025-2035
  • Figure 64: Western Europe Market Attractiveness Analysis by Product Type
  • Figure 65: Western Europe Market Value Share and BPS Analysis by Component, 2025 and 2035
  • Figure 66: Western Europe Market Y-o-Y Growth Comparison by Component, 2025-2035
  • Figure 67: Western Europe Market Attractiveness Analysis by Component
  • Figure 68: Western Europe Market Value Share and BPS Analysis by Sales Channel, 2025 and 2035
  • Figure 69: Western Europe Market Y-o-Y Growth Comparison by Sales Channel, 2025-2035
  • Figure 70: Western Europe Market Attractiveness Analysis by Sales Channel
  • Figure 71: Western Europe Market Value Share and BPS Analysis by Price, 2025 and 2035
  • Figure 72: Western Europe Market Y-o-Y Growth Comparison by Price, 2025-2035
  • Figure 73: Western Europe Market Attractiveness Analysis by Price
  • Figure 74: Western Europe Market Value Share and BPS Analysis by Application, 2025 and 2035
  • Figure 75: Western Europe Market Y-o-Y Growth Comparison by Application, 2025-2035
  • Figure 76: Western Europe Market Attractiveness Analysis by Application
  • Figure 77: Eastern Europe Market Value Share and BPS Analysis by Country, 2025 and 2035
  • Figure 78: Eastern Europe Market Value Share and BPS Analysis by Product Type, 2025 and 2035
  • Figure 79: Eastern Europe Market Y-o-Y Growth Comparison by Product Type, 2025-2035
  • Figure 80: Eastern Europe Market Attractiveness Analysis by Product Type
  • Figure 81: Eastern Europe Market Value Share and BPS Analysis by Component, 2025 and 2035
  • Figure 82: Eastern Europe Market Y-o-Y Growth Comparison by Component, 2025-2035
  • Figure 83: Eastern Europe Market Attractiveness Analysis by Component
  • Figure 84: Eastern Europe Market Value Share and BPS Analysis by Sales Channel, 2025 and 2035
  • Figure 85: Eastern Europe Market Y-o-Y Growth Comparison by Sales Channel, 2025-2035
  • Figure 86: Eastern Europe Market Attractiveness Analysis by Sales Channel
  • Figure 87: Eastern Europe Market Value Share and BPS Analysis by Price, 2025 and 2035
  • Figure 88: Eastern Europe Market Y-o-Y Growth Comparison by Price, 2025-2035
  • Figure 89: Eastern Europe Market Attractiveness Analysis by Price
  • Figure 90: Eastern Europe Market Value Share and BPS Analysis by Application, 2025 and 2035
  • Figure 91: Eastern Europe Market Y-o-Y Growth Comparison by Application, 2025-2035
  • Figure 92: Eastern Europe Market Attractiveness Analysis by Application
  • Figure 93: East Asia Market Value Share and BPS Analysis by Country, 2025 and 2035
  • Figure 94: East Asia Market Value Share and BPS Analysis by Product Type, 2025 and 2035
  • Figure 95: East Asia Market Y-o-Y Growth Comparison by Product Type, 2025-2035
  • Figure 96: East Asia Market Attractiveness Analysis by Product Type
  • Figure 97: East Asia Market Value Share and BPS Analysis by Component, 2025 and 2035
  • Figure 98: East Asia Market Y-o-Y Growth Comparison by Component, 2025-2035
  • Figure 99: East Asia Market Attractiveness Analysis by Component
  • Figure 100: East Asia Market Value Share and BPS Analysis by Sales Channel, 2025 and 2035
  • Figure 101: East Asia Market Y-o-Y Growth Comparison by Sales Channel, 2025-2035
  • Figure 102: East Asia Market Attractiveness Analysis by Sales Channel
  • Figure 103: East Asia Market Value Share and BPS Analysis by Price, 2025 and 2035
  • Figure 104: East Asia Market Y-o-Y Growth Comparison by Price, 2025-2035
  • Figure 105: East Asia Market Attractiveness Analysis by Price
  • Figure 106: East Asia Market Value Share and BPS Analysis by Application, 2025 and 2035
  • Figure 107: East Asia Market Y-o-Y Growth Comparison by Application, 2025-2035
  • Figure 108: East Asia Market Attractiveness Analysis by Application
  • Figure 109: South Asia & Pacific Market Value Share and BPS Analysis by Country, 2025 and 2035
  • Figure 110: South Asia & Pacific Market Value Share and BPS Analysis by Product Type, 2025 and 2035
  • Figure 111: South Asia & Pacific Market Y-o-Y Growth Comparison by Product Type, 2025-2035
  • Figure 112: South Asia & Pacific Market Attractiveness Analysis by Product Type
  • Figure 113: South Asia & Pacific Market Value Share and BPS Analysis by Component, 2025 and 2035
  • Figure 114: South Asia & Pacific Market Y-o-Y Growth Comparison by Component, 2025-2035
  • Figure 115: South Asia & Pacific Market Attractiveness Analysis by Component
  • Figure 116: South Asia & Pacific Market Value Share and BPS Analysis by Sales Channel, 2025 and 2035
  • Figure 117: South Asia & Pacific Market Y-o-Y Growth Comparison by Sales Channel, 2025-2035
  • Figure 118: South Asia & Pacific Market Attractiveness Analysis by Sales Channel
  • Figure 119: South Asia & Pacific Market Value Share and BPS Analysis by Price, 2025 and 2035
  • Figure 120: South Asia & Pacific Market Y-o-Y Growth Comparison by Price, 2025-2035
  • Figure 121: South Asia & Pacific Market Attractiveness Analysis by Price
  • Figure 122: South Asia & Pacific Market Value Share and BPS Analysis by Application, 2025 and 2035
  • Figure 123: South Asia & Pacific Market Y-o-Y Growth Comparison by Application, 2025-2035
  • Figure 124: South Asia & Pacific Market Attractiveness Analysis by Application
  • Figure 125: Middle East and Africa Market Value Share and BPS Analysis by Country, 2025 and 2035
  • Figure 126: Middle East and Africa Market Value Share and BPS Analysis by Product Type, 2025 and 2035
  • Figure 127: Middle East and Africa Market Y-o-Y Growth Comparison by Product Type, 2025-2035
  • Figure 128: Middle East and Africa Market Attractiveness Analysis by Product Type
  • Figure 129: Middle East and Africa Market Value Share and BPS Analysis by Component, 2025 and 2035
  • Figure 130: Middle East and Africa Market Y-o-Y Growth Comparison by Component, 2025-2035
  • Figure 131: Middle East and Africa Market Attractiveness Analysis by Component
  • Figure 132: Middle East and Africa Market Value Share and BPS Analysis by Sales Channel, 2025 and 2035
  • Figure 133: Middle East and Africa Market Y-o-Y Growth Comparison by Sales Channel, 2025-2035
  • Figure 134: Middle East and Africa Market Attractiveness Analysis by Sales Channel
  • Figure 135: Middle East and Africa Market Value Share and BPS Analysis by Price, 2025 and 2035
  • Figure 136: Middle East and Africa Market Y-o-Y Growth Comparison by Price, 2025-2035
  • Figure 137: Middle East and Africa Market Attractiveness Analysis by Price
  • Figure 138: Middle East and Africa Market Value Share and BPS Analysis by Application, 2025 and 2035
  • Figure 139: Middle East and Africa Market Y-o-Y Growth Comparison by Application, 2025-2035
  • Figure 140: Middle East and Africa Market Attractiveness Analysis by Application
  • Figure 141: Global Market - Tier Structure Analysis
  • Figure 142: Global Market - Company Share Analysis

Frequently Asked Questions

What is the projected market size of the smart pet collar industry in 2025?

The industry is expected to reach USD 632.4 million in 2025.

What is the anticipated market value of the smart pet collar market by 2035?

The industry is forecasted to grow to USD 1,820.7 million by 2035.

What is the expected global CAGR for the smart pet collar market from 2025 to 2035?

The industry is projected to grow at a compound annual growth rate (CAGR) of 11.2% during the forecast period.

Which segment is projected to lead the smart pet collar market by application in 2025?

The tracking segment is expected to account for approximately 47% share in 2025.

Which country is forecasted to see the highest growth in the smart pet collar market?

China is expected to register the fastest growth with a CAGR of 8.7% from 2025 to 2035.

Explore Similar Insights

Future Market Insights

Smart Pet Collar Market