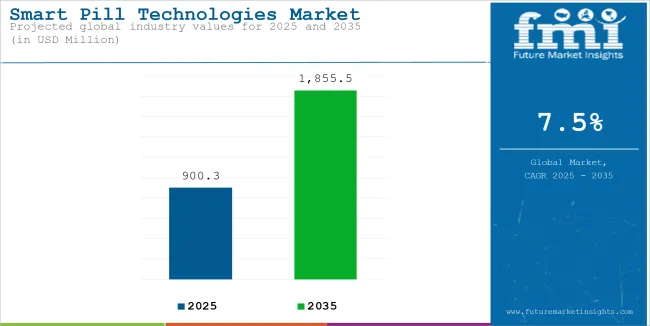
The global Smart Pill Technologies is estimated to be valued at USD 900.3 million in 2025 and is projected to reach USD 1,855.5 million by 2035, registering a compound annual growth rate (CAGR) of 7.5% over the forecast period. The market is experiencing steady growth driven by rising demand for non-invasive gastrointestinal diagnostics, medication adherence monitoring, and precision drug delivery platforms.

| Attributes | Key Insights |
|---|---|
| Estimated Size, 2025 | USD 900.3 million |
| Projected Size, 2035 | USD 1,855.5 million |
| Value-based CAGR (2025 to 2035) | 7.5% |
Increasing global incidence of chronic gastrointestinal disorders, growing adoption of capsule endoscopy, and emerging demand for remote patient monitoring solutions are fueling market expansion. Pharmaceutical companies are actively investing in smart pill systems that integrate ingestible sensors to track drug compliance, improving real-world therapeutic outcomes.
Healthcare providers are embracing smart pill diagnostics to replace invasive procedures, enhancing patient comfort and diagnostic accuracy. With a shifts toward preventive care, smart pill technologies offer a unique convergence of diagnostics, drug delivery, and digital health monitoring, positioning the market for high single-digit growth.
Key manufacturers such as Medtronic, CapsoVision, Olympus Corporation, etectRx, Given Imaging, and IntroMedic are driving innovation in smart pill technologies through miniaturization, wireless communication integration, and multi-parametric monitoring platforms. These companies are leveraging partnerships with digital health firms and pharmaceutical manufacturers to create combined diagnostic-therapeutic platforms.
In 2025, AnX Robotica Announced USA FDA Clearance for MotiliCap™ and MotiliScan™ GI motility monitoring, offering clinicians an advanced, non-invasive tool for assessing whole-gut transit. “We are thrilled to receive FDA clearance for MotiliCap and MotiliScan, reinforcing our commitment to bringing innovative, patient-friendly diagnostic tools to patients and our customers,” said Stu Wildhorn, Vice President of Marketing and Product Management at AnX Robotica.
“MotiliCap not only fills the void left by SmartPill but enhances it with the latest technologies, customer friendly ease of use and analysis capabilities, empowering clinicians with faster, more accurate diagnostic insights.” These launches strengthens digital therapeutics space, particularly in clinical trials, chronic disease medication management and real-time patient monitoring.
North America leads the smart pill technologies market, driven by early regulatory approvals, payer adoption of digital health monitoring, and rapid integration into chronic disease management models. In USA, adoption of smart pills for medication adherence monitoring in high-cost conditions such as hypertension, schizophrenia, and transplant immunosuppression.
Gastroenterology centers are also expanding adoption of capsule endoscopy for Crohn’s disease, obscure GI bleeding, and small bowel evaluation. Strategic partnerships between digital health platforms and pharmaceutical companies are driving integrated smart pill therapeutics development.
Europe is experiencing rapid growth in smart pill technology adoption, supported by government healthcare digitalization programs and strong clinical demand for non-invasive GI diagnostics. Growing demand for non-invasive colorectal cancer screening, especially among aging populations, is also driving smart pill utilization across public health screening programs, positioning Europe for sustained long-term market expansion.
The below table presents the expected CAGR for the global smart pill technologies market over several semi-annual periods spanning from 2025 to 2035. In the first half (H1) of the decade from 2024 to 2035, the business is predicted to surge at a CAGR of 8.2%, followed by a slightly lower growth rate of 7.9% in the second half (H2) of the same decade.
| Particular | Value CAGR |
|---|---|
| H1 (2024 to 2035) | 8.2% |
| H2 (2024 to 2035) | 7.9% |
| H1 (2025 to 2035) | 7.5% |
| H2 (2025 to 2035) | 7.0% |
Moving into the subsequent period, from H1 2025 to H2 2035, the CAGR is projected to decrease slightly to 7.5% in the first half and decrease moderately at 7.0% in the second half. In the first half (H1) the market witnessed a decrease of 70.00 BPS while in the second half (H2), the market witnessed an increase of 90.00 BPS.
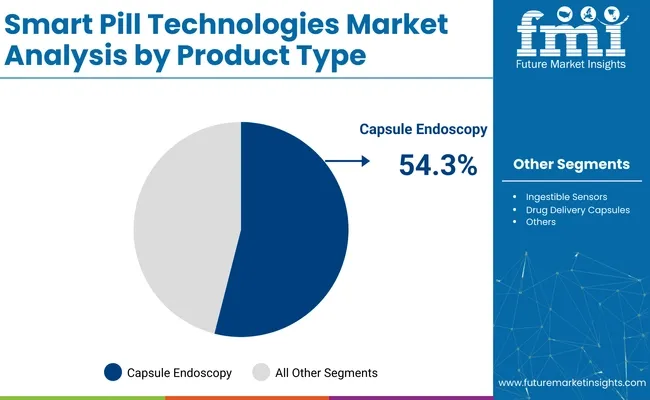
In 2025, capsule endoscopy is expected to capture 54.3% of the revenue share in the smart pill technologies market. This segment leads due to its non-invasive nature, enabling doctors to visualize the gastrointestinal (GI) tract without the need for traditional endoscopic procedures. Capsule endoscopy offers enhanced diagnostic capabilities, particularly for difficult-to-reach areas like the small intestine, where traditional imaging may be limited.

The growth of this segment has been driven by its ability to provide detailed images of the GI tract, which assists in diagnosing conditions such as Crohn's disease, gastrointestinal bleeding, and tumors. Technological advancements in capsule design, such as improvements in camera resolution, battery life, and wireless data transmission, have further improved the reliability and effectiveness of capsule endoscopy.
As healthcare systems increasingly prioritize non-invasive diagnostic methods, capsule endoscopy has gained widespread adoption, reinforcing its dominant position in the market.
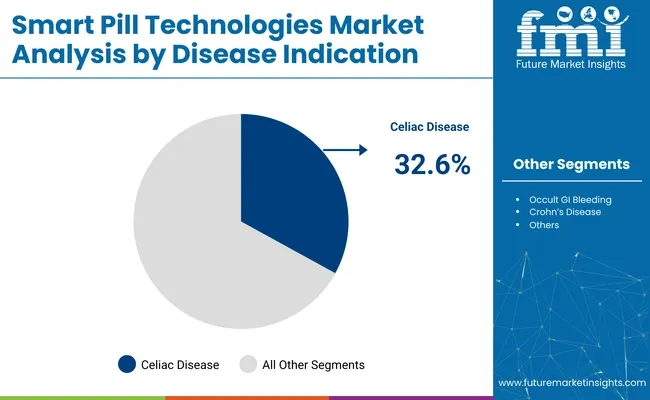
In 2025, celiac disease is expected to hold 32.6% of the revenue share in the smart pill technologies market. This dominance is attributed to the growing recognition of the need for accurate and efficient diagnostic tools for celiac disease, a chronic autoimmune disorder triggered by gluten ingestion. Smart pills, particularly capsule endoscopes, are increasingly being used to assess small bowel health, which is crucial in diagnosing celiac disease.

The rise in awareness and prevalence of celiac disease, especially in developed countries, has led to an increase in testing and early diagnosis, driving the adoption of smart pill technologies. Additionally, advancements in smart pill technology have enabled more accurate, real-time imaging of the small intestine, allowing for earlier detection of celiac-related damage.
As healthcare providers seek more effective ways to diagnose and monitor celiac disease, the use of smart pills in this indication is expected to continue to grow, further solidifying its leading position in the market.
Increasing Prevalence of Gastrointestinal (GI) Disorders is favoring the Growth for Smart Pill Technologies Market
The increasing prevalence of gastrointestinal (GI) disorders is the most relevant drivers for a fast-growing demand in the field of smart pill technologies. Additionally, all the disorders-from Crohn's disease to peptic ulcers, colorectal cancer, or irritable bowel syndrome-are on the increase, especially due to the trends of aging demography and population suffering from sedentary lifestyle.
According to the World Gastroenterology Disease Organization, IBS affects 10-15% of the population in the entire world.
The Crohn's & Colitis Foundation reports that over 3.1 million adults in the United States have been diagnosed with IBD, including Crohn's disease and ulcerative colitis, a 200 percent increase since the 1990s. That is the same trend happening in Europe and Asia-Pacific and believed to be related to dietary and environmental change.
These disorders require accurate, early diagnoses along with appropriate monitoring and treatment and involve areas where conventional diagnostics such as endoscopy has limitations of invasiveness and non-compliance of patients.
Smart pill technologies such as capsule endoscopy are a minimally invasive and patient-friendly alternative that can capture high-resolution images of the GI tract, particularly in regions inaccessible by traditional methods, like the small intestine.
Development of Biocompatible Materials Is Propelling the Market Growth for Smart Pill Technologies.
Advances in biocompatible materials have become one of the key drivers for the smart pill technologies market. Biocompatibility ensures that smart pills can safely interact with the human body without adverse immune responses or toxicity, thereby improving patient safety and comfort.
This innovation has enabled the development of ingestible devices capable of prolonged interaction with gastrointestinal (GI) tissues while minimizing risks such as irritation, allergic reactions, or device rejection.
For instance, the Ingestible Event Marker by Proteus Digital Health is coated with a biocompatible silicon-based capsule coating. The material not only ensures the safety of the pill during ingestion but also allows it to interact harmoniously with gastric fluids to power its microelectronics and transmit data to external sensors.
This advancement has proven essential in expanding the applications of smart pills in medication adherence and therapeutic monitoring, particularly for chronic diseases.
Some capsules use biodegradable materials, which not only obviate the retrieval process post-diagnosis or drug delivery but also further enhance patient convenience. These trends are in sync with the trend of non-invasive, patient-centric diagnostic and therapeutic solutions and have greatly influenced the adoption of smart pill technologies, thus promoting market growth. These developments have underlined the role of material science in building the future of this industry.
The Increasing Awareness about Colorectal Cancer Screening Presents a Significant Opportunity for Smart Pill Technologies
The rising awareness about colorectal cancer (CRC) screening represents a significant market opportunity for smart pill technologies, especially in regions where early detection rates are suboptimal.
Researchers from the International Agency for Research on Cancer (IARC) provide estimates of the incidence of and mortality from colorectal cancer in 185 countries in 2020 and predictions of the future burden in 2040. In 2020, more than 1.9 million new cases of colorectal cancer and more than 930 000 deaths due to colorectal cancer were estimated to have occurred worldwide. The incidence rates were highest in Europe and Australia and New Zealand, and the mortality rates were highest in Eastern Europe.
The authors predict that by 2040 the burden of colorectal cancer will increase to 3.2 million new cases per year (an increase of 63%) and 1.6 million deaths per year (an increase of 73%). More than 80% of the new cases projected to occur in 2040 are predicted to occur in countries with high or very high levels of the Human Development Index.
The market opportunity also extends to the aging population, which `are at higher risk for CRC, and to emerging geographical regions where healthcare access is limited addition to it rising awareness is improving demand for non-invasive diagnostic tools. This makes smart pills a compelling choice for addressing global CRC screening needs and further driving market growth.
Limited Product Adoption Is Emerging as Significant Growth Barrier for Smart Pill Technologies Market
Limited product adoption poses another significant barrier towards smart pill technology in the industry's growth phase. Although having shown promising opportunities through smart pills toward revolutionized diagnostics, still in practice use suffers from issues against adoption for an entire range across healthcare.
A big part of the problem is a lack of awareness both among clinicians and patients. Most clinicians still seem reluctant to embrace smart pill technologies because they do not know or are unfamiliar with the devices.
Decades-old methods of diagnosing, like colonoscopies and endoscopies, have been used extensively by healthcare providers who may favor them because they are tried and trusted. The unfamiliarity with smart pills and their clinical efficacy leads to resistance in incorporating them into regular practice.
The other is the high price of smart pill technologies. These technologies include sensors, cameras, and wireless data transmission systems, all of which cost a lot of money to develop and buy.
Thus, even in low-resource areas, healthcare providers may not have the means to acquire these devices because of costs. Together with the limited policies on reimbursement, the cost alone is enough to deter both providers and patients from considering smart pills as a form of diagnosis.
In conclusion, regulatory hurdles and slow approval processes can delay the market introduction of new smart pill products, further restricting their adoption and growth in the market.
Tier 1 companies comprise market leaders with a significant market share of 52.3% in global market. These companies engage in strategic partnerships and acquisitions to expand their product portfolios and access cutting-edge technologies.
Additionally, they emphasize extensive clinical trials to validate the efficacy and safety of their products. Prominent companies in tier 1 include Medtronic, Boston Scientific, CapsoVision and Proteus Digital Health.
Tier 2 companies include mid-size players having presence in specific regions and highly influencing the local market and holds around 23.7% market share. They typically pursue partnerships with multispecialty hospitals and research organizations to leverage emerging technologies and expedite product development.
These companies often emphasize agility and adaptability, allowing them to quickly bring new products to market, additionally targeting specific types medical needs. Additionally, they focus on cost-effective production methods to offer competitive pricing. Prominent companies in tier 2 include Otsuka Pharmaceutical, Check-Cap, Intromedic, Medisafe and Synapse Biomedical.
Finally, Tier 3 companies, such as Aperiomics, Mikros Systems, Phantom Intelligence and others. They specialize in specific products and cater to niche markets, adding diversity to the industry.
Overall, while Tier 1 companies are the primary drivers of the market, Tier 2 and 3 companies also make significant contributions, ensuring the smart pill technologies sales remains dynamic and competitive.
The section below covers the industry analysis for the smart pill technologies market for different countries. Market demand analysis on key countries in several regions of the globe, including North America, Latin America, East Asia, South Asia & Pacific, Western Europe, Eastern Europe and Middle Ease & Africa, is provided.
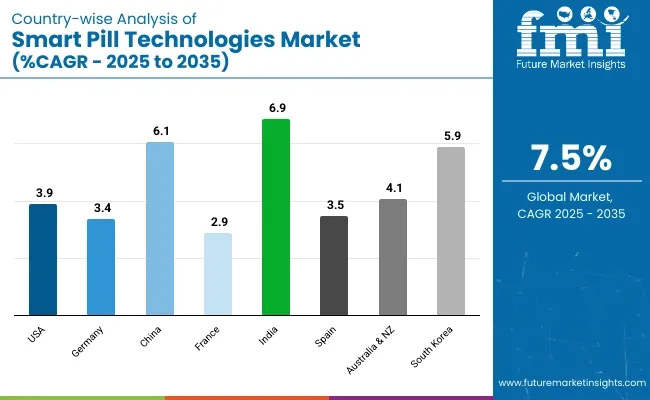
The United States is anticipated to remain at the forefront in North America, with higher market share through 2035. In South Asia & Pacific, India is projected to witness a CAGR of 6.9% by 2035.
| Countries | Value CAGR (2025 to 2035) |
|---|---|
| United States | 3.9% |
| Germany | 3.4% |
| China | 6.1% |
| France | 2.9% |
| India | 6.9% |
| Spain | 3.5% |
| Australia & New Zealand | 4.1% |
| South Korea | 5.9% |

United States smart pill technologies market is poised to exhibit a CAGR of 3.9% between 2025 and 2035. Currently, it holds the highest share in the North American market.
The high consumer base in the United States has been a significant growth driver for the smart pill technologies market. The United States houses a large, diverse population that is increasingly open to adopting advanced medical technologies. Consumers are actively seeking innovative, non-invasive solutions for health management, which makes them more receptive to products like smart pills.
The United States market also has enormous scope in healthcare innovation, where new products reflecting specific needs of consumers can be developed, such as enhanced diagnostics, drug delivery, chronic disease monitoring, etc.
This accelerates product adoption since the companies would invest more in research and development to satisfy the call for customized, efficient health care solutions. Ready American consumer acceptance and usage of technologies greatly drive the growth of smart pill technologies in the United States.
India smart pill technologies market is poised to exhibit a CAGR of 6.9% between 2025 and 2035. Currently, it holds the highest share in the South Asia & Pacific market, and the trend is expected to continue during the forecast period.
The extensive presence of contract manufacturing sector is a significant driver of the growth of the smart pill technologies market in India. India has become a well-established place in the global medical device supply chain, bringing cost-effective solutions for production.
With all its FDA-certified manufacturing plants and adherence to international quality standards, India has emerged as the fascinating destination to outsource the entire production of high-tech sophisticated medical technologies, such as smart pills.
This allows companies to cut costs without compromising on quality, thus making mass production of smart pills possible. India's skilled workforce and efficient manufacturing infrastructure also help in the rapid development and deployment of these technologies.
This, in turn, helps foreign players take advantage of India's manufacturing capabilities, thus further fueling the growth of the market and making smart pill technologies more accessible both in the country and globally.
Germany’s smart pill technologies market is poised to exhibit a CAGR of 3.4% between 2025 and 2035. Currently, it holds the highest share in the Western Europe market, and the trend is expected to continue during the forecast period.
The advanced medical device industry in Germany acts as a dominant force in its smart pill technologies market. A number of companies in Germany are global leaders in the medical technology space, with significant emphasis on innovation, precision, and high-quality manufacturing. Thus, the prestige of German engineering and product development directly influences advancements in medical devices such as smart pills.
The country's emphasis on R&D ensures continuous improvement in the functionality, accuracy, and effectiveness of smart pill technologies. Heavy investments in R&D by German companies enable them to lead in areas such as capsule endoscopy, drug delivery systems, and chronic disease management.
This innovative environment drives the adoption of advanced diagnostic and therapeutic solutions, such as smart pills, in both domestic and international markets. Additionally, Germany’s rigorous regulatory standards further enhance the credibility and global competitiveness of its smart pill technologies.
The market players are using strategies to stay competitive, such as product differentiation through innovative formulations, strategic partnerships with healthcare providers for distribution. Another key strategic focus of these companies is to actively look for strategic partners to bolster their product portfolios and expand their global market presence.
Recent Industry Developments in Smart Pill Technologies Market
In terms of product type, the industry is divided into- capsule endoscopy, ingestible sensors, drug delivery capsules and others.
In terms of disease indication, the industry is segregated into- small bowel tumors, occult GI bleeding, crohn’s disease, celiac disease, inherited polyposis syndromes and others.
In terms of target area, the industry is segregated into- esophagus, stomach, small intestine and large intestine (colon)
In terms of end user, the industry is segregated into- hospitals, diagnostic centers, ambulatory surgical centers and research institutes.
Key countries of North America, Latin America, Western Europe, Eastern Europe, South Asia and Pacific, East Asia and Middle East and Africa (MEA) have been covered in the report.
The global smart pill technologies market is projected to witness CAGR of 7.5% between 2025 and 2035.
The global smart pill technologies industry stood at USD 837.5 million in 2024.
The global smart pill technologies market is anticipated to reach USD 1,855.5 million by 2035 end.
India is set to record the highest CAGR of 6.9% in the assessment period.
The key players operating in the global smart pill technologies market include Medtronic, Boston Scientific, CapsoVision, Proteus Digital Health, Otsuka Pharmaceutical, Check-Cap, Intromedic, Medisafe, Synapse Biomedical, Aperiomics, Mikros Systems, Phantom Intelligence, Viatronix and Capsovision.


Full Research Suite comprises of:
Market outlook & trends analysis
Interviews & case studies
Strategic recommendations
Vendor profiles & capabilities analysis
5-year forecasts
8 regions and 60+ country-level data splits
Market segment data splits
12 months of continuous data updates
DELIVERED AS:
PDF EXCEL ONLINE
Smart Parking Market Size and Share Forecast Outlook 2025 to 2035
Smart Digital Valve Positioner Market Forecast and Outlook 2025 to 2035
Smart Card IC Market Size and Share Forecast Outlook 2025 to 2035
Smart-Tag Inlay Inserters Market Analysis - Size and Share Forecast Outlook 2025 to 2035
Smart Wheelchair Market Forecast and Outlook 2025 to 2035
Smart TV Market Forecast and Outlook 2025 to 2035
Smart/AI Toy Market Size and Share Forecast Outlook 2025 to 2035
Smart Locks Market Size and Share Forecast Outlook 2025 to 2035
Smart Sprinkler Controller Market Size and Share Forecast Outlook 2025 to 2035
Smart Indoor Gardening System Market Size and Share Forecast Outlook 2025 to 2035
Smart Building Delivery Robot Market Size and Share Forecast Outlook 2025 to 2035
Smart Watch Market Size and Share Forecast Outlook 2025 to 2035
Smart Label Market Size and Share Forecast Outlook 2025 to 2035
Smart Mat Market Size and Share Forecast Outlook 2025 to 2035
Smart Water Management Market Size and Share Forecast Outlook 2025 to 2035
Smart Built-In Kitchen Appliance Market Size and Share Forecast Outlook 2025 to 2035
Smart Cold Therapy Machine Market Size and Share Forecast Outlook 2025 to 2035
Smart Personal Assistance Devices Market Size and Share Forecast Outlook 2025 to 2035
Smart Speaker Market Size and Share Forecast Outlook 2025 to 2035
Smart Vehicle Architecture Market Size and Share Forecast Outlook 2025 to 2035

Thank you!
You will receive an email from our Business Development Manager. Please be sure to check your SPAM/JUNK folder too.
Chat With
MaRIA