Natural Skincare Preservatives Market Size and Share Forecast Outlook 2025 to 2035

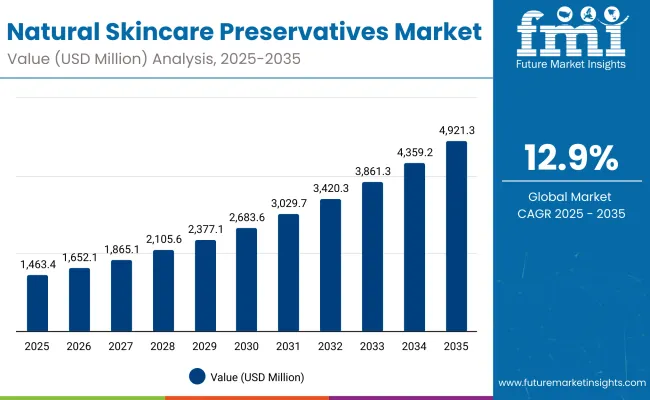
The Natural Skincare Preservatives Market is expected to record a valuation of USD 1,463.4 million in 2025 and USD 4,921.3 million in 2035, with an increase of USD 3,457.9 million, which equals a growth of 193% over the decade. The overall expansion represents a CAGR of 12.9% and a 3.4X increase in market size.
Quick Stats for Natural Skincare Preservatives Market

  • Natural Skincare Preservatives Market Value (2025): USD 1,463.4 million
  • Natural Skincare Preservatives Market Forecast Value (2035): USD 4,921.3 million
  • Natural Skincare Preservatives Market Forecast CAGR: 12.9%
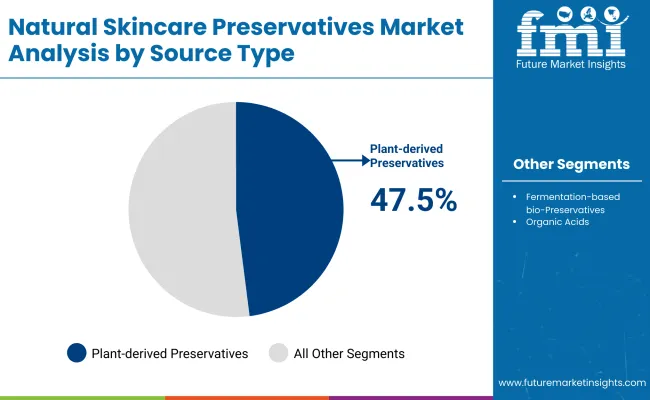
  • Leading Segment in Natural Skincare Preservatives Market in 2025: Plant-derived preservatives (47.5%)
  • Key Growth Regions in the Natural Skincare Preservatives Market: Asia-Pacific (China CAGR 15%, India CAGR 16.9%), North America, Europe
  • Top Key Players in Natural Skincare Preservatives Market: Symrise, BASF, Ashland, Evonik, Clariant, Lonza, Givaudan Active Beauty, Schülke & Mayr, Kemin Industries, Tonymoly

Natural Skincare Preservatives Market

Natural Skincare Preservatives Market Key Takeaways

Metric Value
Market Estimated Value in (2025E) USD 1,463.4 million
Market Forecast Value in (2035F) USD 4,921.3 million
Forecast CAGR (2025 to 2035) 12.9%

During the first five-year period from 2025 to 2030, the market increases from USD 1,463.4 million to USD 2,683.6 million, adding USD 1,220.2 million, which accounts for 35% of the total decade growth. This phase records steady adoption in creams & lotions (46.5% share) and plant-derived preservatives (47.5% share), driven by consumer demand for clean-label, botanical-based skincare.

The second half from 2030 to 2035 contributes USD 2,237.7 million, equal to 65% of total growth, as the market jumps from USD 2,683.6 million to USD 4,921.3 million. This acceleration is powered by widespread deployment of fermentation-based bio-preservatives and expansion in Asia-Pacific (China CAGR 15%, India CAGR 16.9%). Premium applications in serums, oils, and haircare products gain momentum, while ingredient suppliers strengthen B2B sales channels. By 2035, global leaders like Symrise, BASF, and Givaudan Active Beauty consolidate their share through innovation in natural and bio-preservation technologies.

From 2020 to 2024, the Natural Skincare Preservatives Market expanded steadily on the back of clean-label adoption in skincare and cosmetics, moving from a niche demand driver into a mainstream requirement across Europe and North America. During this period, the competitive landscape was fragmented, with global ingredient leaders such as Symrise, BASF, and Givaudan Active Beauty controlling a combined share of less than 15%, while the majority of revenue (over 85%) was distributed among regional and niche botanical extract suppliers. Differentiation relied heavily on ingredient purity, sourcing transparency, and regulatory compliance, while downstream cosmetic brands often treated preservatives as a secondary ingredient in formulations rather than a primary marketing lever. Service-oriented preservation solutions (e.g., customized blends, application support) contributed marginally to revenues.

Demand for Natural Skincare Preservatives will expand to USD 1,463.4 million in 2025, and the revenue mix will shift further as fermentation-based bio-preservatives and organic acids gain traction, accounting for more than half the market share. Traditional leaders face rising competition from bio-technology innovators and plant-based ingredient specialists offering eco-certifications, AI-enabled formulation insights, and clean-label positioning. Major players are pivoting to hybrid portfolios, blending plant-derived and fermentation-based solutions to maintain relevance. Emerging entrants focusing on vegan-certified, allergen-free, and personalized preservation systems are gaining visibility. The competitive advantage is moving away from scale and legacy supply chains toward sustainability credentials, innovation pipelines, and long-term brand partnerships with cosmetic manufacturers.

Why the Natural Skincare Preservatives Market is growing?

The acceleration of natural skincare preservatives is being propelled by stringent regulatory frameworks in North America, Europe, and Asia-Pacific mandating reduced use of synthetic parabens and formaldehyde-releasing agents. Multinational cosmetic companies are re-engineering formulations to comply with EU Cosmetic Regulation (EC) No 1223/2009 and emerging FDA guidance, positioning natural preservatives as a compliance-driven necessity rather than an optional enhancement. This regulatory push is creating a premiumization effect, enabling natural ingredient suppliers to capture margin expansion while aligning with consumer trust and safety expectations.

The market’s growth trajectory is reinforced by rapid innovation in fermentation-derived bio-preservatives, which address efficacy and stability challenges traditionally limiting plant-based extracts. Breakthroughs in microbial fermentation and controlled bioprocessing have yielded scalable, high-purity alternatives like lactobacillus-derived antimicrobials and peptide-based preservation systems. These solutions not only extend shelf-life but also deliver multifunctional benefits such as skin barrier reinforcement and antioxidant protection. The ability to reposition preservatives as active cosmeceutical enhancers creates a differentiated value proposition, encouraging brand adoption in premium skincare and haircare portfolios globally.

Segmental Analysis

The market is segmented by source type, application, product form, distribution channel, and region. Source types include plant-derived preservatives (rosemary, thyme, tea tree), fermentation-based bio-preservatives, and organic acids (benzoic, sorbic, lactic), representing the core natural inputs driving adoption. Applications cover creams & lotions, serums & oils, and haircare products, reflecting the diverse end-use requirements of the cosmetics and personal care industry.

Based on product form, the segmentation includes liquid concentrates, powders, and oil-dispersible forms, tailored to meet formulation flexibility across skincare categories. Distribution channels are divided into ingredient suppliers (B2B) and cosmetic brand manufacturers (B2C), highlighting both upstream and downstream dynamics. Regionally, the scope spans North America, Latin America, Europe, Asia-Pacific, and the Middle East & Africa, with significant growth led by emerging Asian markets such as China and India.
Insights into the Source Type Segment with Plant-Derived Preservatives Leading in Market Share

Natural Skincare Preservatives Market By Source

Source Type Value Share% 2025
Plant-derived preservatives 47.5%
Others 52.5%

The plant-derived preservatives segment is projected to contribute 47.5% of the Natural Skincare Preservatives Market revenue in 2025, maintaining its position as a key driver of market adoption. This leadership is underpinned by the rising consumer preference for botanical ingredients such as rosemary, thyme, and tea tree extracts, which are closely associated with clean-label and sustainable formulations in skincare.

Growth in this segment is further supported by the expansion of natural and organic cosmetic brands that emphasize transparency and allergen-free product lines. Plant-based preservatives are increasingly integrated into creams, lotions, and serums, where their natural antimicrobial and antioxidant properties enhance both efficacy and consumer appeal. As regulatory bodies tighten restrictions on synthetic preservatives, demand for botanical alternatives continues to rise. The plant-derived segment is expected to retain its strategic importance as the foundation of natural skincare preservation solutions globally.
Insights into the Application Segment with Creams & Lotions Dominating the Demand

Natural Skincare Preservatives Market By Application

Application Value Share% 2025
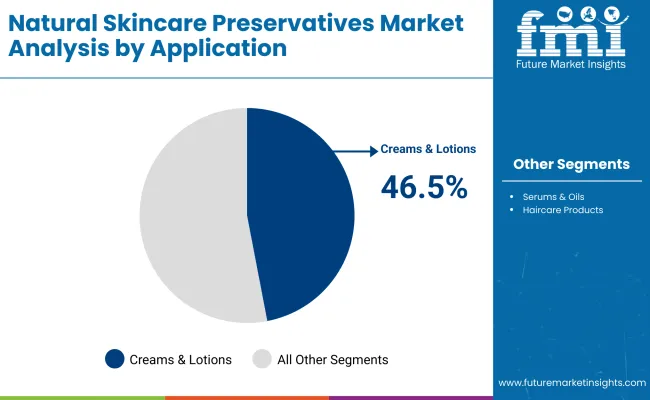
Creams & lotions 46.5%
Others 53.5%

The creams & lotions segment is forecasted to hold 46.5% of the market share in 2025, reflecting its central role in driving demand for natural skincare preservatives. This dominance is attributed to the widespread use of moisturizing and anti-aging formulations that require effective preservation to maintain product stability and extend shelf life.

Natural preservatives such as plant-derived antioxidants and fermentation-based bio-preservatives are increasingly incorporated into creams and lotions, as they align with consumer expectations for clean-label, hypoallergenic, and sustainable personal care products. The segment’s growth is also supported by premium product launches targeting hydration, anti-wrinkle, and sensitive-skin categories.

As global demand for daily-use skincare routines continues to expand, especially across Asia-Pacific and Europe, creams & lotions are expected to remain the most significant application area, ensuring consistent adoption of natural preservation solutions across both mass-market and premium skincare portfolios.
Insights into the Product Form Segment with Liquid Concentrates Leading in Market Share

Natural Skincare Preservatives Market By Product

Product Form Value Share% 2025
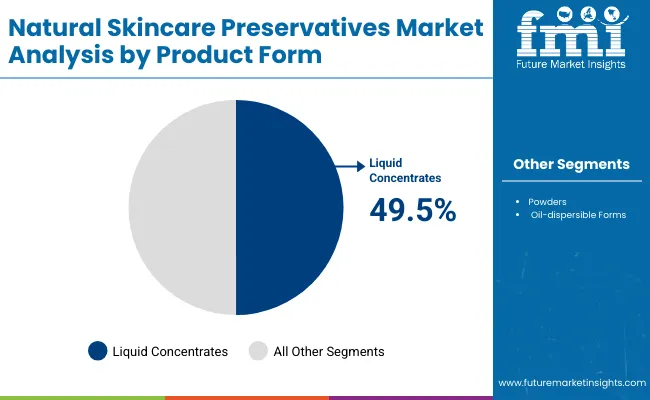
Liquid concentrates 49.5%
Others 50.5%

The liquid concentrates segment is projected to account for 49.5% of the Natural Skincare Preservatives Market revenue in 2025, positioning it as the dominant product form. This preference stems from the ease of integration into skincare formulations, offering uniform dispersion and consistent preservative efficacy across a wide range of cosmetic products.

Liquid formats are particularly favored in creams, lotions, and serums, where stability and solubility are critical to maintaining texture and performance. Growing demand for multifunctional formulations that combine preservation with additional skin benefits, such as hydration or antioxidant support, further reinforces the segment’s importance. As cosmetic manufacturers increasingly seek scalable, easy-to-use, and formulation-friendly solutions, liquid concentrates are expected to retain their lead, while powders and oil-dispersible forms serve niche requirements. This balance ensures that the liquid form remains the backbone of natural skincare preservation strategies throughout the forecast period.

What are the Drivers, Restraints, and Key Trends of the Natural Skincare Preservatives Market?

Regulatory Pressure Favoring Natural Ingredients

Regulatory tightening across major markets is compelling cosmetic manufacturers to replace synthetic parabens, phenoxyethanol, and formaldehyde donors with natural preservation systems. The European Union’s Cosmetic Regulation (EC) No 1223/2009 and increasing FDA scrutiny on synthetic agents have created compliance-led demand for plant-derived and fermentation-based preservatives. In parallel, certification bodies such as COSMOS and ECOCERT are mandating clean-label formulations, accelerating the switch. This structural shift elevates natural preservatives from a niche add-on to a baseline requirement, enabling suppliers with sustainable sourcing and traceability to secure premium pricing while gaining preferred supplier status in regulated global markets. with data cleanup, mesh generation, and format compatibility can be steep.

Consumer Demand for Clean-Label Skincare

Evolving consumer expectations around sustainability, transparency, and skin health are accelerating adoption of natural skincare preservatives. Shoppers increasingly seek products free from “chemically harsh” additives, particularly parabens, sulfates, and synthetic stabilizers. Millennials and Gen Z consumers, who dominate premium skincare purchasing, associate natural preservation systems with purity and safety. Social media influencers and wellness-driven retail positioning further amplify this trend. The result is a profound reformulation wave, with global brands embedding botanical and bio-preservatives into mainstream product lines. This clean-label movement is not only expanding market size but also reshaping competitive dynamics toward suppliers offering natural, clinically validated solutions.

Higher Cost and Formulation Complexity

Despite robust growth, adoption of natural skincare preservatives faces constraints linked to cost and technical challenges. Compared to low-cost synthetic preservatives, natural alternatives often involve higher raw material sourcing costs, complex extraction methods, and shorter shelf-life stability. These factors raise overall formulation expenses, limiting accessibility in mass-market skincare segments where pricing sensitivity is high. Additionally, compatibility issues such as maintaining efficacy in water-rich formulations or preserving across broad pH ranges create hurdles for cosmetic formulators. Smaller brands without significant R&D budgets may struggle to scale natural preservation systems, restraining full market penetration despite strong regulatory and consumer-driven momentum.

Biotechnology-Enabled Fermentation Preservatives

An emerging trend reshaping the market is the rise of biotechnology-based fermentation preservatives. Advances in microbial processing are enabling production of peptide-based antimicrobials, lactobacillus-derived extracts, and bioengineered organic acids that combine efficacy with sustainability. Unlike traditional plant extracts, these bio-preservatives offer reproducible quality, longer shelf stability, and multifunctional benefits such as antioxidant or skin-barrier support. They are increasingly marketed as both preservation agents and active cosmetic ingredients, blurring category boundaries. Global ingredient leaders are investing in fermentation technology partnerships, signaling a structural shift where biotechnology will redefine scalability, performance, and positioning of natural skincare preservation systems over the next decade.
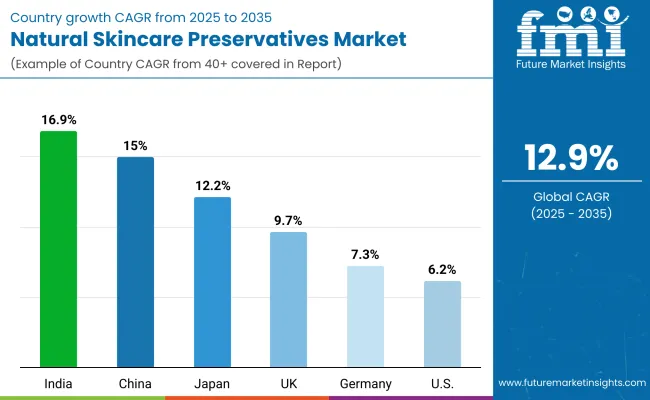
Analysis of Natural Skincare Preservatives Market By Key Countries

Natural Skincare Preservatives Market By Country

Countries Estimated CAGR (2025 to 2035)
China 15.0%
USA 6.2%
India 16.9%
UK 9.7%
Germany 7.3%
Japan 12.2%

The global Natural Skincare Preservatives Market shows clear regional variations in growth, strongly shaped by consumer preferences for clean-label beauty, regulatory frameworks, and industry innovation ecosystems.

Asia-Pacific emerges as the fastest-growing region, anchored by India at 16.9% CAGR and China at 15.0% CAGR. India’s trajectory reflects the surge of Ayurveda-inspired formulations and strong adoption of herbal preservatives in premium skincare. China’s growth is driven by K-beauty influences, rising disposable incomes, and supportive government policies promoting natural and sustainable cosmetics. Japan at 12.2% CAGR benefits from its deep-rooted demand for anti-aging and functional skincare solutions, accelerating the adoption of natural bio-preservatives.

Europe maintains a strong position, led by the UK (9.7%) and Germany (7.3%), driven by strict EU regulations restricting parabens and synthetic preservatives. Compliance with COSMOS and ECOCERT standards strengthens natural preservative demand, especially in organic-certified product lines. North America, led by the USA at 6.2% CAGR, reflects a more mature but steady market, where consumer-driven clean-label preferences sustain demand. Growth here is shaped less by regulatory compulsion and more by marketing-led positioning of botanical and fermentation-based preservatives across premium skincare brands.
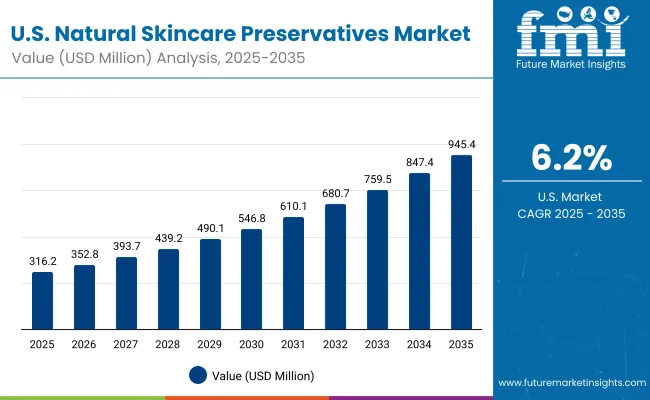
Sales Outlook for Natural Skincare Preservatives in the United States

Natural Skincare Preservatives Market Usa

Year USA Natural Skincare Preservatives Market (USD Million)
2025 316.29
2026 352.89
2027 393.73
2028 439.29
2029 490.13
2030 546.85
2031 610.13
2032 680.74
2033 759.52
2034 847.41
2035 945.48

The Natural Skincare Preservatives Market in the United States is projected to grow at a CAGR of 6.2%, supported by consistent consumer demand for clean-label formulations and compliance with FDA safety standards. Growth is concentrated in plant-derived preservatives (43.2% share in 2025, USD 136.64 Million), reflecting consumer trust in botanical-based skincare. The segment’s expansion is also driven by rising adoption of fermentation-based bio-preservatives in premium skincare and haircare lines.

Increasing pressure on brands to eliminate parabens, formaldehyde donors, and synthetic stabilizers is pushing formulators toward sustainable alternatives. Moisturizing creams and lotions remain the leading application segment in the USA, reflecting their widespread use in daily skincare routines. Serums and oils are gaining traction in premium and anti-aging categories, where natural preservatives serve both stability and marketing functions.

Ingredient suppliers (B2B) dominate distribution, but major cosmetic brands are increasingly investing in in-house preservative R&D to strengthen product claims and differentiation.

Growth and Expansion Outlook for Natural Skincare Preservatives Market in the United Kingdom

The Natural Skincare Preservatives Market in the United Kingdom is expected to grow at a CAGR of 9.7%, supported by strong regulatory alignment with EU cosmetic safety frameworks and rising consumer demand for clean-label, organic-certified products. Growth is particularly concentrated in plant-derived preservatives, reflecting consumer trust in natural botanical extracts. Premium skincare, serums, and oils are fueling adoption, as UK consumers increasingly favor sustainable and cruelty-free formulations. Government-backed sustainability initiatives and certifications such as Soil Association Organic continue to reinforce market demand. Additionally, collaborations between ingredient suppliers and UK-based indie cosmetic brands are accelerating product innovation.

  • Premium creams and lotions dominate demand, supported by rising focus on natural moisturizers and anti-aging skincare.
  • Herbal serums and oils are gaining traction, leveraging plant-based antioxidants as dual-function actives and preservatives.
  • Independent cosmetic brands are leading adoption, often positioning natural preservation systems as part of their marketing edge.

Growth and Expansion Outlook for Natural Skincare Preservatives Market in India

India is witnessing rapid growth in the Natural Skincare Preservatives Market, forecast to expand at a CAGR of 16.9% through 2035 the highest among major emerging markets. This momentum is driven by rising adoption of Ayurveda-inspired skincare formulations, supported by government promotion of herbal and natural beauty products. Tier-2 and tier-3 cities are fueling demand as consumer awareness of clean-label skincare spreads beyond metro hubs. Local manufacturers and MSMEs are integrating plant-derived and bio-fermentation preservatives to align with export quality standards. Educational and research institutions are also emphasizing natural ingredients, fostering innovation in sustainable preservative technologies.

  • Ayurveda-based skincare brands are scaling faster, integrating natural preservatives into herbal formulations.
  • Tier-2 city consumers are driving affordable product launches in mass-market skincare.
  • MSME exporters are increasingly adopting bio-preservatives to meet EU and USA compliance standards.

Sales Outlook for Natural Skincare Preservatives in China

The Natural Skincare Preservatives Market in China is expected to grow at a CAGR of 15.0%, making it one of the fastest-growing global markets. Growth is fueled by the rise of K-beauty and C-beauty trends, which emphasize multifunctional, naturally preserved skincare products. Municipal initiatives promoting sustainability and consumer preference for eco-friendly formulations further reinforce demand. Domestic ingredient suppliers are scaling rapidly, offering cost-competitive natural and organic acids, accelerating adoption across both premium and mass-market brands. E-commerce platforms are playing a pivotal role, boosting consumer access to natural skincare ranges and driving penetration into smaller cities.
  • C-beauty brands are adopting natural preservatives to differentiate in competitive online markets.
  • Domestic suppliers are offering competitively priced botanical and fermentation-based preservatives.
  • Government and consumer push for sustainability is embedding natural preservatives as a mainstream choice.

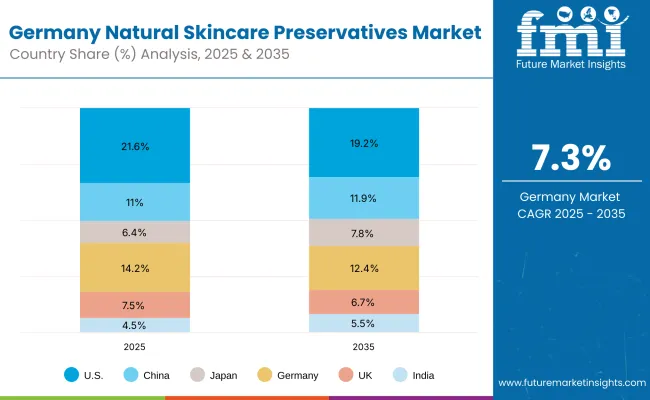
In-depth Analysis of Natural Skincare Preservatives in Germany

Natural Skincare Preservatives Market Germany

Countries 2025 Share (%)
USA 21.6%
China 11.0%
Japan 6.4%
Germany 14.2%
UK 7.5%
India 4.5%
Countries 2035 Share (%)
USA 19.2%
China 11.9%
Japan 7.8%
Germany 12.4%
UK 6.7%
India 5.5%

The Natural Skincare Preservatives Market in Germany is projected to grow at a CAGR of 7.3%, supported by the country’s leadership in sustainability-driven cosmetics and stringent EU safety compliance. German consumers are early adopters of organic-certified and eco-labeled skincare, pushing brands to shift from synthetic preservatives to natural alternatives. Manufacturers are integrating plant-derived and fermentation-based preservatives into creams, lotions, and serums to meet COSMOS and ECOCERT certification standards. Growth is also reinforced by the rise of dermocosmetics and pharmacy-distributed skincare, where clinical-grade natural formulations are in high demand. While market share is expected to soften slightly by 2035, Germany remains a core hub for regulatory-compliant, high-quality preservative innovation.
  • COSMOS and ECOCERT certifications drive adoption of natural preservatives across German skincare portfolios.
  • Dermocosmetics and pharmacy-based skincare are expanding as consumers seek clinically validated, naturally preserved products.
  • Sustainability leadership keeps Germany central in Europe’s shift toward eco-friendly preservation systems.

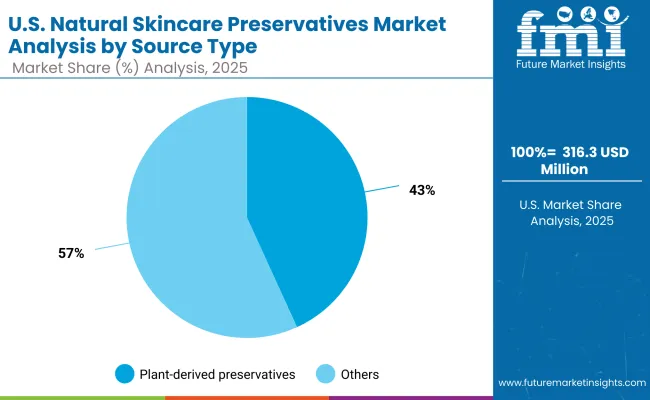
Growth Outlook for Natural Skincare Preservatives Market in USA

Natural Skincare Preservatives Market Usa 2

USA By Source Type Value Share% 2025
Plant-derived preservatives 43.2%
Others 56.8%

The Natural Skincare Preservatives Market in the United States is projected at USD 316.3 million in 2025, expanding steadily to reach USD 945.5 million by 2035. Plant-derived preservatives hold 43.2% share, underpinned by consumer trust in botanical formulations and rising demand for clean-label, hypoallergenic skincare. However, fermentation-based preservatives and organic acids (56.8%) are gradually outpacing plant-derived counterparts due to their superior stability and broader formulation compatibility.

The USA market reflects a transition toward scientifically validated natural ingredients, supported by FDA guidance and consumer-driven clean beauty movements. Leading cosmetic brands are investing in hybrid preservative portfolios, combining plant and bio-fermentation sources to enhance safety, shelf life, and sustainability. Digital retail channels are amplifying consumer access to naturally preserved products, with strong momentum in premium skincare and dermocosmetics.
  • Market in the USA holds 21.6% share in 2025 of the global total.
  • Fermentation and organic acid-based preservatives (56.8%) lead over plant-derived (43.2%).
  • Growth is supported by FDA compliance, clean-label positioning, and premium skincare expansion.

Opportunity Analysis of China Natural Skincare Preservatives Market

Natural Skincare Preservatives Market China

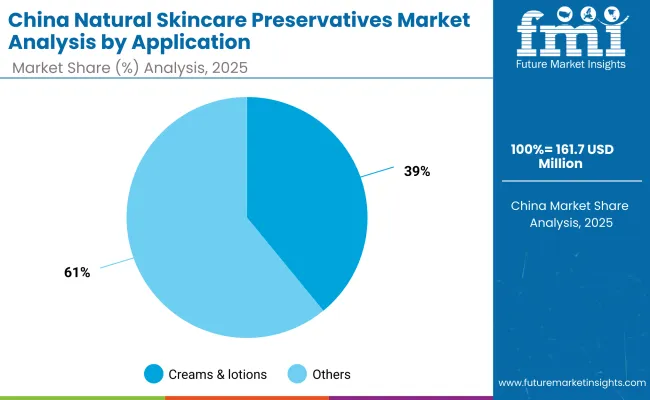
China By Application Value Share% 2025
Creams & lotions 39.1%
Others 60.9%

The Natural Skincare Preservatives Market in China is forecast to expand rapidly, growing at a CAGR of 15.0%, making it one of the fastest globally. Market adoption is led by serums, oils, and haircare products (60.9%), which are central to the booming C-beauty and K-beauty influenced segments. Creams and lotions account for 39.1% but remain essential for mass-market adoption. Domestic suppliers are gaining ground by offering cost-competitive fermentation-based preservatives and organic acids, enabling mass penetration in both premium and budget categories. E-commerce ecosystems like Tmall and JD.com are accelerating consumer access, while government-led sustainability campaigns are reinforcing the shift to naturally preserved products.
  • Market size for China in 2025 is USD 161.7 million.
  • China holds 11.0% of the global share in 2025, increasing to 11.9% by 2035.
  • Serums, oils, and haircare lead at 60.9% due to strong C-beauty and premiumization trends.

Competitive Landscape of Natural Skincare Preservatives Market

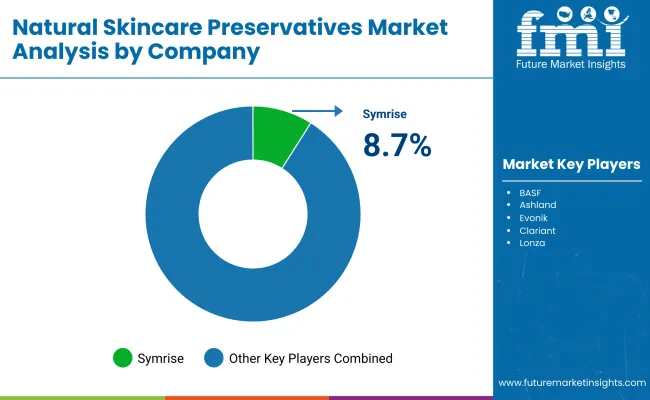
Natural Skincare Preservatives Market By Company

The Natural Skincare Preservatives Market is moderately fragmented, with a mix of global ingredient leaders, mid-sized innovators, and niche botanical specialists competing across applications. Global leaders such as Symrise, BASF, Givaudan Active Beauty, and Lonza hold meaningful share, leveraging their scale, R&D strength, and broad ingredient portfolios. Their strategies increasingly emphasize biotechnology-enabled fermentation preservatives, multifunctional botanical extracts, and clean-label certifications (COSMOS, ECOCERT) to strengthen adoption in premium skincare.

Mid-sized players like Ashland, Evonik, and Clariant are expanding through targeted innovation in organic acids and hybrid preservative blends, offering flexible solutions to cosmetic formulators seeking stability and compliance. Their ability to align with sustainability mandates and deliver formulation support enhances competitive relevance. Specialist providers such as Active Micro Technologies, Schülke & Mayr, and Kemin Industries focus on niche, application-specific preservation systems, particularly antimicrobial peptides and natural antioxidant complexes. Their strength lies in customization and regional adaptability, catering to organic beauty brands and indie formulators that prioritize transparency and natural positioning.

Competitive differentiation is shifting away from price and basic preservation efficacy toward integrated sustainability credentials, multifunctional preservative systems, and brand partnerships. Players able to combine natural efficacy with supply chain transparency will consolidate share in a fragmented global landscape.

Key Developments in Natural Skincare Preservatives Market

  • In 2024, leading suppliers such as Symrise and BASF expanded portfolios of fermentation-derived bio-preservatives, introducing peptide and lactobacillus-based systems. These innovations address formulation stability challenges while offering multifunctional skin benefits, positioning bio-preservation as a premium alternative to conventional botanical extracts in global cosmetic formulations.
  • By 2025, niche preservative specialists like Active Micro Technologies and Schülke & Mayr intensified partnerships with indie and organic beauty brands. These collaborations enabled customized preservative blends aligned with vegan, allergen-free, and ECOCERT-certified requirements, accelerating adoption across clean-label skincare portfolios in North America and Europe.

Scope of the Report

Item Value
Quantitative Units USD 1,463.4 Million
Source Type Plant-derived preservatives (rosemary, thyme, tea tree), Fermentation-based bio-preservatives, Organic acids (benzoic, sorbic, lactic)
Application Creams & lotions, Serums & oils, Haircare products
Product Form Liquid concentrates, Powders, Oil-dispersible forms
Distribution Channel Ingredient suppliers (B2B), Cosmetic brand manufacturers (B2C)
Regions Covered North America, Europe, Asia-Pacific, Latin America, Middle East & Africa
Country Covered United States, Canada, Germany, France, United Kingdom, China, Japan, India, Brazil, South Africa
Key Companies Profiled Symrise, BASF, Ashland, Evonik, Clariant, Lonza, Givaudan Active Beauty, Schülke & Mayr, Kemin Industries, Tonymoly
Additional Attributes Dollar sales by source type and application category, adoption trends in clean-label and organic-certified skincare, rising demand for multifunctional preservatives with antioxidant and antimicrobial benefits, sector-specific growth in premium skincare, haircare, and dermocosmetics, revenue segmentation by product form (liquid concentrates, powders, oil-dispersible), integration with biotechnology and fermentation-based innovations, regional trends influenced by regulatory compliance and sustainability mandates, and advancements in plant-derived extraction methods, organic acids, and bio-fermentation technologies.

Key Segments

By Source Type:

  • Plant-derived preservatives (rosemary, thyme, tea tree)
  • Fermentation-based bio-preservatives
  • Organic acids (benzoic, sorbic, lactic)

By Application:

  • Creams & lotions
  • Serums & oils
  • Haircare products

By Product Form:

  • Liquid concentrates
  • Powders
  • Oil-dispersible forms

By Distribution Channel:

  • Ingredient suppliers (B2B)
  • Cosmetic brand manufacturers (B2C)

By Region:

  • North America
  • Latin America
  • Europe
  • East Asia
  • South Asia & Pacific
  • Middle East and Africa

Table of Content

  1. Executive Summary
    • Global Market Outlook
    • Demand-side Trends
    • Supply-side Trends
    • Technology Roadmap Analysis
    • Analysis and Recommendations
  2. Market Overview
    • Market Coverage / Taxonomy
    • Market Definition / Scope / Limitations
  3. Market Background
    • Market Dynamics
      • Drivers
      • Restraints
      • Opportunity
      • Trends
    • Scenario Forecast
      • Demand in Optimistic Scenario
      • Demand in Likely Scenario
      • Demand in Conservative Scenario
    • Opportunity Map Analysis
    • Product Life Cycle Analysis
    • Supply Chain Analysis
      • Supply Side Participants and their Roles
        • Producers
        • Mid-Level Participants (Traders/ Agents/ Brokers)
        • Wholesalers and Distributors
      • Value Added and Value Created at Node in the Supply Chain
      • List of Raw Material Suppliers
      • List of Existing and Potential Buyer’s
    • Investment Feasibility Matrix
    • Value Chain Analysis
      • Profit Margin Analysis
      • Wholesalers and Distributors
      • Retailers
    • PESTLE and Porter’s Analysis
    • Regulatory Landscape
      • By Key Regions
      • By Key Countries
    • Regional Parent Market Outlook
    • Production and Consumption Statistics
    • Import and Export Statistics
  4. Global Market Analysis 2020 to 2024 and Forecast, 2025 to 2035
    • Historical Market Size Value (USD Million) & Volume (Units) Analysis, 2020 to 2024
    • Current and Future Market Size Value (USD Million) & Volume (Units) Projections, 2025 to 2035
      • Y-o-Y Growth Trend Analysis
      • Absolute $ Opportunity Analysis
  5. Global Market Analysis 2020 to 2024 and Forecast 2025 to 2035, By Source Type
    • Introduction / Key Findings
    • Historical Market Size Value (USD Million) & Volume (Units) Analysis By Source Type, 2020 to 2024
    • Current and Future Market Size Value (USD Million) & Volume (Units) Analysis and Forecast By Source Type, 2025 to 2035
      • Plant-derived preservatives (rosemary, thyme, tea tree)
      • Fermentation-based bio-preservatives
      • Organic acids (benzoic, sorbic, lactic)
    • Y-o-Y Growth Trend Analysis By Source Type, 2020 to 2024
    • Absolute $ Opportunity Analysis By Source Type, 2025 to 2035
  6. Global Market Analysis 2020 to 2024 and Forecast 2025 to 2035, By Application
    • Introduction / Key Findings
    • Historical Market Size Value (USD Million) & Volume (Units) Analysis By Application, 2020 to 2024
    • Current and Future Market Size Value (USD Million) & Volume (Units) Analysis and Forecast By Application, 2025 to 2035
      • Creams & lotions
      • Serums & oils
      • Haircare products
    • Y-o-Y Growth Trend Analysis By Application, 2020 to 2024
    • Absolute $ Opportunity Analysis By Application, 2025 to 2035
  7. Global Market Analysis 2020 to 2024 and Forecast 2025 to 2035, By Product Form
    • Introduction / Key Findings
    • Historical Market Size Value (USD Million) & Volume (Units) Analysis By Product Form, 2020 to 2024
    • Current and Future Market Size Value (USD Million) & Volume (Units) Analysis and Forecast By Product Form, 2025 to 2035
      • Liquid concentrates
      • Powders
      • Oil-dispersible forms
    • Y-o-Y Growth Trend Analysis By Product Form, 2020 to 2024
    • Absolute $ Opportunity Analysis By Product Form, 2025 to 2035
  8. Global Market Analysis 2020 to 2024 and Forecast 2025 to 2035, By Distribution Channel
    • Introduction / Key Findings
    • Historical Market Size Value (USD Million) & Volume (Units) Analysis By Distribution Channel, 2020 to 2024
    • Current and Future Market Size Value (USD Million) & Volume (Units) Analysis and Forecast By Distribution Channel, 2025 to 2035
      • Ingredient suppliers (B2B)
      • Cosmetic brand manufacturers (B2C)
    • Y-o-Y Growth Trend Analysis By Distribution Channel, 2020 to 2024
    • Absolute $ Opportunity Analysis By Distribution Channel, 2025 to 2035
  9. Global Market Analysis 2020 to 2024 and Forecast 2025 to 2035, By Region
    • Introduction
    • Historical Market Size Value (USD Million) & Volume (Units) Analysis By Region, 2020 to 2024
    • Current Market Size Value (USD Million) & Volume (Units) Analysis and Forecast By Region, 2025 to 2035
      • North America
      • Latin America
      • Europe
      • East Asia
      • South Asia & Pacific
      • Middle East and Africa
    • Market Attractiveness Analysis By Region
  10. North America Market Analysis 2020 to 2024 and Forecast 2025 to 2035, By Country
    • Historical Market Size Value (USD Million) & Volume (Units) Trend Analysis By Market Taxonomy, 2020 to 2024
    • Market Size Value (USD Million) & Volume (Units) Forecast By Market Taxonomy, 2025 to 2035
      • By Country
        • USA
        • Canada
      • By Source Type
      • By Application
      • By Product Form
      • By Distribution Channel
    • Market Attractiveness Analysis
      • By Country
      • By Source Type
      • By Application
      • By Product Form
      • By Distribution Channel
    • Key Takeaways
  11. Latin America Market Analysis 2020 to 2024 and Forecast 2025 to 2035, By Country
    • Historical Market Size Value (USD Million) & Volume (Units) Trend Analysis By Market Taxonomy, 2020 to 2024
    • Market Size Value (USD Million) & Volume (Units) Forecast By Market Taxonomy, 2025 to 2035
      • By Country
        • Brazil
        • Mexico
        • Colombia
        • Rest of Latin America
      • By Source Type
      • By Application
      • By Product Form
      • By Distribution Channel
    • Market Attractiveness Analysis
      • By Country
      • By Source Type
      • By Application
      • By Product Form
      • By Distribution Channel
    • Key Takeaways
  12. Europe Market Analysis 2020 to 2024 and Forecast 2025 to 2035, By Country
    • Historical Market Size Value (USD Million) & Volume (Units) Trend Analysis By Market Taxonomy, 2020 to 2024
    • Market Size Value (USD Million) & Volume (Units) Forecast By Market Taxonomy, 2025 to 2035
      • By Country
        • Germany
        • UK
        • France
        • Italy
        • Spain
        • Belgium
        • Netherlands
        • Nordic
        • Switzerland
        • Russia
        • Poland
        • Rest of Europe
      • By Source Type
      • By Application
      • By Product Form
      • By Distribution Channel
    • Market Attractiveness Analysis
      • By Country
      • By Source Type
      • By Application
      • By Product Form
      • By Distribution Channel
    • Key Takeaways
  13. East Asia Market Analysis 2020 to 2024 and Forecast 2025 to 2035, By Country
    • Historical Market Size Value (USD Million) & Volume (Units) Trend Analysis By Market Taxonomy, 2020 to 2024
    • Market Size Value (USD Million) & Volume (Units) Forecast By Market Taxonomy, 2025 to 2035
      • By Country
        • China
        • Japan
        • South Korea
      • By Source Type
      • By Application
      • By Product Form
      • By Distribution Channel
    • Market Attractiveness Analysis
      • By Country
      • By Source Type
      • By Application
      • By Product Form
      • By Distribution Channel
    • Key Takeaways
  14. South Asia & Pacific Market Analysis 2020 to 2024 and Forecast 2025 to 2035, By Country
    • Historical Market Size Value (USD Million) & Volume (Units) Trend Analysis By Market Taxonomy, 2020 to 2024
    • Market Size Value (USD Million) & Volume (Units) Forecast By Market Taxonomy, 2025 to 2035
      • By Country
        • India
        • Thailand
        • Malaysia
        • Indonesia
        • Singapore
        • Vietnam
        • Australia
        • New Zealand
        • Rest of South Asia
      • By Source Type
      • By Application
      • By Product Form
      • By Distribution Channel
    • Market Attractiveness Analysis
      • By Country
      • By Source Type
      • By Application
      • By Product Form
      • By Distribution Channel
    • Key Takeaways
  15. Middle East and Africa Market Analysis 2020 to 2024 and Forecast 2025 to 2035, By Country
    • Historical Market Size Value (USD Million) & Volume (Units) Trend Analysis By Market Taxonomy, 2020 to 2024
    • Market Size Value (USD Million) & Volume (Units) Forecast By Market Taxonomy, 2025 to 2035
      • By Country
        • Turkey
        • UAE
        • Saudi Arabia
        • Israel
        • Other GCC Countries
        • North Africa
        • South Africa
      • By Source Type
      • By Application
      • By Product Form
      • By Distribution Channel
    • Market Attractiveness Analysis
      • By Country
      • By Source Type
      • By Application
      • By Product Form
      • By Distribution Channel
    • Key Takeaways
  16. Key Countries Market Analysis
    • USA
      • Pricing Analysis
      • Market Share Analysis, 2024
        • By Source Type
        • By Application
        • By Product Form
        • By Distribution Channel
    • Canada
      • Pricing Analysis
      • Market Share Analysis, 2024
        • By Source Type
        • By Application
        • By Product Form
        • By Distribution Channel
    • Brazil
      • Pricing Analysis
      • Market Share Analysis, 2024
        • By Source Type
        • By Application
        • By Product Form
        • By Distribution Channel
    • Mexico
      • Pricing Analysis
      • Market Share Analysis, 2024
        • By Source Type
        • By Application
        • By Product Form
        • By Distribution Channel
    • Colombia
      • Pricing Analysis
      • Market Share Analysis, 2024
        • By Source Type
        • By Application
        • By Product Form
        • By Distribution Channel
    • Germany
      • Pricing Analysis
      • Market Share Analysis, 2024
        • By Source Type
        • By Application
        • By Product Form
        • By Distribution Channel
    • UK
      • Pricing Analysis
      • Market Share Analysis, 2024
        • By Source Type
        • By Application
        • By Product Form
        • By Distribution Channel
    • France
      • Pricing Analysis
      • Market Share Analysis, 2024
        • By Source Type
        • By Application
        • By Product Form
        • By Distribution Channel
    • Italy
      • Pricing Analysis
      • Market Share Analysis, 2024
        • By Source Type
        • By Application
        • By Product Form
        • By Distribution Channel
    • Spain
      • Pricing Analysis
      • Market Share Analysis, 2024
        • By Source Type
        • By Application
        • By Product Form
        • By Distribution Channel
    • Belgium
      • Pricing Analysis
      • Market Share Analysis, 2024
        • By Source Type
        • By Application
        • By Product Form
        • By Distribution Channel
    • Netherlands
      • Pricing Analysis
      • Market Share Analysis, 2024
        • By Source Type
        • By Application
        • By Product Form
        • By Distribution Channel
    • Nordic
      • Pricing Analysis
      • Market Share Analysis, 2024
        • By Source Type
        • By Application
        • By Product Form
        • By Distribution Channel
    • Switzerland
      • Pricing Analysis
      • Market Share Analysis, 2024
        • By Source Type
        • By Application
        • By Product Form
        • By Distribution Channel
    • Russia
      • Pricing Analysis
      • Market Share Analysis, 2024
        • By Source Type
        • By Application
        • By Product Form
        • By Distribution Channel
    • Poland
      • Pricing Analysis
      • Market Share Analysis, 2024
        • By Source Type
        • By Application
        • By Product Form
        • By Distribution Channel
    • China
      • Pricing Analysis
      • Market Share Analysis, 2024
        • By Source Type
        • By Application
        • By Product Form
        • By Distribution Channel
    • Japan
      • Pricing Analysis
      • Market Share Analysis, 2024
        • By Source Type
        • By Application
        • By Product Form
        • By Distribution Channel
    • South Korea
      • Pricing Analysis
      • Market Share Analysis, 2024
        • By Source Type
        • By Application
        • By Product Form
        • By Distribution Channel
    • India
      • Pricing Analysis
      • Market Share Analysis, 2024
        • By Source Type
        • By Application
        • By Product Form
        • By Distribution Channel
    • Thailand
      • Pricing Analysis
      • Market Share Analysis, 2024
        • By Source Type
        • By Application
        • By Product Form
        • By Distribution Channel
    • Indonesia
      • Pricing Analysis
      • Market Share Analysis, 2024
        • By Source Type
        • By Application
        • By Product Form
        • By Distribution Channel
    • Australia
      • Pricing Analysis
      • Market Share Analysis, 2024
        • By Source Type
        • By Application
        • By Product Form
        • By Distribution Channel
    • New Zealand
      • Pricing Analysis
      • Market Share Analysis, 2024
        • By Source Type
        • By Application
        • By Product Form
        • By Distribution Channel
    • Turkey
      • Pricing Analysis
      • Market Share Analysis, 2024
        • By Source Type
        • By Application
        • By Product Form
        • By Distribution Channel
    • UAE
      • Pricing Analysis
      • Market Share Analysis, 2024
        • By Source Type
        • By Application
        • By Product Form
        • By Distribution Channel
    • Saudi Arabia
      • Pricing Analysis
      • Market Share Analysis, 2024
        • By Source Type
        • By Application
        • By Product Form
        • By Distribution Channel
    • Israel
      • Pricing Analysis
      • Market Share Analysis, 2024
        • By Source Type
        • By Application
        • By Product Form
        • By Distribution Channel
    • North Africa
      • Pricing Analysis
      • Market Share Analysis, 2024
        • By Source Type
        • By Application
        • By Product Form
        • By Distribution Channel
    • South Africa
      • Pricing Analysis
      • Market Share Analysis, 2024
        • By Source Type
        • By Application
        • By Product Form
        • By Distribution Channel
  17. Market Structure Analysis
    • Competition Dashboard
    • Competition Benchmarking
    • Market Share Analysis of Top Players
      • By Regional
      • By Source Type
      • By Application
      • By Product Form
      • By Distribution Channel
  18. Competition Analysis
    • Competition Deep Dive
      • Ashland
        • Overview
        • Product Portfolio
        • Profitability by Market Segments (Product/Age /Sales Channel/Region)
        • Sales Footprint
        • Strategy Overview
          • Marketing Strategy
          • Product Strategy
          • Channel Strategy
      • BASF
        • Overview
        • Product Portfolio
        • Profitability by Market Segments (Product/Age /Sales Channel/Region)
        • Sales Footprint
        • Strategy Overview
          • Marketing Strategy
          • Product Strategy
          • Channel Strategy
      • Evonik
        • Overview
        • Product Portfolio
        • Profitability by Market Segments (Product/Age /Sales Channel/Region)
        • Sales Footprint
        • Strategy Overview
          • Marketing Strategy
          • Product Strategy
          • Channel Strategy
      • Clariant
        • Overview
        • Product Portfolio
        • Profitability by Market Segments (Product/Age /Sales Channel/Region)
        • Sales Footprint
        • Strategy Overview
          • Marketing Strategy
          • Product Strategy
          • Channel Strategy
      • Symrise
        • Overview
        • Product Portfolio
        • Profitability by Market Segments (Product/Age /Sales Channel/Region)
        • Sales Footprint
        • Strategy Overview
          • Marketing Strategy
          • Product Strategy
          • Channel Strategy
      • Active Micro Technologies
        • Overview
        • Product Portfolio
        • Profitability by Market Segments (Product/Age /Sales Channel/Region)
        • Sales Footprint
        • Strategy Overview
          • Marketing Strategy
          • Product Strategy
          • Channel Strategy
      • Kemin Industries
        • Overview
        • Product Portfolio
        • Profitability by Market Segments (Product/Age /Sales Channel/Region)
        • Sales Footprint
        • Strategy Overview
          • Marketing Strategy
          • Product Strategy
          • Channel Strategy
      • Lonza
        • Overview
        • Product Portfolio
        • Profitability by Market Segments (Product/Age /Sales Channel/Region)
        • Sales Footprint
        • Strategy Overview
          • Marketing Strategy
          • Product Strategy
          • Channel Strategy
      • Givaudan Active Beauty
        • Overview
        • Product Portfolio
        • Profitability by Market Segments (Product/Age /Sales Channel/Region)
        • Sales Footprint
        • Strategy Overview
          • Marketing Strategy
          • Product Strategy
          • Channel Strategy
      • Schülke & Mayr
        • Overview
        • Product Portfolio
        • Profitability by Market Segments (Product/Age /Sales Channel/Region)
        • Sales Footprint
        • Strategy Overview
          • Marketing Strategy
          • Product Strategy
          • Channel Strategy
      • Others
        • Overview
        • Product Portfolio
        • Profitability by Market Segments (Product/Age /Sales Channel/Region)
        • Sales Footprint
        • Strategy Overview
          • Marketing Strategy
          • Product Strategy
          • Channel Strategy
  19. Assumptions & Acronyms Used
  20. Research Methodology

List of Tables

  • Table 1: Global Market Value (USD Million) Forecast by Region, 2020-2035
  • Table 2: Global Market Volume (Units) Forecast by Region, 2020-2035
  • Table 3: Global Market Value (USD Million) Forecast by Source Type, 2020-2035
  • Table 4: Global Market Volume (Units) Forecast by Source Type, 2020-2035
  • Table 5: Global Market Value (USD Million) Forecast by Application, 2020-2035
  • Table 6: Global Market Volume (Units) Forecast by Application, 2020-2035
  • Table 7: Global Market Value (USD Million) Forecast by Product Form, 2020-2035
  • Table 8: Global Market Volume (Units) Forecast by Product Form, 2020-2035
  • Table 9: Global Market Value (USD Million) Forecast by Distribution Channel, 2020-2035
  • Table 10: Global Market Volume (Units) Forecast by Distribution Channel, 2020-2035
  • Table 11: North America Market Value (USD Million) Forecast by Country, 2020-2035
  • Table 12: North America Market Volume (Units) Forecast by Country, 2020-2035
  • Table 13: North America Market Value (USD Million) Forecast by Source Type, 2020-2035
  • Table 14: North America Market Volume (Units) Forecast by Source Type, 2020-2035
  • Table 15: North America Market Value (USD Million) Forecast by Application, 2020-2035
  • Table 16: North America Market Volume (Units) Forecast by Application, 2020-2035
  • Table 17: North America Market Value (USD Million) Forecast by Product Form, 2020-2035
  • Table 18: North America Market Volume (Units) Forecast by Product Form, 2020-2035
  • Table 19: North America Market Value (USD Million) Forecast by Distribution Channel, 2020-2035
  • Table 20: North America Market Volume (Units) Forecast by Distribution Channel, 2020-2035
  • Table 21: Latin America Market Value (USD Million) Forecast by Country, 2020-2035
  • Table 22: Latin America Market Volume (Units) Forecast by Country, 2020-2035
  • Table 23: Latin America Market Value (USD Million) Forecast by Source Type, 2020-2035
  • Table 24: Latin America Market Volume (Units) Forecast by Source Type, 2020-2035
  • Table 25: Latin America Market Value (USD Million) Forecast by Application, 2020-2035
  • Table 26: Latin America Market Volume (Units) Forecast by Application, 2020-2035
  • Table 27: Latin America Market Value (USD Million) Forecast by Product Form, 2020-2035
  • Table 28: Latin America Market Volume (Units) Forecast by Product Form, 2020-2035
  • Table 29: Latin America Market Value (USD Million) Forecast by Distribution Channel, 2020-2035
  • Table 30: Latin America Market Volume (Units) Forecast by Distribution Channel, 2020-2035
  • Table 31: Europe Market Value (USD Million) Forecast by Country, 2020-2035
  • Table 32: Europe Market Volume (Units) Forecast by Country, 2020-2035
  • Table 33: Europe Market Value (USD Million) Forecast by Source Type, 2020-2035
  • Table 34: Europe Market Volume (Units) Forecast by Source Type, 2020-2035
  • Table 35: Europe Market Value (USD Million) Forecast by Application, 2020-2035
  • Table 36: Europe Market Volume (Units) Forecast by Application, 2020-2035
  • Table 37: Europe Market Value (USD Million) Forecast by Product Form, 2020-2035
  • Table 38: Europe Market Volume (Units) Forecast by Product Form, 2020-2035
  • Table 39: Europe Market Value (USD Million) Forecast by Distribution Channel, 2020-2035
  • Table 40: Europe Market Volume (Units) Forecast by Distribution Channel, 2020-2035
  • Table 41: East Asia Market Value (USD Million) Forecast by Country, 2020-2035
  • Table 42: East Asia Market Volume (Units) Forecast by Country, 2020-2035
  • Table 43: East Asia Market Value (USD Million) Forecast by Source Type, 2020-2035
  • Table 44: East Asia Market Volume (Units) Forecast by Source Type, 2020-2035
  • Table 45: East Asia Market Value (USD Million) Forecast by Application, 2020-2035
  • Table 46: East Asia Market Volume (Units) Forecast by Application, 2020-2035
  • Table 47: East Asia Market Value (USD Million) Forecast by Product Form, 2020-2035
  • Table 48: East Asia Market Volume (Units) Forecast by Product Form, 2020-2035
  • Table 49: East Asia Market Value (USD Million) Forecast by Distribution Channel, 2020-2035
  • Table 50: East Asia Market Volume (Units) Forecast by Distribution Channel, 2020-2035
  • Table 51: South Asia & Pacific Market Value (USD Million) Forecast by Country, 2020-2035
  • Table 52: South Asia & Pacific Market Volume (Units) Forecast by Country, 2020-2035
  • Table 53: South Asia & Pacific Market Value (USD Million) Forecast by Source Type, 2020-2035
  • Table 54: South Asia & Pacific Market Volume (Units) Forecast by Source Type, 2020-2035
  • Table 55: South Asia & Pacific Market Value (USD Million) Forecast by Application, 2020-2035
  • Table 56: South Asia & Pacific Market Volume (Units) Forecast by Application, 2020-2035
  • Table 57: South Asia & Pacific Market Value (USD Million) Forecast by Product Form, 2020-2035
  • Table 58: South Asia & Pacific Market Volume (Units) Forecast by Product Form, 2020-2035
  • Table 59: South Asia & Pacific Market Value (USD Million) Forecast by Distribution Channel, 2020-2035
  • Table 60: South Asia & Pacific Market Volume (Units) Forecast by Distribution Channel, 2020-2035
  • Table 61: Middle East and Africa Market Value (USD Million) Forecast by Country, 2020-2035
  • Table 62: Middle East and Africa Market Volume (Units) Forecast by Country, 2020-2035
  • Table 63: Middle East and Africa Market Value (USD Million) Forecast by Source Type, 2020-2035
  • Table 64: Middle East and Africa Market Volume (Units) Forecast by Source Type, 2020-2035
  • Table 65: Middle East and Africa Market Value (USD Million) Forecast by Application, 2020-2035
  • Table 66: Middle East and Africa Market Volume (Units) Forecast by Application, 2020-2035
  • Table 67: Middle East and Africa Market Value (USD Million) Forecast by Product Form, 2020-2035
  • Table 68: Middle East and Africa Market Volume (Units) Forecast by Product Form, 2020-2035
  • Table 69: Middle East and Africa Market Value (USD Million) Forecast by Distribution Channel, 2020-2035
  • Table 70: Middle East and Africa Market Volume (Units) Forecast by Distribution Channel, 2020-2035

List of Figures

  • Figure 1: Global Market Value (USD Million) by Source Type, 2025-2035
  • Figure 2: Global Market Value (USD Million) by Application, 2025-2035
  • Figure 3: Global Market Value (USD Million) by Product Form, 2025-2035
  • Figure 4: Global Market Value (USD Million) by Distribution Channel, 2025-2035
  • Figure 5: Global Market Value (USD Million) by Region, 2025-2035
  • Figure 6: Global Market Value (USD Million) Analysis by Region, 2020-2035
  • Figure 7: Global Market Volume (Units) Analysis by Region, 2020-2035
  • Figure 8: Global Market Value Share (%) and BPS Analysis by Region, 2025-2035
  • Figure 9: Global Market Y-o-Y Growth (%) Projections by Region, 2025-2035
  • Figure 10: Global Market Value (USD Million) Analysis by Source Type, 2020-2035
  • Figure 11: Global Market Volume (Units) Analysis by Source Type, 2020-2035
  • Figure 12: Global Market Value Share (%) and BPS Analysis by Source Type, 2025-2035
  • Figure 13: Global Market Y-o-Y Growth (%) Projections by Source Type, 2025-2035
  • Figure 14: Global Market Value (USD Million) Analysis by Application, 2020-2035
  • Figure 15: Global Market Volume (Units) Analysis by Application, 2020-2035
  • Figure 16: Global Market Value Share (%) and BPS Analysis by Application, 2025-2035
  • Figure 17: Global Market Y-o-Y Growth (%) Projections by Application, 2025-2035
  • Figure 18: Global Market Value (USD Million) Analysis by Product Form, 2020-2035
  • Figure 19: Global Market Volume (Units) Analysis by Product Form, 2020-2035
  • Figure 20: Global Market Value Share (%) and BPS Analysis by Product Form, 2025-2035
  • Figure 21: Global Market Y-o-Y Growth (%) Projections by Product Form, 2025-2035
  • Figure 22: Global Market Value (USD Million) Analysis by Distribution Channel, 2020-2035
  • Figure 23: Global Market Volume (Units) Analysis by Distribution Channel, 2020-2035
  • Figure 24: Global Market Value Share (%) and BPS Analysis by Distribution Channel, 2025-2035
  • Figure 25: Global Market Y-o-Y Growth (%) Projections by Distribution Channel, 2025-2035
  • Figure 26: Global Market Attractiveness by Source Type, 2025-2035
  • Figure 27: Global Market Attractiveness by Application, 2025-2035
  • Figure 28: Global Market Attractiveness by Product Form, 2025-2035
  • Figure 29: Global Market Attractiveness by Distribution Channel, 2025-2035
  • Figure 30: Global Market Attractiveness by Region, 2025-2035
  • Figure 31: North America Market Value (USD Million) by Source Type, 2025-2035
  • Figure 32: North America Market Value (USD Million) by Application, 2025-2035
  • Figure 33: North America Market Value (USD Million) by Product Form, 2025-2035
  • Figure 34: North America Market Value (USD Million) by Distribution Channel, 2025-2035
  • Figure 35: North America Market Value (USD Million) by Country, 2025-2035
  • Figure 36: North America Market Value (USD Million) Analysis by Country, 2020-2035
  • Figure 37: North America Market Volume (Units) Analysis by Country, 2020-2035
  • Figure 38: North America Market Value Share (%) and BPS Analysis by Country, 2025-2035
  • Figure 39: North America Market Y-o-Y Growth (%) Projections by Country, 2025-2035
  • Figure 40: North America Market Value (USD Million) Analysis by Source Type, 2020-2035
  • Figure 41: North America Market Volume (Units) Analysis by Source Type, 2020-2035
  • Figure 42: North America Market Value Share (%) and BPS Analysis by Source Type, 2025-2035
  • Figure 43: North America Market Y-o-Y Growth (%) Projections by Source Type, 2025-2035
  • Figure 44: North America Market Value (USD Million) Analysis by Application, 2020-2035
  • Figure 45: North America Market Volume (Units) Analysis by Application, 2020-2035
  • Figure 46: North America Market Value Share (%) and BPS Analysis by Application, 2025-2035
  • Figure 47: North America Market Y-o-Y Growth (%) Projections by Application, 2025-2035
  • Figure 48: North America Market Value (USD Million) Analysis by Product Form, 2020-2035
  • Figure 49: North America Market Volume (Units) Analysis by Product Form, 2020-2035
  • Figure 50: North America Market Value Share (%) and BPS Analysis by Product Form, 2025-2035
  • Figure 51: North America Market Y-o-Y Growth (%) Projections by Product Form, 2025-2035
  • Figure 52: North America Market Value (USD Million) Analysis by Distribution Channel, 2020-2035
  • Figure 53: North America Market Volume (Units) Analysis by Distribution Channel, 2020-2035
  • Figure 54: North America Market Value Share (%) and BPS Analysis by Distribution Channel, 2025-2035
  • Figure 55: North America Market Y-o-Y Growth (%) Projections by Distribution Channel, 2025-2035
  • Figure 56: North America Market Attractiveness by Source Type, 2025-2035
  • Figure 57: North America Market Attractiveness by Application, 2025-2035
  • Figure 58: North America Market Attractiveness by Product Form, 2025-2035
  • Figure 59: North America Market Attractiveness by Distribution Channel, 2025-2035
  • Figure 60: North America Market Attractiveness by Country, 2025-2035
  • Figure 61: Latin America Market Value (USD Million) by Source Type, 2025-2035
  • Figure 62: Latin America Market Value (USD Million) by Application, 2025-2035
  • Figure 63: Latin America Market Value (USD Million) by Product Form, 2025-2035
  • Figure 64: Latin America Market Value (USD Million) by Distribution Channel, 2025-2035
  • Figure 65: Latin America Market Value (USD Million) by Country, 2025-2035
  • Figure 66: Latin America Market Value (USD Million) Analysis by Country, 2020-2035
  • Figure 67: Latin America Market Volume (Units) Analysis by Country, 2020-2035
  • Figure 68: Latin America Market Value Share (%) and BPS Analysis by Country, 2025-2035
  • Figure 69: Latin America Market Y-o-Y Growth (%) Projections by Country, 2025-2035
  • Figure 70: Latin America Market Value (USD Million) Analysis by Source Type, 2020-2035
  • Figure 71: Latin America Market Volume (Units) Analysis by Source Type, 2020-2035
  • Figure 72: Latin America Market Value Share (%) and BPS Analysis by Source Type, 2025-2035
  • Figure 73: Latin America Market Y-o-Y Growth (%) Projections by Source Type, 2025-2035
  • Figure 74: Latin America Market Value (USD Million) Analysis by Application, 2020-2035
  • Figure 75: Latin America Market Volume (Units) Analysis by Application, 2020-2035
  • Figure 76: Latin America Market Value Share (%) and BPS Analysis by Application, 2025-2035
  • Figure 77: Latin America Market Y-o-Y Growth (%) Projections by Application, 2025-2035
  • Figure 78: Latin America Market Value (USD Million) Analysis by Product Form, 2020-2035
  • Figure 79: Latin America Market Volume (Units) Analysis by Product Form, 2020-2035
  • Figure 80: Latin America Market Value Share (%) and BPS Analysis by Product Form, 2025-2035
  • Figure 81: Latin America Market Y-o-Y Growth (%) Projections by Product Form, 2025-2035
  • Figure 82: Latin America Market Value (USD Million) Analysis by Distribution Channel, 2020-2035
  • Figure 83: Latin America Market Volume (Units) Analysis by Distribution Channel, 2020-2035
  • Figure 84: Latin America Market Value Share (%) and BPS Analysis by Distribution Channel, 2025-2035
  • Figure 85: Latin America Market Y-o-Y Growth (%) Projections by Distribution Channel, 2025-2035
  • Figure 86: Latin America Market Attractiveness by Source Type, 2025-2035
  • Figure 87: Latin America Market Attractiveness by Application, 2025-2035
  • Figure 88: Latin America Market Attractiveness by Product Form, 2025-2035
  • Figure 89: Latin America Market Attractiveness by Distribution Channel, 2025-2035
  • Figure 90: Latin America Market Attractiveness by Country, 2025-2035
  • Figure 91: Europe Market Value (USD Million) by Source Type, 2025-2035
  • Figure 92: Europe Market Value (USD Million) by Application, 2025-2035
  • Figure 93: Europe Market Value (USD Million) by Product Form, 2025-2035
  • Figure 94: Europe Market Value (USD Million) by Distribution Channel, 2025-2035
  • Figure 95: Europe Market Value (USD Million) by Country, 2025-2035
  • Figure 96: Europe Market Value (USD Million) Analysis by Country, 2020-2035
  • Figure 97: Europe Market Volume (Units) Analysis by Country, 2020-2035
  • Figure 98: Europe Market Value Share (%) and BPS Analysis by Country, 2025-2035
  • Figure 99: Europe Market Y-o-Y Growth (%) Projections by Country, 2025-2035
  • Figure 100: Europe Market Value (USD Million) Analysis by Source Type, 2020-2035
  • Figure 101: Europe Market Volume (Units) Analysis by Source Type, 2020-2035
  • Figure 102: Europe Market Value Share (%) and BPS Analysis by Source Type, 2025-2035
  • Figure 103: Europe Market Y-o-Y Growth (%) Projections by Source Type, 2025-2035
  • Figure 104: Europe Market Value (USD Million) Analysis by Application, 2020-2035
  • Figure 105: Europe Market Volume (Units) Analysis by Application, 2020-2035
  • Figure 106: Europe Market Value Share (%) and BPS Analysis by Application, 2025-2035
  • Figure 107: Europe Market Y-o-Y Growth (%) Projections by Application, 2025-2035
  • Figure 108: Europe Market Value (USD Million) Analysis by Product Form, 2020-2035
  • Figure 109: Europe Market Volume (Units) Analysis by Product Form, 2020-2035
  • Figure 110: Europe Market Value Share (%) and BPS Analysis by Product Form, 2025-2035
  • Figure 111: Europe Market Y-o-Y Growth (%) Projections by Product Form, 2025-2035
  • Figure 112: Europe Market Value (USD Million) Analysis by Distribution Channel, 2020-2035
  • Figure 113: Europe Market Volume (Units) Analysis by Distribution Channel, 2020-2035
  • Figure 114: Europe Market Value Share (%) and BPS Analysis by Distribution Channel, 2025-2035
  • Figure 115: Europe Market Y-o-Y Growth (%) Projections by Distribution Channel, 2025-2035
  • Figure 116: Europe Market Attractiveness by Source Type, 2025-2035
  • Figure 117: Europe Market Attractiveness by Application, 2025-2035
  • Figure 118: Europe Market Attractiveness by Product Form, 2025-2035
  • Figure 119: Europe Market Attractiveness by Distribution Channel, 2025-2035
  • Figure 120: Europe Market Attractiveness by Country, 2025-2035
  • Figure 121: East Asia Market Value (USD Million) by Source Type, 2025-2035
  • Figure 122: East Asia Market Value (USD Million) by Application, 2025-2035
  • Figure 123: East Asia Market Value (USD Million) by Product Form, 2025-2035
  • Figure 124: East Asia Market Value (USD Million) by Distribution Channel, 2025-2035
  • Figure 125: East Asia Market Value (USD Million) by Country, 2025-2035
  • Figure 126: East Asia Market Value (USD Million) Analysis by Country, 2020-2035
  • Figure 127: East Asia Market Volume (Units) Analysis by Country, 2020-2035
  • Figure 128: East Asia Market Value Share (%) and BPS Analysis by Country, 2025-2035
  • Figure 129: East Asia Market Y-o-Y Growth (%) Projections by Country, 2025-2035
  • Figure 130: East Asia Market Value (USD Million) Analysis by Source Type, 2020-2035
  • Figure 131: East Asia Market Volume (Units) Analysis by Source Type, 2020-2035
  • Figure 132: East Asia Market Value Share (%) and BPS Analysis by Source Type, 2025-2035
  • Figure 133: East Asia Market Y-o-Y Growth (%) Projections by Source Type, 2025-2035
  • Figure 134: East Asia Market Value (USD Million) Analysis by Application, 2020-2035
  • Figure 135: East Asia Market Volume (Units) Analysis by Application, 2020-2035
  • Figure 136: East Asia Market Value Share (%) and BPS Analysis by Application, 2025-2035
  • Figure 137: East Asia Market Y-o-Y Growth (%) Projections by Application, 2025-2035
  • Figure 138: East Asia Market Value (USD Million) Analysis by Product Form, 2020-2035
  • Figure 139: East Asia Market Volume (Units) Analysis by Product Form, 2020-2035
  • Figure 140: East Asia Market Value Share (%) and BPS Analysis by Product Form, 2025-2035
  • Figure 141: East Asia Market Y-o-Y Growth (%) Projections by Product Form, 2025-2035
  • Figure 142: East Asia Market Value (USD Million) Analysis by Distribution Channel, 2020-2035
  • Figure 143: East Asia Market Volume (Units) Analysis by Distribution Channel, 2020-2035
  • Figure 144: East Asia Market Value Share (%) and BPS Analysis by Distribution Channel, 2025-2035
  • Figure 145: East Asia Market Y-o-Y Growth (%) Projections by Distribution Channel, 2025-2035
  • Figure 146: East Asia Market Attractiveness by Source Type, 2025-2035
  • Figure 147: East Asia Market Attractiveness by Application, 2025-2035
  • Figure 148: East Asia Market Attractiveness by Product Form, 2025-2035
  • Figure 149: East Asia Market Attractiveness by Distribution Channel, 2025-2035
  • Figure 150: East Asia Market Attractiveness by Country, 2025-2035
  • Figure 151: South Asia & Pacific Market Value (USD Million) by Source Type, 2025-2035
  • Figure 152: South Asia & Pacific Market Value (USD Million) by Application, 2025-2035
  • Figure 153: South Asia & Pacific Market Value (USD Million) by Product Form, 2025-2035
  • Figure 154: South Asia & Pacific Market Value (USD Million) by Distribution Channel, 2025-2035
  • Figure 155: South Asia & Pacific Market Value (USD Million) by Country, 2025-2035
  • Figure 156: South Asia & Pacific Market Value (USD Million) Analysis by Country, 2020-2035
  • Figure 157: South Asia & Pacific Market Volume (Units) Analysis by Country, 2020-2035
  • Figure 158: South Asia & Pacific Market Value Share (%) and BPS Analysis by Country, 2025-2035
  • Figure 159: South Asia & Pacific Market Y-o-Y Growth (%) Projections by Country, 2025-2035
  • Figure 160: South Asia & Pacific Market Value (USD Million) Analysis by Source Type, 2020-2035
  • Figure 161: South Asia & Pacific Market Volume (Units) Analysis by Source Type, 2020-2035
  • Figure 162: South Asia & Pacific Market Value Share (%) and BPS Analysis by Source Type, 2025-2035
  • Figure 163: South Asia & Pacific Market Y-o-Y Growth (%) Projections by Source Type, 2025-2035
  • Figure 164: South Asia & Pacific Market Value (USD Million) Analysis by Application, 2020-2035
  • Figure 165: South Asia & Pacific Market Volume (Units) Analysis by Application, 2020-2035
  • Figure 166: South Asia & Pacific Market Value Share (%) and BPS Analysis by Application, 2025-2035
  • Figure 167: South Asia & Pacific Market Y-o-Y Growth (%) Projections by Application, 2025-2035
  • Figure 168: South Asia & Pacific Market Value (USD Million) Analysis by Product Form, 2020-2035
  • Figure 169: South Asia & Pacific Market Volume (Units) Analysis by Product Form, 2020-2035
  • Figure 170: South Asia & Pacific Market Value Share (%) and BPS Analysis by Product Form, 2025-2035
  • Figure 171: South Asia & Pacific Market Y-o-Y Growth (%) Projections by Product Form, 2025-2035
  • Figure 172: South Asia & Pacific Market Value (USD Million) Analysis by Distribution Channel, 2020-2035
  • Figure 173: South Asia & Pacific Market Volume (Units) Analysis by Distribution Channel, 2020-2035
  • Figure 174: South Asia & Pacific Market Value Share (%) and BPS Analysis by Distribution Channel, 2025-2035
  • Figure 175: South Asia & Pacific Market Y-o-Y Growth (%) Projections by Distribution Channel, 2025-2035
  • Figure 176: South Asia & Pacific Market Attractiveness by Source Type, 2025-2035
  • Figure 177: South Asia & Pacific Market Attractiveness by Application, 2025-2035
  • Figure 178: South Asia & Pacific Market Attractiveness by Product Form, 2025-2035
  • Figure 179: South Asia & Pacific Market Attractiveness by Distribution Channel, 2025-2035
  • Figure 180: South Asia & Pacific Market Attractiveness by Country, 2025-2035
  • Figure 181: Middle East and Africa Market Value (USD Million) by Source Type, 2025-2035
  • Figure 182: Middle East and Africa Market Value (USD Million) by Application, 2025-2035
  • Figure 183: Middle East and Africa Market Value (USD Million) by Product Form, 2025-2035
  • Figure 184: Middle East and Africa Market Value (USD Million) by Distribution Channel, 2025-2035
  • Figure 185: Middle East and Africa Market Value (USD Million) by Country, 2025-2035
  • Figure 186: Middle East and Africa Market Value (USD Million) Analysis by Country, 2020-2035
  • Figure 187: Middle East and Africa Market Volume (Units) Analysis by Country, 2020-2035
  • Figure 188: Middle East and Africa Market Value Share (%) and BPS Analysis by Country, 2025-2035
  • Figure 189: Middle East and Africa Market Y-o-Y Growth (%) Projections by Country, 2025-2035
  • Figure 190: Middle East and Africa Market Value (USD Million) Analysis by Source Type, 2020-2035
  • Figure 191: Middle East and Africa Market Volume (Units) Analysis by Source Type, 2020-2035
  • Figure 192: Middle East and Africa Market Value Share (%) and BPS Analysis by Source Type, 2025-2035
  • Figure 193: Middle East and Africa Market Y-o-Y Growth (%) Projections by Source Type, 2025-2035
  • Figure 194: Middle East and Africa Market Value (USD Million) Analysis by Application, 2020-2035
  • Figure 195: Middle East and Africa Market Volume (Units) Analysis by Application, 2020-2035
  • Figure 196: Middle East and Africa Market Value Share (%) and BPS Analysis by Application, 2025-2035
  • Figure 197: Middle East and Africa Market Y-o-Y Growth (%) Projections by Application, 2025-2035
  • Figure 198: Middle East and Africa Market Value (USD Million) Analysis by Product Form, 2020-2035
  • Figure 199: Middle East and Africa Market Volume (Units) Analysis by Product Form, 2020-2035
  • Figure 200: Middle East and Africa Market Value Share (%) and BPS Analysis by Product Form, 2025-2035
  • Figure 201: Middle East and Africa Market Y-o-Y Growth (%) Projections by Product Form, 2025-2035
  • Figure 202: Middle East and Africa Market Value (USD Million) Analysis by Distribution Channel, 2020-2035
  • Figure 203: Middle East and Africa Market Volume (Units) Analysis by Distribution Channel, 2020-2035
  • Figure 204: Middle East and Africa Market Value Share (%) and BPS Analysis by Distribution Channel, 2025-2035
  • Figure 205: Middle East and Africa Market Y-o-Y Growth (%) Projections by Distribution Channel, 2025-2035
  • Figure 206: Middle East and Africa Market Attractiveness by Source Type, 2025-2035
  • Figure 207: Middle East and Africa Market Attractiveness by Application, 2025-2035
  • Figure 208: Middle East and Africa Market Attractiveness by Product Form, 2025-2035
  • Figure 209: Middle East and Africa Market Attractiveness by Distribution Channel, 2025-2035
  • Figure 210: Middle East and Africa Market Attractiveness by Country, 2025-2035

Frequently Asked Questions

How big is the Natural Skincare Preservatives Market in 2025?

The global Natural Skincare Preservatives Market is estimated to be valued at USD 1,463.4 million in 2025.

What will be the size of Natural Skincare Preservatives Market in 2035?

The market size for the Natural Skincare Preservatives Market is projected to reach USD 4,921.3 million by 2035.

How much will be the Natural Skincare Preservatives Market growth between 2025 and 2035?

The Natural Skincare Preservatives Market is expected to grow at a 12.9% CAGR between 2025 and 2035.

What are the key source types in the Natural Skincare Preservatives Market?

The key source types in Natural Skincare Preservatives Market are liquid concentrates, powders, and oil-dispersible forms.

Which application segment will contribute significant share in the Natural Skincare Preservatives Market in 2025?

In terms of application, the creams & lotions segment is projected to command 46.5% share in the Natural Skincare Preservatives Market in 2025.

Explore Similar Insights

Future Market Insights

Natural Skincare Preservatives Market

Chat With

MaRIA

Hi There, I am MaRIA, Your Market Research Intelligence Assistant. How may I help you?