Natural Bitterness Blockers Market Size and Share Forecast Outlook 2025 to 2035

The valuation of the Natural Bitterness Blockers Market is anticipated to stand at USD 1,780.2 Million 2025, reaching nearly USD 3,273.3 Million 2035. This trajectory reflects an absolute addition of USD 149.0 Million over the decade, marking a 6.3% CAGR. Effectively, the market size is projected to expand by almost two times, highlighting its position as one of the promising enablers of clean-label and taste-enhanced product formulations.

Quick Stats for Natural Bitterness Blockers Market

  • Natural Bitterness Blockers Market Value (2025): USD 1,780.2 Million
  • Natural Bitterness Blockers Market Forecast Value (2035): USD 3,273.3 Million
  • Natural Bitterness Blockers Market Forecast CAGR: 6.3%
  • Leading Segment in Natural Bitterness Blockers Market in 2025: Protein-based ingredients (34%
  • Key Growth Regions in the Natural Bitterness Blockers Market: North America, Europe, South Asia & Pacific
  • Top Key Players in Natural Bitterness Blockers Market: Givaudan, DSM-Firmenich, IFF (International Flavors & Fragrances), Kerry Group, Symrise

Natural Bitterness Blockers Market

Natural Bitterness Blockers Market Key Takeaways

Metric Value
Market Estimated Value in (2025E) USD 1,780.2 Million
Market Forecast Value in (2035F) USD 3,273.3 Million
Forecast CAGR (2025 to 2035) 6.3%

During the first half of the forecast period (2025-2030), the market is set to progress from USD 1,780.2 Million USD 241.0 million, representing a net growth of around USD 633 million. This stage is expected to be shaped by consistent adoption across food and beverage categories, functional supplements, and pharmaceutical oral dosage forms. The growth contribution from this phase will account for more than 40% of the decade’s total expansion, establishing a foundation for accelerated adoption beyond 2030.

From 2030 to 2035, growth momentum is expected to gain strength, as the market expands from USD 241.0 Million to USD 3,273.3 Million, adding approximately USD 860 million. This second phase is forecast to deliver a greater share of incremental gains close to 60% of decade growth driven by regulatory focus on sugar reduction, rising demand for protein-enriched products, and the penetration of functional foods across emerging regions. Market leadership is projected to remain concentrated in North America and Europe, although South Asia & Pacific is likely to emerge as a significant growth engine, underpinned by evolving dietary trends and expanding nutraceutical portfolios.

From 2020 to 2024, the Natural Bitterness Blockers Market expanded steadily, supported by growing reformulation initiatives across food, beverage, and pharmaceutical categories. By 2025, market value is projected at USD 1,780.2 Million, with leaders controlling more than half of total revenues. Early momentum has been built on protein-based formulations, where off-note masking is critical.

The competitive landscape is expected to evolve as players transition from ingredient supply toward integrated taste-modulation ecosystems. Beyond basic bitterness blocking, emphasis is shifting to multi-functional systems that combine sweetness enhancers, salt reducers, and botanical-derived solutions. By 2030, recurring revenues are projected to be supported by AI-enabled sensory modeling, clean-label demand, and co-creation partnerships with global F&B majors. Competitive advantage is forecast to move beyond raw ingredient innovation toward ecosystem strength, scalability, and application-specific customization, ensuring that global leaders sustain their dominance while regional specialists capture niche opportunities.

Why the Natural Bitterness Blockers Market is growing?

Growth in the Natural Bitterness Blockers Market is being accelerated by increasing demand for clean-label and health-oriented products. The shift toward sugar and sodium reduction is driving manufacturers to enhance taste profiles without relying on artificial additives. This trend is being reinforced by rising consumer expectations for natural ingredients across food, beverages, pharmaceuticals, and nutraceuticals.

The expansion of protein-enriched foods, plant-based diets, and botanical supplements is intensifying the need for effective taste-masking solutions, as bitterness challenges are more pronounced in these formulations. In addition, regulatory actions aimed at healthier consumption patterns are prompting wider adoption of bitterness blockers to maintain palatability in reformulated products.

Technological advances in flavor modulation and sensory science are expected to improve product performance, enabling precise applications across diverse matrices. Strong investment by leading players in R&D, alongside growing penetration in emerging regions, is anticipated to fuel steady growth. Consequently, the market is positioned for robust and sustained expansion through 2035.

Segmental Analysis

The Natural Bitterness Blockers Market has been segmented across multiple dimensions to highlight the structural drivers shaping long-term demand. Segmentation has been defined by ingredient type, application, and form, ensuring that both supply-side innovation and demand-side adoption are captured comprehensively. By ingredient type, the market has been divided into protein-based, lipid-based, carbohydrate-based, and botanical extracts, reflecting the diversity of natural solutions utilized to improve palatability.

Application-wise, the scope spans food and beverages, pharmaceuticals, nutraceuticals, pet food, and confectionery, with further detail on functional foods, dietary supplements, oral medicines, and OTC products. Form segmentation encompasses liquids, powders, and tablet/capsule formats, showcasing delivery preferences across industries. Through this segmentation, market performance is better understood in terms of adoption rates, growth potential, and future scalability across both developed and emerging regions.
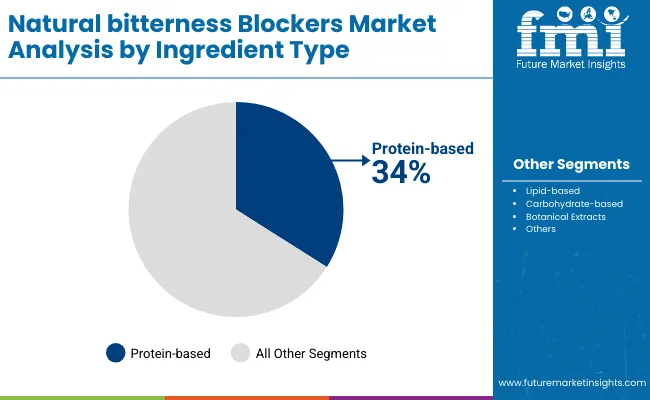
Insights into the Ingredient Type Segment with Protein-based Leading in Market Share

Natural Bitterness Blockers Market By Ingrediant

Component Segment Market Value Share, 2025
Protein-based 34%
Lipid-based 26%
Carbohydrate-based 22%
Botanical Extracts 18%

The protein-based ingredient type segment is projected to account for 34% of the global market revenue in 2025, establishing it as the dominant category among functional ingredient solutions. This leadership will be driven by strong demand in protein-enriched foods, dietary supplements, and sports nutrition. Consumer inclination toward plant-based proteins and the rising emphasis on wellness-focused diets are expected to reinforce growth.

Lipid-based ingredients will continue gaining traction due to their multifunctional role in improving texture and absorption, while carbohydrate-based segments will sustain steady demand in energy products. Botanical extracts are anticipated to expand their market appeal as natural health boosters. Continuous innovation in sourcing, formulation, and delivery formats will help protein-based ingredients consolidate their long-term position.
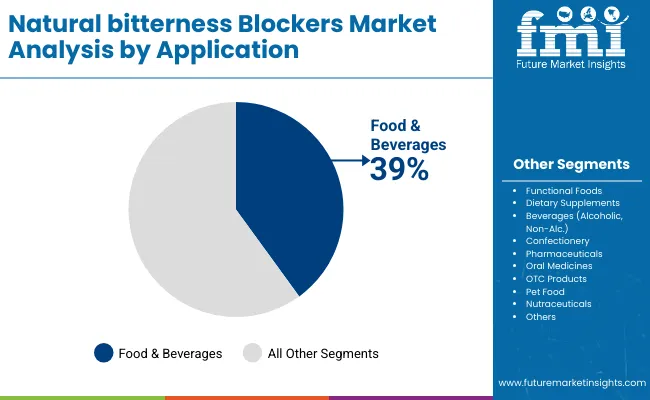
Insights into the Application Segment with Food & Beverages Dominating Demand

Natural Bitterness Blockers Market By Application

Range Segment Market Value Share, 2025
Food & Beverages 39%
Pharmaceuticals 23%
Pet Food 7%
Nutraceuticals 8%

The food and beverages segment is projected to account for 39% of global market revenue in 2025, establishing it as the leading application area for functional ingredients. This dominance will be supported by rising consumer demand for fortified foods, health-focused beverages, and protein-enriched dairy alternatives. Functional foods and dietary supplements will expand their relevance, reflecting the growing popularity of preventive healthcare and nutrition-backed lifestyles.

Pharmaceuticals are expected to remain highly significant, especially with oral medicines and OTC products increasingly fortified with advanced formulations. Pet food and nutraceuticals will also grow steadily as specialized health benefits gain traction. With product diversification, improved solubility, and taste innovation, food and beverages will maintain a central role in ingredient consumption.
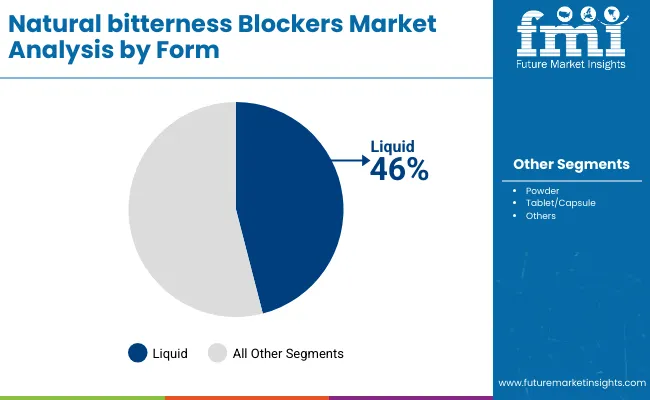
Insights into the Form Segment with Liquids Maintaining the Lead

Natural Bitterness Blockers Market By Form

Laser triangulation technology Market Value Share, 2025
Liquid 46%
Powder 38%
Tablet/Capsule 16%

The liquid form segment is projected to account for 46% of global market revenue in 2025, establishing it as the leading formulation category across applications. Its dominance will be reinforced by advantages such as faster absorption, higher bioavailability, and increasing preference for ready-to-drink products. The segment is expected to expand further with rising demand for functional beverages, pharmaceutical syrups, and liquid nutraceuticals. Powdered forms will remain critical in supplements, meal replacements, and sports nutrition due to stability and ease of transport. Tablets and capsules will continue to play a significant role in dosage precision and patient convenience, supported by innovations in encapsulation. Collectively, these formats will sustain balanced market penetration, with liquids maintaining clear leadership.

What are the Drivers, Restraints, and Key Trends of the Natural Bitterness Blockers Market?

The Natural Bitterness Blockers Market is being shaped by regulatory reforms, evolving consumer palates, and advances in sensory science. Opportunities are emerging as product portfolios are reformulated for health-conscious consumers, yet dynamics remain influenced by technological, cost, and compliance considerations across industries.

Regulatory Momentum Toward Sugar and Sodium Reduction

Global regulatory frameworks are exerting a pivotal influence on the adoption of natural bitterness blockers. Stricter front-of-pack labeling, nutrient thresholds, and reformulation targets are being implemented across key markets, particularly in North America and Europe. This shift is driving companies to prioritize solutions that preserve sensory quality while meeting health mandates. Governments are linking taste modulation with public health agendas, making compliance not only a legal necessity but also a brand positioning tool. The ability to mask bitterness in protein-rich, mineral-fortified, and plant-based formulations is being viewed as essential to maintaining product appeal. As regulation intensifies, bitterness blockers are projected to evolve from optional enhancers into strategic necessities, shaping investment patterns and long-term category growth.

Integration of AI-Enabled Sensory Modelling

The market is witnessing an emerging trend in which artificial intelligence and machine learning are being integrated into flavor and bitterness-blocking design. Predictive models are being deployed to simulate human taste receptor interactions, reducing reliance on trial-and-error formulation. This technological shift is enabling faster development cycles, customized solutions for specific matrices, and cost efficiencies in R&D.

AI-driven sensory modelling is also allowing suppliers to demonstrate efficacy with quantitative data, which strengthens trust with regulatory authorities and formulators. The trend is expected to expand as digital platforms converge with sensory labs, providing competitive advantage to firms that invest early. By 2030, AI-enabled approaches are anticipated to become embedded within standard formulation workflows, creating differentiation through precision and scalability.
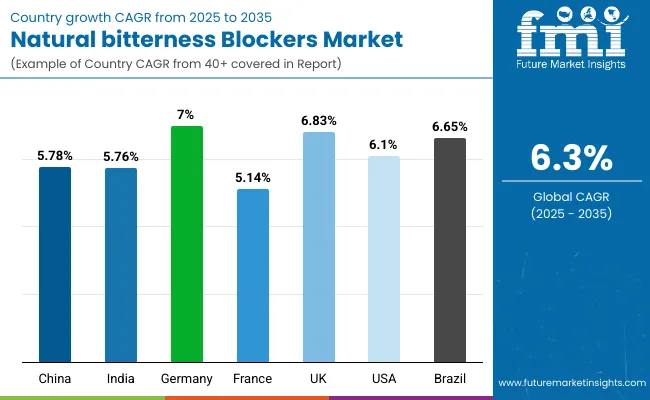
Analysis of Natural Bitterness Blockers Market By Key Countries

Natural Bitterness Blockers Market By Country

Countries CAGR
China 5.78%
India 5.76%
Germany 7.00%
France 5.14%
UK 6.83%
USA 6.1%
Brazil 6.65%

The Natural Bitterness Blockers Market demonstrates varying growth dynamics across major economies, shaped by regulatory intensity, dietary transitions, and innovation in functional formulations. Germany is expected to lead globally with a CAGR of 7.0%, supported by stringent food quality compliance, advanced flavor research capabilities, and strong pharmaceutical adoption. The UK (6.83%) and Brazil (6.65%) follow closely, benefiting from evolving consumer preferences for fortified products and expanded use in nutraceuticals.

In China (5.78%) and India (5.76%), growth is projected to be driven by rising penetration of functional foods and supplements, alongside increasing awareness of taste-masking solutions in protein-heavy and herbal formulations. These markets are expected to see acceleration as local manufacturers scale up clean-label portfolios.

The USA (6.1%) is forecast to record moderate expansion, reflecting a mature food and beverage base where adoption is influenced more by reformulation requirements linked to regulatory standards on sugar and sodium reduction. France (5.14%) is anticipated to grow at a slower pace relative to peers, with adoption concentrated in premium functional categories rather than mass-market applications.

Collectively, these countries highlight both mature and emerging demand clusters, reinforcing that adoption will be highly dependent on health policy shifts, consumer palatability demands, and technological advances in formulation science.
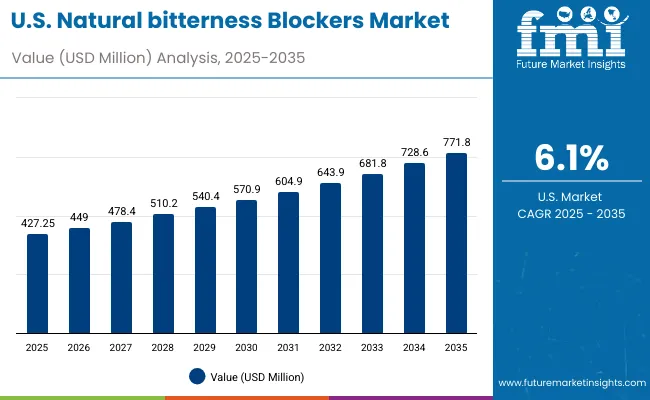
Sales Outlook for Natural Bitterness Blockers in the United States

Natural Bitterness Blockers Market Usa

Year USA Natural Bitterness Blockers Market (USD Million)
2025 427.25
2026 449.0
2027 478.4
2028 510.2
2029 540.4
2030 570.9
2031 604.9
2032 643.9
2033 681.8
2034 728.6
2035 771.8

The Natural Bitterness Blockers Market in the United States is projected to expand from USD 427.2 million in 2025 to USD 771.8 million by 2035, reflecting a CAGR of 6.1% over the period. Year-on-year growth is anticipated to remain stable, fluctuating between 5.1% and 6.9%, indicating resilient demand despite market maturity.

Adoption is being accelerated by reformulation mandates tied to sugar and sodium reduction, with food and beverage producers integrating bitterness blockers into mainstream product lines. Pharmaceuticals are expected to contribute strongly, as oral medicines and OTC formulations increasingly require taste-masking solutions to improve adherence. In parallel, functional foods and dietary supplements are expanding as delivery formats diversify, with proteins and botanical blends creating higher reliance on effective modulators.

By the end of the decade, incremental growth of nearly USD 343 million (2025-2030) is forecast, followed by an additional USD 201 million (2030-2035), underscoring the market’s long-term sustainability. The adoption of advanced sensory science and formulation technologies is expected to provide competitive differentiation, while regulatory shifts are projected to further entrench bitterness blockers as standard formulation inputs.

  • Strong adoption in food & beverages and pharmaceuticals supports growth trajectory.
  • Functional foods and dietary supplements remain high-potential contributors.
  • Regulatory and clean-label trends are expected to maintain long-term demand momentum.

Growth and Expansion Outlook for Natural Bitterness Blockers Market in the United Kingdom

The Natural Bitterness Blockers Market in the United Kingdom is projected to grow at a CAGR of 6.83% between 2025 and 2035, positioning it among the fastest-expanding markets in Europe. Demand is expected to be driven by reformulation across beverages, confectionery, and functional foods, spurred by stringent nutritional labeling regulations and sugar-reduction mandates.

Pharmaceutical adoption is anticipated to rise steadily, with oral medicines and OTC products requiring palatability enhancement to meet compliance standards. Food & beverage manufacturers are expected to embrace natural solutions to differentiate in competitive retail environments where clean-label preferences dominate consumer choices.

  • Regulatory-led reformulation is projected to remain a dominant growth driver.
  • Functional foods and nutraceuticals are expected to strengthen their role in adoption.
  • Palatability requirements in OTC and oral drugs are forecast to increase demand.
  • Clean-label and natural positioning is anticipated to enhance brand competitiveness.

Growth and Expansion Outlook for Natural Bitterness Blockers Market in India

The Natural Bitterness Blockers Market in India is forecast to expand at a CAGR of 5.76% from 2025 to 2035, supported by evolving dietary patterns and a fast-growing nutraceuticals sector. Rapid urbanization and the expansion of the health-conscious middle class are expected to accelerate demand.

Functional foods and dietary supplements are projected to be leading adopters, as protein-enriched and herbal formulations face bitterness challenges that require masking. The pharmaceutical industry is also anticipated to adopt natural solutions to improve adherence in pediatric and geriatric medication segments.

  • Nutraceuticals and functional foods are forecast to dominate adoption.
  • Herbal and botanical product penetration is projected to fuel growth.
  • Expanding middle-class consumption is expected to create mainstream opportunities.
  • Pharma applications for compliance-driven palatability are likely to rise steadily.

Sales Outlook for Natural Bitterness Blockers in China

The Natural Bitterness Blockers Market in China is expected to grow at a CAGR of 5.78% over 2025-2035, reflecting steady adoption across food, beverages, and health-related applications. Expanding consumer preference for fortified foods and clean-label products is anticipated to underpin long-term growth.

Dietary supplements and functional beverages are forecast to emerge as core drivers, with bitterness blockers integrated to improve acceptance of botanical-heavy formulations. Investments in local manufacturing capabilities are expected to reduce cost barriers, making natural solutions more accessible to mainstream brands.

  • Functional beverages and supplements are projected to anchor market expansion.
  • Localized manufacturing is expected to improve cost efficiency and penetration.
  • Demand for clean-label products is forecast to shape adoption strategies.
  • Herbal formulations with high bitterness are anticipated to require wider use.

In-depth Analysis of Natural Bitterness Blockers in Germany

Natural Bitterness Blockers Market Europe

Countries 2025
UK 20.41%
Germany 21.34%
Italy 11.28%
France 14.44%
Spain 11.41%
BNELUX 6.21%
Nordic 5.78%
Rest of Europe 9%
Countries 2035
UK 20.15%
Germany 21.03%
Italy 10.52%
France 14.71%
Spain 11.11%
BNELUX 5.24%
Nordic 5.88%
Rest of Europe 11%

The Natural Bitterness Blockers Market in Germany is projected to achieve the highest CAGR globally at 7.0% between 2025 and 2035, making it a key growth hub in Europe. The strong influence of regulatory standards and innovation in food technology is expected to drive momentum.

Pharmaceutical adoption is projected to remain strong due to Germany’s advanced healthcare sector, while functional foods and dietary supplements are anticipated to expand their reliance on bitterness masking. Demand from beverages and confectionery is expected to be reinforced by consumer insistence on natural and clean-label solutions.

Key Outlook Points
  • Germany is forecast to lead globally with a 7.0% CAGR.
  • Strong R&D and innovation ecosystems are expected to support rapid adoption.
  • Pharma, nutraceuticals, and functional foods are projected to be the core drivers.
  • Strict compliance and quality standards are anticipated to reinforce demand consistency.

Growth Outlook for NATURAL BITTERNESS BLOCKERS Market in Japan

Natural Bitterness Blockers Market Japan

Component Segment Market Value Share, 2025
Protein-based 37%
Lipid-based 25%
Carbohydrate-based 21%
Botanical Extracts 17%

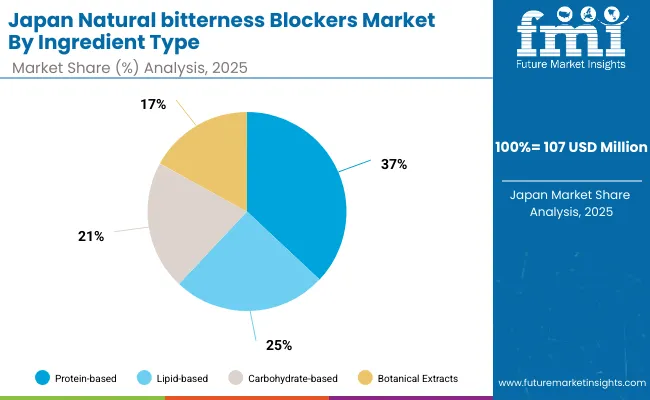
The Natural Bitterness Blockers Market in Japan is projected at USD 107 million in 2025, expected to nearly double by 2035 underpinned by a balanced CAGR of around 6.6%. Protein-based blockers dominate at 37%, reflecting Japan’s reliance on protein-enriched and amino acid-based formulations where bitterness is a significant challenge. Lipid-based and carbohydrate-based solutions together hold nearly 46%, providing versatility across food and beverage reformulations. Botanical extracts, at 17%, are steadily expanding as consumer preference for herbal and traditional remedies grows, aligning with Japan’s strong nutraceuticals culture.

A decisive transition toward clean-label health products is shaping adoption, while pharmaceutical applications are expected to expand as taste-masking becomes critical for pediatric and geriatric oral formulations. Integration of advanced formulation science with AI-driven sensory modeling is likely to elevate efficacy standards. By 2030, wider use in functional beverages and OTC nutraceuticals is anticipated to anchor market acceleration.
  • Market in Japan projected at USD 107 million in 2025 (~6% of global value).
  • Protein-based systems lead with 37% share, reflecting high reliance in fortified formulations.
  • Growth is supported by nutraceuticals and functional beverages adoption.
  • AI-enabled formulation science and clean-label positioning are projected to reinforce market penetration.

Opportunity Analysis of South Korea Natural Bitterness Blockers Market

Natural Bitterness Blockers Market South Korea

Range Segment Market Value Share, 2025
Liquid 47%
Powder 37%
Tablet/Capsule 16%

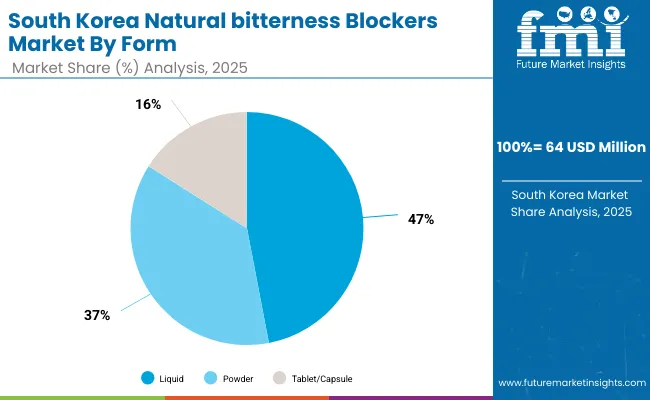
The Natural Bitterness Blockers Market in South Korea is valued at USD ~64 million in 2025, with an expected CAGR of around 6.6% through 2035. Liquids dominate with a 47% share, reflecting the country’s strong beverage innovation pipeline and high penetration of fortified drinks. Powders, holding 37%, are widely utilized in dry formulations, dietary supplements, and instant functional mixes. Tablets and capsules contribute 16%, primarily in the nutraceutical and pharmaceutical categories where controlled dosage and palatability are critical.

Market acceleration is anticipated as South Korea advances its functional beverage culture, supported by government-led health initiatives and consumer focus on wellness. Pharma adoption is projected to strengthen, particularly in pediatric and geriatric oral segments. Integration of natural bitterness blockers with plant-based and botanical-rich matrices is expected to be a decisive growth catalyst, as Korean consumers increasingly demand clean-label, taste-friendly alternatives.
  • Market in South Korea valued at USD ~64 million in 2025 (~3.6% of global value).
  • Liquids dominate with 47% share, led by fortified beverage applications.
  • Functional supplements and instant mixes drive powder-based adoption.
  • Growth projected to be reinforced by clean-label and wellness-driven consumption trends.

Competitive Landscape of Natural Bitterness Blockers Market

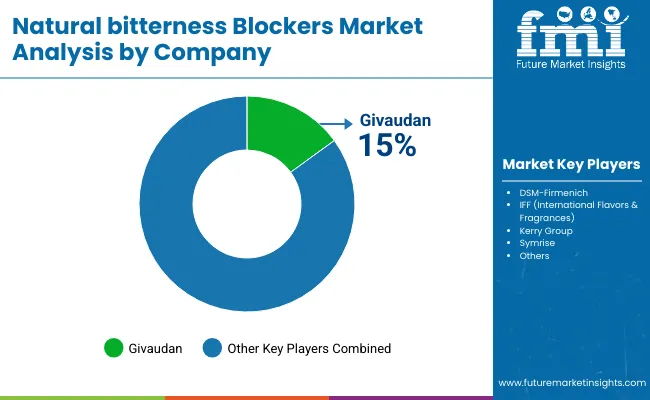
Natural Bitterness Blockers Market By Company

The Natural Bitterness Blockers Market is moderately consolidated, with a small group of multinational leaders, regional innovators, and niche players competing across applications spanning food, beverages, nutraceuticals, and pharmaceuticals. Global leaders such as Givaudan, DSM-Firmenich, IFF (International Flavors & Fragrances), Kerry Group, and Symrise hold significant market share, supported by advanced formulation capabilities, application labs, and strong partnerships with multinational consumer goods companies. Their strategies are increasingly focused on clean-label formulation, sensory science innovations, and regulatory-compliant solutions tailored to health-driven product reformulation.

Mid-sized innovators are expected to strengthen their role by offering specialized bitterness-blocking systems for functional foods, herbal nutraceuticals, and OTC pharmaceuticals. These firms are enhancing competitiveness by emphasizing speed-to-market, regional customization, and integration with flavor-modulation platforms.

Specialist providers are likely to address cost-sensitive emerging markets, particularly in South Asia & Pacific and Latin America, where adoption is at earlier stages. Their differentiation is projected to come from affordability, formulation flexibility, and alignment with traditional herbal product categories.

Competitive advantage is anticipated to shift toward integrated ecosystems where bitterness blockers are combined with sweetness enhancers, salt modulators, and AI-driven sensory modeling. Subscription-based partnerships, co-creation with food majors, and expansion in functional health categories are expected to define the next decade of competition.

Key Developments in Natural Bitterness Blockers Market

  • In July 2025, dsmfirmenich launched a new range of ModulaSENSE® maskers, designed to precisely target bitterness, astringency, and licorice-like notes in plant protein applications such as readytomix drinks and protein bars, enabling higher protein inclusion with superior taste quality.
  • In March 2025, dsm‑firmenich introduced a novel taste solutions portfolio for pharmaceutical applications, encompassing flavors, maskers, blockers, and sensates engineered to improve drug palatability across solid, liquid, and semi‑solid dosage forms streamlining sensory compliance and patient acceptance during formulation development.

Scope of the Report

Item Value
Quantitative Units USD 1,780.2 Million 2025; projected to reach USD 3,273.3 Million 2035
Ingredient Type Protein-based, Lipid-based, Carbohydrate-based, Botanical Extracts
Application Food & Beverages, Functional Foods, Dietary Supplements, Beverages (Alcoholic & Non-Alcoholic), Confectionery, Pharmaceuticals (Oral Medicines, OTC Products), Pet Food, Nutraceuticals
Form Liquid, Powder, Tablet/Capsule
Source Plant-based, Microbial-derived, Synthetic
Sales Channel Direct B2B Sales, Distributors, Online Retailers, Specialty Stores
Regions Covered North America, Europe, East Asia, South Asia & Pacific, Latin America, Middle East & Africa
Countries Covered United States, Germany, United Kingdom, France, China, Japan, India, Brazil, South Korea
Key Companies Profiled Givaudan, DSM-Firmenich, IFF (International Flavors & Fragrances), Kerry Group, Symrise

Key Segments

By Ingredient Type:

  • Protein-based
  • Lipid-based
  • Carbohydrate-based
  • Botanical Extracts

By Application:

  • Food & Beverages
    • Functional Foods
    • Dietary Supplements
    • Beverages (Alcoholic, Non-Alcoholic)
    • Confectionery
  • Pharmaceuticals
    • Oral Medicines
    • OTC Products
  • Pet Food
  • Nutraceuticals

By Form:

  • Liquid
  • Powder
  • Tablet/Capsule

By Source:

  • Plant-based
  • Microbial-derived
  • Synthetic

By Sales Channel:

  • Direct B2B Sales
  • Distributors
  • Online Retailers
  • Specialty Stores

By Region:

  • North America
  • Latin America
  • Europe
  • East Asia
  • South Asia & Pacific
  • Middle East and Africa

Table of Content

  1. Executive Summary
    • Global Market Outlook
    • Demand-side Trends
    • Supply-side Trends
    • Technology Roadmap Analysis
    • Analysis and Recommendations
  2. Market Overview
    • Market Coverage / Taxonomy
    • Market Definition / Scope / Limitations
  3. Market Background
    • Market Dynamics
      • Drivers
      • Restraints
      • Opportunity
      • Trends
    • Scenario Forecast
      • Demand in Optimistic Scenario
      • Demand in Likely Scenario
      • Demand in Conservative Scenario
    • Opportunity Map Analysis
    • Product Life Cycle Analysis
    • Supply Chain Analysis
    • Investment Feasibility Matrix
    • Value Chain Analysis
    • PESTLE and Porter’s Analysis
    • Regulatory Landscape
    • Regional Parent Market Outlook
    • Production and Consumption Statistics
    • Import and Export Statistics
  4. Global Market Analysis 2020 to 2024 and Forecast, 2025 to 2035
    • Historical Market Size Value (USD Million) & Volume (MT) Analysis, 2020 to 2024
    • Current and Future Market Size Value (USD Million) & Volume (MT) Projections, 2025 to 2035
      • Y-o-Y Growth Trend Analysis
      • Absolute $ Opportunity Analysis
  5. Global Market Pricing Analysis 2020 to 2024 and Forecast 2025 to 2035
  6. Global Market Analysis 2020 to 2024 and Forecast 2025 to 2035, By Ingredient Type
    • Introduction / Key Findings
    • Historical Market Size Value (USD Million) & Volume (MT) Analysis By Ingredient Type, 2020 to 2024
    • Current and Future Market Size Value (USD Million) & Volume (MT) Analysis and Forecast By Ingredient Type, 2025 to 2035
      • Protein-based
      • Lipid-based
      • Carbohydrate-based
      • Botanical Extracts
    • Y-o-Y Growth Trend Analysis By Ingredient Type, 2020 to 2024
    • Absolute $ Opportunity Analysis By Ingredient Type, 2025 to 2035
  7. Global Market Analysis 2020 to 2024 and Forecast 2025 to 2035, By Application
    • Introduction / Key Findings
    • Historical Market Size Value (USD Million) & Volume (MT) Analysis By Application, 2020 to 2024
    • Current and Future Market Size Value (USD Million) & Volume (MT) Analysis and Forecast By Application, 2025 to 2035
      • Food & Beverages
        • Functional Foods
        • Dietary Supplements
        • Beverages (Alcoholic, Non-Alcoholic)
        • Confectionery
      • Pharmaceuticals
        • Oral Medicines
        • OTC Products
      • Pet Food
      • Nutraceuticals
    • Y-o-Y Growth Trend Analysis By Application, 2020 to 2024
    • Absolute $ Opportunity Analysis By Application, 2025 to 2035
  8. Global Market Analysis 2020 to 2024 and Forecast 2025 to 2035, By Form
    • Introduction / Key Findings
    • Historical Market Size Value (USD Million) & Volume (MT) Analysis By Form, 2020 to 2024
    • Current and Future Market Size Value (USD Million) & Volume (MT) Analysis and Forecast By Form, 2025 to 2035
      • Liquid
      • Powder
      • Tablet/Capsule
    • Y-o-Y Growth Trend Analysis By Form, 2020 to 2024
    • Absolute $ Opportunity Analysis By Form, 2025 to 2035
  9. Global Market Analysis 2020 to 2024 and Forecast 2025 to 2035, By Source
    • Introduction / Key Findings
    • Historical Market Size Value (USD Million) & Volume (MT) Analysis By Source, 2020 to 2024
    • Current and Future Market Size Value (USD Million) & Volume (MT) Analysis and Forecast By Source, 2025 to 2035
      • Plant-based
      • Microbial-derived
      • Synthetic
    • Y-o-Y Growth Trend Analysis By Source, 2020 to 2024
    • Absolute $ Opportunity Analysis By Source, 2025 to 2035
  10. Global Market Analysis 2020 to 2024 and Forecast 2025 to 2035, By Sales Channel
    • Introduction / Key Findings
    • Historical Market Size Value (USD Million) & Volume (MT) Analysis By Sales Channel, 2020 to 2024
    • Current and Future Market Size Value (USD Million) & Volume (MT) Analysis and Forecast By Sales Channel, 2025 to 2035
      • Direct B2B Sales
      • Distributors
      • Online Retailers
      • Specialty Stores
    • Y-o-Y Growth Trend Analysis By Sales Channel, 2020 to 2024
    • Absolute $ Opportunity Analysis By Sales Channel, 2025 to 2035
  11. Global Market Analysis 2020 to 2024 and Forecast 2025 to 2035, By Region
    • Introduction
    • Historical Market Size Value (USD Million) & Volume (MT) Analysis By Region, 2020 to 2024
    • Current Market Size Value (USD Million) & Volume (MT) Analysis and Forecast By Region, 2025 to 2035
      • North America
      • Latin America
      • Europe
      • East Asia
      • South Asia & Pacific
      • Middle East and Africa
    • Market Attractiveness Analysis By Region
  12. North America Market Analysis 2020 to 2024 and Forecast 2025 to 2035, By Country
    • Historical Market Size Value (USD Million) & Volume (MT) Trend Analysis By Market Taxonomy, 2020 to 2024
    • Market Size Value (USD Million) & Volume (MT) Forecast By Market Taxonomy, 2025 to 2035
      • By Country
        • USA
        • Canada
      • By Ingredient Type
      • By Application
      • By Form
      • By Source
      • By Sales Channel
    • Market Attractiveness Analysis
      • By Country
      • By Ingredient Type
      • By Application
      • By Form
      • By Source
      • By Sales Channel
    • Key Takeaways
  13. Latin America Market Analysis 2020 to 2024 and Forecast 2025 to 2035, By Country
    • Historical Market Size Value (USD Million) & Volume (MT) Trend Analysis By Market Taxonomy, 2020 to 2024
    • Market Size Value (USD Million) & Volume (MT) Forecast By Market Taxonomy, 2025 to 2035
      • By Country
        • Brazil
        • Mexico
        • Colombia
        • Rest of Latin America
      • By Ingredient Type
      • By Application
      • By Form
      • By Source
      • By Sales Channel
    • Market Attractiveness Analysis
      • By Country
      • By Ingredient Type
      • By Application
      • By Form
      • By Source
      • By Sales Channel
    • Key Takeaways
  14. Europe Market Analysis 2020 to 2024 and Forecast 2025 to 2035, By Country
    • Historical Market Size Value (USD Million) & Volume (MT) Trend Analysis By Market Taxonomy, 2020 to 2024
    • Market Size Value (USD Million) & Volume (MT) Forecast By Market Taxonomy, 2025 to 2035
      • By Country
        • Germany
        • UK
        • France
        • Italy
        • Spain
        • Belgium
        • Netherlands
        • Nordic
        • Switzerland
        • Russia
        • Poland
        • Rest of Europe
      • By Ingredient Type
      • By Application
      • By Form
      • By Source
      • By Sales Channel
    • Market Attractiveness Analysis
      • By Country
      • By Ingredient Type
      • By Application
      • By Form
      • By Source
      • By Sales Channel
    • Key Takeaways
  15. East Asia Market Analysis 2020 to 2024 and Forecast 2025 to 2035, By Country
    • Historical Market Size Value (USD Million) & Volume (MT) Trend Analysis By Market Taxonomy, 2020 to 2024
    • Market Size Value (USD Million) & Volume (MT) Forecast By Market Taxonomy, 2025 to 2035
      • By Country
        • China
        • Japan
        • South Korea
      • By Ingredient Type
      • By Application
      • By Form
      • By Source
      • By Sales Channel
    • Market Attractiveness Analysis
      • By Country
      • By Ingredient Type
      • By Application
      • By Form
      • By Source
      • By Sales Channel
    • Key Takeaways
  16. South Asia & Pacific Market Analysis 2020 to 2024 and Forecast 2025 to 2035, By Country
    • Historical Market Size Value (USD Million) & Volume (MT) Trend Analysis By Market Taxonomy, 2020 to 2024
    • Market Size Value (USD Million) & Volume (MT) Forecast By Market Taxonomy, 2025 to 2035
      • By Country
        • India
        • Thailand
        • Malaysia
        • Indonesia
        • Singapore
        • Vietnam
        • Australia
        • New Zealand
        • Rest of South Asia
      • By Ingredient Type
      • By Application
      • By Form
      • By Source
      • By Sales Channel
    • Market Attractiveness Analysis
      • By Country
      • By Ingredient Type
      • By Application
      • By Form
      • By Source
      • By Sales Channel
    • Key Takeaways
  17. Middle East and Africa Market Analysis 2020 to 2024 and Forecast 2025 to 2035, By Country
    • Historical Market Size Value (USD Million) & Volume (MT) Trend Analysis By Market Taxonomy, 2020 to 2024
    • Market Size Value (USD Million) & Volume (MT) Forecast By Market Taxonomy, 2025 to 2035
      • By Country
        • Turkey
        • UAE
        • Saudi Arabia
        • Israel
        • Other GCC Countries
        • North Africa
        • South Africa
      • By Ingredient Type
      • By Application
      • By Form
      • By Source
      • By Sales Channel
    • Market Attractiveness Analysis
      • By Country
      • By Ingredient Type
      • By Application
      • By Form
      • By Source
      • By Sales Channel
    • Key Takeaways
  18. Key Countries Market Analysis
    • USA
      • Pricing Analysis
      • Market Share Analysis, 2024
        • By Ingredient Type
        • By Application
        • By Form
        • By Source
        • By Sales Channel
    • Canada
      • Pricing Analysis
      • Market Share Analysis, 2024
        • By Ingredient Type
        • By Application
        • By Form
        • By Source
        • By Sales Channel
    • Brazil
      • Pricing Analysis
      • Market Share Analysis, 2024
        • By Ingredient Type
        • By Application
        • By Form
        • By Source
        • By Sales Channel
    • Mexico
      • Pricing Analysis
      • Market Share Analysis, 2024
        • By Ingredient Type
        • By Application
        • By Form
        • By Source
        • By Sales Channel
    • Colombia
      • Pricing Analysis
      • Market Share Analysis, 2024
        • By Ingredient Type
        • By Application
        • By Form
        • By Source
        • By Sales Channel
    • Germany
      • Pricing Analysis
      • Market Share Analysis, 2024
        • By Ingredient Type
        • By Application
        • By Form
        • By Source
        • By Sales Channel
    • UK
      • Pricing Analysis
      • Market Share Analysis, 2024
        • By Ingredient Type
        • By Application
        • By Form
        • By Source
        • By Sales Channel
    • France
      • Pricing Analysis
      • Market Share Analysis, 2024
        • By Ingredient Type
        • By Application
        • By Form
        • By Source
        • By Sales Channel
    • Italy
      • Pricing Analysis
      • Market Share Analysis, 2024
        • By Ingredient Type
        • By Application
        • By Form
        • By Source
        • By Sales Channel
    • Spain
      • Pricing Analysis
      • Market Share Analysis, 2024
        • By Ingredient Type
        • By Application
        • By Form
        • By Source
        • By Sales Channel
    • Belgium
      • Pricing Analysis
      • Market Share Analysis, 2024
        • By Ingredient Type
        • By Application
        • By Form
        • By Source
        • By Sales Channel
    • Netherlands
      • Pricing Analysis
      • Market Share Analysis, 2024
        • By Ingredient Type
        • By Application
        • By Form
        • By Source
        • By Sales Channel
    • Nordic
      • Pricing Analysis
      • Market Share Analysis, 2024
        • By Ingredient Type
        • By Application
        • By Form
        • By Source
        • By Sales Channel
    • Switzerland
      • Pricing Analysis
      • Market Share Analysis, 2024
        • By Ingredient Type
        • By Application
        • By Form
        • By Source
        • By Sales Channel
    • Russia
      • Pricing Analysis
      • Market Share Analysis, 2024
        • By Ingredient Type
        • By Application
        • By Form
        • By Source
        • By Sales Channel
    • Poland
      • Pricing Analysis
      • Market Share Analysis, 2024
        • By Ingredient Type
        • By Application
        • By Form
        • By Source
        • By Sales Channel
    • China
      • Pricing Analysis
      • Market Share Analysis, 2024
        • By Ingredient Type
        • By Application
        • By Form
        • By Source
        • By Sales Channel
    • Japan
      • Pricing Analysis
      • Market Share Analysis, 2024
        • By Ingredient Type
        • By Application
        • By Form
        • By Source
        • By Sales Channel
    • South Korea
      • Pricing Analysis
      • Market Share Analysis, 2024
        • By Ingredient Type
        • By Application
        • By Form
        • By Source
        • By Sales Channel
    • India
      • Pricing Analysis
      • Market Share Analysis, 2024
        • By Ingredient Type
        • By Application
        • By Form
        • By Source
        • By Sales Channel
    • Thailand
      • Pricing Analysis
      • Market Share Analysis, 2024
        • By Ingredient Type
        • By Application
        • By Form
        • By Source
        • By Sales Channel
    • Malaysia
      • Pricing Analysis
      • Market Share Analysis, 2024
        • By Ingredient Type
        • By Application
        • By Form
        • By Source
        • By Sales Channel
    • Indonesia
      • Pricing Analysis
      • Market Share Analysis, 2024
        • By Ingredient Type
        • By Application
        • By Form
        • By Source
        • By Sales Channel
    • Singapore
      • Pricing Analysis
      • Market Share Analysis, 2024
        • By Ingredient Type
        • By Application
        • By Form
        • By Source
        • By Sales Channel
    • Vietnam
      • Pricing Analysis
      • Market Share Analysis, 2024
        • By Ingredient Type
        • By Application
        • By Form
        • By Source
        • By Sales Channel
    • Australia
      • Pricing Analysis
      • Market Share Analysis, 2024
        • By Ingredient Type
        • By Application
        • By Form
        • By Source
        • By Sales Channel
    • Turkey
      • Pricing Analysis
      • Market Share Analysis, 2024
        • By Ingredient Type
        • By Application
        • By Form
        • By Source
        • By Sales Channel
    • UAE
      • Pricing Analysis
      • Market Share Analysis, 2024
        • By Ingredient Type
        • By Application
        • By Form
        • By Source
        • By Sales Channel
  19. Market Structure Analysis
    • Competition Dashboard
    • Competition Benchmarking
    • Market Share Analysis of Top Players
      • By Regional
      • By Ingredient Type
      • By Application
      • By Form
      • By Source
      • By Sales Channel
  20. Competition Analysis
    • Competition Deep Dive
      • Givaudan
        • Overview
        • Product Portfolio
        • Profitability by Market Segments (Product/Age /Sales Channel/Region)
        • Sales Footprint
        • Strategy Overview
        • DSM-Firmenich
        • IFF (International Flavors & Fragrances)
        • Kerry Group
        • Symrise
    • Assumptions & Acronyms Used
    • Research Methodology

List of Tables

  • Table 1: Global Market Value (USD Million) Forecast by Region, 2020-2035
  • Table 2: Global Market Volume (MT) Forecast by Region, 2020-2035
  • Table 3: Global Market Value (USD Million) Forecast by Ingredient Type, 2020-2035
  • Table 4: Global Market Volume (MT) Forecast by Ingredient Type, 2020-2035
  • Table 5: Global Market Value (USD Million) Forecast by Application, 2020-2035
  • Table 6: Global Market Volume (MT) Forecast by Application, 2020-2035
  • Table 7: Global Market Value (USD Million) Forecast by Form, 2020-2035
  • Table 8: Global Market Volume (MT) Forecast by Form, 2020-2035
  • Table 9: Global Market Value (USD Million) Forecast by Source, 2020-2035
  • Table 10: Global Market Volume (MT) Forecast by Source, 2020-2035
  • Table 11: Global Market Value (USD Million) Forecast by Sales Channel, 2020-2035
  • Table 12: Global Market Volume (MT) Forecast by Sales Channel, 2020-2035
  • Table 13: North America Market Value (USD Million) Forecast by Country, 2020-2035
  • Table 14: North America Market Volume (MT) Forecast by Country, 2020-2035
  • Table 15: North America Market Value (USD Million) Forecast by Ingredient Type, 2020-2035
  • Table 16: North America Market Volume (MT) Forecast by Ingredient Type, 2020-2035
  • Table 17: North America Market Value (USD Million) Forecast by Application, 2020-2035
  • Table 18: North America Market Volume (MT) Forecast by Application, 2020-2035
  • Table 19: North America Market Value (USD Million) Forecast by Form, 2020-2035
  • Table 20: North America Market Volume (MT) Forecast by Form, 2020-2035
  • Table 21: North America Market Value (USD Million) Forecast by Source, 2020-2035
  • Table 22: North America Market Volume (MT) Forecast by Source, 2020-2035
  • Table 23: North America Market Value (USD Million) Forecast by Sales Channel, 2020-2035
  • Table 24: North America Market Volume (MT) Forecast by Sales Channel, 2020-2035
  • Table 25: Latin America Market Value (USD Million) Forecast by Country, 2020-2035
  • Table 26: Latin America Market Volume (MT) Forecast by Country, 2020-2035
  • Table 27: Latin America Market Value (USD Million) Forecast by Ingredient Type, 2020-2035
  • Table 28: Latin America Market Volume (MT) Forecast by Ingredient Type, 2020-2035
  • Table 29: Latin America Market Value (USD Million) Forecast by Application, 2020-2035
  • Table 30: Latin America Market Volume (MT) Forecast by Application, 2020-2035
  • Table 31: Latin America Market Value (USD Million) Forecast by Form, 2020-2035
  • Table 32: Latin America Market Volume (MT) Forecast by Form, 2020-2035
  • Table 33: Latin America Market Value (USD Million) Forecast by Source, 2020-2035
  • Table 34: Latin America Market Volume (MT) Forecast by Source, 2020-2035
  • Table 35: Latin America Market Value (USD Million) Forecast by Sales Channel, 2020-2035
  • Table 36: Latin America Market Volume (MT) Forecast by Sales Channel, 2020-2035
  • Table 37: Europe Market Value (USD Million) Forecast by Country, 2020-2035
  • Table 38: Europe Market Volume (MT) Forecast by Country, 2020-2035
  • Table 39: Europe Market Value (USD Million) Forecast by Ingredient Type, 2020-2035
  • Table 40: Europe Market Volume (MT) Forecast by Ingredient Type, 2020-2035
  • Table 41: Europe Market Value (USD Million) Forecast by Application, 2020-2035
  • Table 42: Europe Market Volume (MT) Forecast by Application, 2020-2035
  • Table 43: Europe Market Value (USD Million) Forecast by Form, 2020-2035
  • Table 44: Europe Market Volume (MT) Forecast by Form, 2020-2035
  • Table 45: Europe Market Value (USD Million) Forecast by Source, 2020-2035
  • Table 46: Europe Market Volume (MT) Forecast by Source, 2020-2035
  • Table 47: Europe Market Value (USD Million) Forecast by Sales Channel, 2020-2035
  • Table 48: Europe Market Volume (MT) Forecast by Sales Channel, 2020-2035
  • Table 49: East Asia Market Value (USD Million) Forecast by Country, 2020-2035
  • Table 50: East Asia Market Volume (MT) Forecast by Country, 2020-2035
  • Table 51: East Asia Market Value (USD Million) Forecast by Ingredient Type, 2020-2035
  • Table 52: East Asia Market Volume (MT) Forecast by Ingredient Type, 2020-2035
  • Table 53: East Asia Market Value (USD Million) Forecast by Application, 2020-2035
  • Table 54: East Asia Market Volume (MT) Forecast by Application, 2020-2035
  • Table 55: East Asia Market Value (USD Million) Forecast by Form, 2020-2035
  • Table 56: East Asia Market Volume (MT) Forecast by Form, 2020-2035
  • Table 57: East Asia Market Value (USD Million) Forecast by Source, 2020-2035
  • Table 58: East Asia Market Volume (MT) Forecast by Source, 2020-2035
  • Table 59: East Asia Market Value (USD Million) Forecast by Sales Channel, 2020-2035
  • Table 60: East Asia Market Volume (MT) Forecast by Sales Channel, 2020-2035
  • Table 61: South Asia & Pacific Market Value (USD Million) Forecast by Country, 2020-2035
  • Table 62: South Asia & Pacific Market Volume (MT) Forecast by Country, 2020-2035
  • Table 63: South Asia & Pacific Market Value (USD Million) Forecast by Ingredient Type, 2020-2035
  • Table 64: South Asia & Pacific Market Volume (MT) Forecast by Ingredient Type, 2020-2035
  • Table 65: South Asia & Pacific Market Value (USD Million) Forecast by Application, 2020-2035
  • Table 66: South Asia & Pacific Market Volume (MT) Forecast by Application, 2020-2035
  • Table 67: South Asia & Pacific Market Value (USD Million) Forecast by Form, 2020-2035
  • Table 68: South Asia & Pacific Market Volume (MT) Forecast by Form, 2020-2035
  • Table 69: South Asia & Pacific Market Value (USD Million) Forecast by Source, 2020-2035
  • Table 70: South Asia & Pacific Market Volume (MT) Forecast by Source, 2020-2035
  • Table 71: South Asia & Pacific Market Value (USD Million) Forecast by Sales Channel, 2020-2035
  • Table 72: South Asia & Pacific Market Volume (MT) Forecast by Sales Channel, 2020-2035
  • Table 73: Middle East and Africa Market Value (USD Million) Forecast by Country, 2020-2035
  • Table 74: Middle East and Africa Market Volume (MT) Forecast by Country, 2020-2035
  • Table 75: Middle East and Africa Market Value (USD Million) Forecast by Ingredient Type, 2020-2035
  • Table 76: Middle East and Africa Market Volume (MT) Forecast by Ingredient Type, 2020-2035
  • Table 77: Middle East and Africa Market Value (USD Million) Forecast by Application, 2020-2035
  • Table 78: Middle East and Africa Market Volume (MT) Forecast by Application, 2020-2035
  • Table 79: Middle East and Africa Market Value (USD Million) Forecast by Form, 2020-2035
  • Table 80: Middle East and Africa Market Volume (MT) Forecast by Form, 2020-2035
  • Table 81: Middle East and Africa Market Value (USD Million) Forecast by Source, 2020-2035
  • Table 82: Middle East and Africa Market Volume (MT) Forecast by Source, 2020-2035
  • Table 83: Middle East and Africa Market Value (USD Million) Forecast by Sales Channel, 2020-2035
  • Table 84: Middle East and Africa Market Volume (MT) Forecast by Sales Channel, 2020-2035

List of Figures

  • Figure 1: Global Market Volume (MT) Forecast 2020-2035
  • Figure 2: Global Market Pricing Analysis
  • Figure 3: Global Market Value (USD Million) Forecast 2020-2035
  • Figure 4: Global Market Value Share and BPS Analysis by Ingredient Type, 2025 and 2035
  • Figure 5: Global Market Y-o-Y Growth Comparison by Ingredient Type, 2025-2035
  • Figure 6: Global Market Attractiveness Analysis by Ingredient Type
  • Figure 7: Global Market Value Share and BPS Analysis by Application, 2025 and 2035
  • Figure 8: Global Market Y-o-Y Growth Comparison by Application, 2025-2035
  • Figure 9: Global Market Attractiveness Analysis by Application
  • Figure 10: Global Market Value Share and BPS Analysis by Form, 2025 and 2035
  • Figure 11: Global Market Y-o-Y Growth Comparison by Form, 2025-2035
  • Figure 12: Global Market Attractiveness Analysis by Form
  • Figure 13: Global Market Value Share and BPS Analysis by Source, 2025 and 2035
  • Figure 14: Global Market Y-o-Y Growth Comparison by Source, 2025-2035
  • Figure 15: Global Market Attractiveness Analysis by Source
  • Figure 16: Global Market Value Share and BPS Analysis by Sales Channel, 2025 and 2035
  • Figure 17: Global Market Y-o-Y Growth Comparison by Sales Channel, 2025-2035
  • Figure 18: Global Market Attractiveness Analysis by Sales Channel
  • Figure 19: Global Market Value (USD Million) Share and BPS Analysis by Region, 2025 and 2035
  • Figure 20: Global Market Y-o-Y Growth Comparison by Region, 2025-2035
  • Figure 21: Global Market Attractiveness Analysis by Region
  • Figure 22: North America Market Incremental $ Opportunity, 2025-2035
  • Figure 23: Latin America Market Incremental $ Opportunity, 2025-2035
  • Figure 24: Europe Market Incremental $ Opportunity, 2025-2035
  • Figure 25: East Asia Market Incremental $ Opportunity, 2025-2035
  • Figure 26: South Asia & Pacific Market Incremental $ Opportunity, 2025-2035
  • Figure 27: Middle East and Africa Market Incremental $ Opportunity, 2025-2035
  • Figure 28: North America Market Value Share and BPS Analysis by Country, 2025 and 2035
  • Figure 29: North America Market Value Share and BPS Analysis by Ingredient Type, 2025 and 2035
  • Figure 30: North America Market Y-o-Y Growth Comparison by Ingredient Type, 2025-2035
  • Figure 31: North America Market Attractiveness Analysis by Ingredient Type
  • Figure 32: North America Market Value Share and BPS Analysis by Application, 2025 and 2035
  • Figure 33: North America Market Y-o-Y Growth Comparison by Application, 2025-2035
  • Figure 34: North America Market Attractiveness Analysis by Application
  • Figure 35: North America Market Value Share and BPS Analysis by Form, 2025 and 2035
  • Figure 36: North America Market Y-o-Y Growth Comparison by Form, 2025-2035
  • Figure 37: North America Market Attractiveness Analysis by Form
  • Figure 38: North America Market Value Share and BPS Analysis by Source, 2025 and 2035
  • Figure 39: North America Market Y-o-Y Growth Comparison by Source, 2025-2035
  • Figure 40: North America Market Attractiveness Analysis by Source
  • Figure 41: North America Market Value Share and BPS Analysis by Sales Channel, 2025 and 2035
  • Figure 42: North America Market Y-o-Y Growth Comparison by Sales Channel, 2025-2035
  • Figure 43: North America Market Attractiveness Analysis by Sales Channel
  • Figure 44: Latin America Market Value Share and BPS Analysis by Country, 2025 and 2035
  • Figure 45: Latin America Market Value Share and BPS Analysis by Ingredient Type, 2025 and 2035
  • Figure 46: Latin America Market Y-o-Y Growth Comparison by Ingredient Type, 2025-2035
  • Figure 47: Latin America Market Attractiveness Analysis by Ingredient Type
  • Figure 48: Latin America Market Value Share and BPS Analysis by Application, 2025 and 2035
  • Figure 49: Latin America Market Y-o-Y Growth Comparison by Application, 2025-2035
  • Figure 50: Latin America Market Attractiveness Analysis by Application
  • Figure 51: Latin America Market Value Share and BPS Analysis by Form, 2025 and 2035
  • Figure 52: Latin America Market Y-o-Y Growth Comparison by Form, 2025-2035
  • Figure 53: Latin America Market Attractiveness Analysis by Form
  • Figure 54: Latin America Market Value Share and BPS Analysis by Source, 2025 and 2035
  • Figure 55: Latin America Market Y-o-Y Growth Comparison by Source, 2025-2035
  • Figure 56: Latin America Market Attractiveness Analysis by Source
  • Figure 57: Latin America Market Value Share and BPS Analysis by Sales Channel, 2025 and 2035
  • Figure 58: Latin America Market Y-o-Y Growth Comparison by Sales Channel, 2025-2035
  • Figure 59: Latin America Market Attractiveness Analysis by Sales Channel
  • Figure 60: Europe Market Value Share and BPS Analysis by Country, 2025 and 2035
  • Figure 61: Europe Market Value Share and BPS Analysis by Ingredient Type, 2025 and 2035
  • Figure 62: Europe Market Y-o-Y Growth Comparison by Ingredient Type, 2025-2035
  • Figure 63: Europe Market Attractiveness Analysis by Ingredient Type
  • Figure 64: Europe Market Value Share and BPS Analysis by Application, 2025 and 2035
  • Figure 65: Europe Market Y-o-Y Growth Comparison by Application, 2025-2035
  • Figure 66: Europe Market Attractiveness Analysis by Application
  • Figure 67: Europe Market Value Share and BPS Analysis by Form, 2025 and 2035
  • Figure 68: Europe Market Y-o-Y Growth Comparison by Form, 2025-2035
  • Figure 69: Europe Market Attractiveness Analysis by Form
  • Figure 70: Europe Market Value Share and BPS Analysis by Source, 2025 and 2035
  • Figure 71: Europe Market Y-o-Y Growth Comparison by Source, 2025-2035
  • Figure 72: Europe Market Attractiveness Analysis by Source
  • Figure 73: Europe Market Value Share and BPS Analysis by Sales Channel, 2025 and 2035
  • Figure 74: Europe Market Y-o-Y Growth Comparison by Sales Channel, 2025-2035
  • Figure 75: Europe Market Attractiveness Analysis by Sales Channel
  • Figure 76: East Asia Market Value Share and BPS Analysis by Country, 2025 and 2035
  • Figure 77: East Asia Market Value Share and BPS Analysis by Ingredient Type, 2025 and 2035
  • Figure 78: East Asia Market Y-o-Y Growth Comparison by Ingredient Type, 2025-2035
  • Figure 79: East Asia Market Attractiveness Analysis by Ingredient Type
  • Figure 80: East Asia Market Value Share and BPS Analysis by Application, 2025 and 2035
  • Figure 81: East Asia Market Y-o-Y Growth Comparison by Application, 2025-2035
  • Figure 82: East Asia Market Attractiveness Analysis by Application
  • Figure 83: East Asia Market Value Share and BPS Analysis by Form, 2025 and 2035
  • Figure 84: East Asia Market Y-o-Y Growth Comparison by Form, 2025-2035
  • Figure 85: East Asia Market Attractiveness Analysis by Form
  • Figure 86: East Asia Market Value Share and BPS Analysis by Source, 2025 and 2035
  • Figure 87: East Asia Market Y-o-Y Growth Comparison by Source, 2025-2035
  • Figure 88: East Asia Market Attractiveness Analysis by Source
  • Figure 89: East Asia Market Value Share and BPS Analysis by Sales Channel, 2025 and 2035
  • Figure 90: East Asia Market Y-o-Y Growth Comparison by Sales Channel, 2025-2035
  • Figure 91: East Asia Market Attractiveness Analysis by Sales Channel
  • Figure 92: South Asia & Pacific Market Value Share and BPS Analysis by Country, 2025 and 2035
  • Figure 93: South Asia & Pacific Market Value Share and BPS Analysis by Ingredient Type, 2025 and 2035
  • Figure 94: South Asia & Pacific Market Y-o-Y Growth Comparison by Ingredient Type, 2025-2035
  • Figure 95: South Asia & Pacific Market Attractiveness Analysis by Ingredient Type
  • Figure 96: South Asia & Pacific Market Value Share and BPS Analysis by Application, 2025 and 2035
  • Figure 97: South Asia & Pacific Market Y-o-Y Growth Comparison by Application, 2025-2035
  • Figure 98: South Asia & Pacific Market Attractiveness Analysis by Application
  • Figure 99: South Asia & Pacific Market Value Share and BPS Analysis by Form, 2025 and 2035
  • Figure 100: South Asia & Pacific Market Y-o-Y Growth Comparison by Form, 2025-2035
  • Figure 101: South Asia & Pacific Market Attractiveness Analysis by Form
  • Figure 102: South Asia & Pacific Market Value Share and BPS Analysis by Source, 2025 and 2035
  • Figure 103: South Asia & Pacific Market Y-o-Y Growth Comparison by Source, 2025-2035
  • Figure 104: South Asia & Pacific Market Attractiveness Analysis by Source
  • Figure 105: South Asia & Pacific Market Value Share and BPS Analysis by Sales Channel, 2025 and 2035
  • Figure 106: South Asia & Pacific Market Y-o-Y Growth Comparison by Sales Channel, 2025-2035
  • Figure 107: South Asia & Pacific Market Attractiveness Analysis by Sales Channel
  • Figure 108: Middle East and Africa Market Value Share and BPS Analysis by Country, 2025 and 2035
  • Figure 109: Middle East and Africa Market Value Share and BPS Analysis by Ingredient Type, 2025 and 2035
  • Figure 110: Middle East and Africa Market Y-o-Y Growth Comparison by Ingredient Type, 2025-2035
  • Figure 111: Middle East and Africa Market Attractiveness Analysis by Ingredient Type
  • Figure 112: Middle East and Africa Market Value Share and BPS Analysis by Application, 2025 and 2035
  • Figure 113: Middle East and Africa Market Y-o-Y Growth Comparison by Application, 2025-2035
  • Figure 114: Middle East and Africa Market Attractiveness Analysis by Application
  • Figure 115: Middle East and Africa Market Value Share and BPS Analysis by Form, 2025 and 2035
  • Figure 116: Middle East and Africa Market Y-o-Y Growth Comparison by Form, 2025-2035
  • Figure 117: Middle East and Africa Market Attractiveness Analysis by Form
  • Figure 118: Middle East and Africa Market Value Share and BPS Analysis by Source, 2025 and 2035
  • Figure 119: Middle East and Africa Market Y-o-Y Growth Comparison by Source, 2025-2035
  • Figure 120: Middle East and Africa Market Attractiveness Analysis by Source
  • Figure 121: Middle East and Africa Market Value Share and BPS Analysis by Sales Channel, 2025 and 2035
  • Figure 122: Middle East and Africa Market Y-o-Y Growth Comparison by Sales Channel, 2025-2035
  • Figure 123: Middle East and Africa Market Attractiveness Analysis by Sales Channel
  • Figure 124: Global Market - Tier Structure Analysis
  • Figure 125: Global Market - Company Share Analysis

Frequently Asked Questions

How big is the Natural Bitterness Blockers Market in 2025?

The global Natural Bitterness Blockers Market is estimated to be valued at USD 1,780.2 Million 2025.

What will be the size of the Natural Bitterness Blockers Market in 2035?

The market size for the Natural Bitterness Blockers Market is projected to reach USD 3,273.3 Million 2035.

How much will the Natural Bitterness Blockers Market grow between 2025 and 2035?

The Natural Bitterness Blockers Market is expected to grow at a CAGR of 6.3% between 2025 and 2035.

What are the key product types in the Natural Bitterness Blockers Market?

The key product types in the Natural Bitterness Blockers Market are protein-based, lipid-based, carbohydrate-based, and botanical extracts.

Which application segment is expected to contribute a significant share in the Natural Bitterness Blockers Market in 2025?

In terms of application, the food & beverages segment is projected to command 39% share in the Natural Bitterness Blockers Market in 2025.

Explore Similar Insights

Future Market Insights

Natural Bitterness Blockers Market

Chat With

MaRIA

Hi There, I am MaRIA, Your Market Research Intelligence Assistant. How may I help you?