Natural Food Preservatives Market Size and Share Forecast Outlook 2025 to 2035

The Natural Food Preservatives Market is estimated to be valued at USD 661.3 million in 2025 and is projected to reach USD 1375.7 million by 2035, registering a compound annual growth rate (CAGR) of 7.6% over the forecast period.

The Natural Food Preservatives market is experiencing substantial growth driven by increasing consumer demand for clean label products and healthier food options. Rising awareness regarding the adverse effects of synthetic preservatives has encouraged manufacturers to shift towards naturally derived alternatives. The market outlook is supported by continuous innovations in preservative formulations that enhance shelf life while maintaining nutritional and sensory qualities of food.

Growing adoption of natural preservatives is observed across processed and packaged food segments, driven by stringent food safety regulations and government initiatives promoting safe food practices. The trend towards plant-based and minimally processed foods is further contributing to the expansion of the market.

Additionally, advancements in extraction and fermentation technologies have enabled the cost-effective production of natural preservatives at scale, supporting wider commercial adoption As the global food industry emphasizes sustainability and consumer health, the Natural Food Preservatives market is poised for consistent growth across developed and emerging regions.
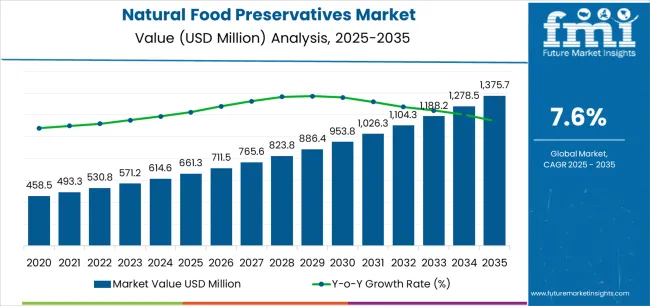
Quick Stats for Natural Food Preservatives Market

  • Natural Food Preservatives Market Industry Value (2025): USD 661.3 million
  • Natural Food Preservatives Market Forecast Value (2035): USD 1375.7 million
  • Natural Food Preservatives Market Forecast CAGR: 7.6%
  • Leading Segment in Natural Food Preservatives Market in 2025: Nisin (23.5%)
  • Key Growth Region in Natural Food Preservatives Market: North America, Asia-Pacific, Europe
  • Top Key Players in Natural Food Preservatives Market: Ajinomoto Co. Inc., ABF Ingredients Ltd., Archer Daniels Midland Company, Albemarle Corporation, Brenntag Inc., Cargill, Incorporated, Celanese Corporation, Sevarome, Jungbunzlauer AG, Kerry Group, Purac Biochem B.V, Royal DSM N.V., Dupont De Nemours & Company, Galactic S.A., Corbion N.V., BASF SE, Akzo Nobel N.V., Tate & Lyle Plc, Kemin Industries
Natural Food Preservatives Market Market Value Analysis
Metric Value
Natural Food Preservatives Market Estimated Value in (2025 E) USD 661.3 million
Natural Food Preservatives Market Forecast Value in (2035 F) USD 1375.7 million
Forecast CAGR (2025 to 2035) 7.6%

Segmental Analysis

The market is segmented by Product Type, Source, and Application and region. By Product Type, the market is divided into Nisin, Natamycin, Polylysine, Natural Acids, Botanical Extracts, Propolis, Cultured Starches, and Chitosan. In terms of Source, the market is classified into Microbial, Plant, Animal, and Mineral. Based on Application, the market is segmented into Bakery, Confectionery, Dairy Products, Soups, Beverages, Snacks, Jams & Spreads, Meat, Fish & Poultry Products, and Sauces & Dressings. Regionally, the market is classified into North America, Latin America, Western Europe, Eastern Europe, Balkan & Baltic Countries, Russia & Belarus, Central Asia, East Asia, South Asia & Pacific, and the Middle East & Africa.
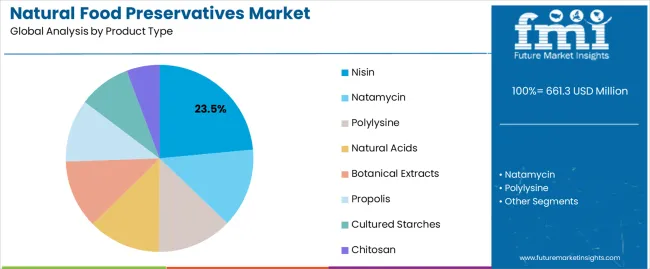
Insights into the Nisin Product Type Segment

Natural Food Preservatives Market Analysis By Product Type

The Nisin product type is projected to hold 23.50% of the Natural Food Preservatives market revenue share in 2025, making it a leading product. This growth is driven by Nisin’s effectiveness in inhibiting the growth of spoilage bacteria and extending the shelf life of various food products. Its natural origin and compatibility with clean label requirements have reinforced its adoption in processed foods.

The segment’s expansion is supported by increasing demand from the dairy, meat, and bakery sectors, where microbial control is critical for quality and safety. Additionally, Nisin’s stability under varying pH and temperature conditions allows its application across a wide range of products, enhancing its commercial utility.

The segment benefits from growing consumer preference for natural ingredients and the regulatory encouragement for non-synthetic additives Continuous advancements in microbial fermentation techniques have also improved the yield and consistency of Nisin, further solidifying its market presence.
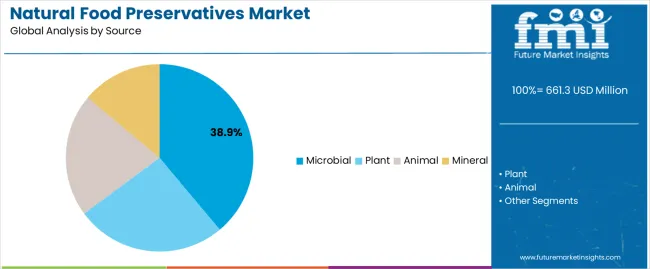
Insights into the Microbial Source Segment

Natural Food Preservatives Market Analysis By Source

The microbial source segment is expected to account for 38.90% of the Natural Food Preservatives market revenue share in 2025. This growth is attributed to the high efficiency and sustainability of preservatives derived from microbial fermentation. Microbially sourced preservatives are recognized for their consistency, potency, and reduced impact on flavor and texture, making them highly suitable for diverse food applications.

Increasing investment in biotechnology and fermentation technologies has expanded production capacities and lowered costs, driving adoption. The rising awareness regarding food safety and consumer preference for naturally produced ingredients is further propelling the growth of microbial preservatives.

Their compatibility with various processing conditions and ability to enhance product shelf life while maintaining nutritional value positions the segment as a key contributor to the market As the demand for clean label and naturally preserved food products continues to grow, the microbial source segment is expected to maintain its leading position.
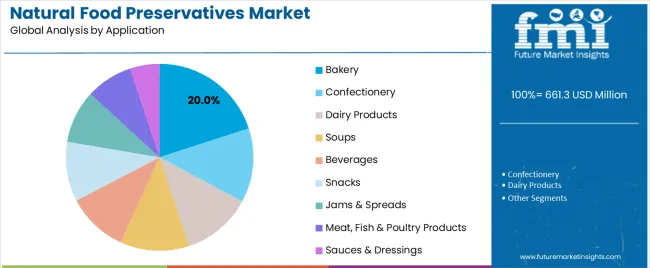
Insights into the Bakery Application Segment

Natural Food Preservatives Market Analysis By Application

The bakery application segment is projected to hold 20.00% of the Natural Food Preservatives market revenue share in 2025. Growth in this segment is driven by the need to extend shelf life and prevent microbial spoilage in bakery products, which are highly susceptible to quality degradation. Natural preservatives provide effective antimicrobial protection while maintaining product taste, texture, and aroma, which is critical for consumer acceptance.

Increasing demand for packaged and ready-to-eat bakery products in urban areas has further reinforced the adoption of natural preservatives. Additionally, the bakery sector’s shift towards clean label and additive-free formulations aligns with consumer preferences, boosting the use of naturally derived preservatives.

Continuous advancements in preservation technologies, coupled with the growing focus on product quality and food safety standards, support the sustained growth of the bakery application segment Manufacturers are increasingly leveraging natural preservatives to meet regulatory requirements and satisfy evolving consumer expectations, making this segment a key driver of market expansion.

Semi Annual Update

Particular Value CAGR
H1 6.7% (2025 to 2035)
H2 6.3% (2025 to 2035)
H1 6.5% (2025 to 2035)
H2 7.4% (2025 to 2035)

The attached chart shows the projected Compound Annual Growth Rate (CAGR) for the global sales for Natural Food Preservatives across a number of semi-annual periods, spanning from 2025 to 2035. Anticipated compound annual growth rate (CAGR) of 6.7%, the industry is anticipated to see a strong upturn in the first half (H1) of the decade, which runs from 2025 to 2035.

In the second half (H2) of the same year, the growth rate is predicted to slightly decrease to 6.3% after that. Moving on to the next phase, which is from H1 2025 to H2 2035, the CAGR is expected to increase 6.5% in the first half and grow of 7.4% in the second half.

Key Industry Highlights

Growing Demand for Clean Label Products

Consumers are increasingly seeking food products with clean labels, meaning they prefer items with minimal, recognizable, and natural ingredients. This trend is driving the demand for natural preservatives derived from plant, animal, and microbial sources.

Extracts from herbs, spices, and fruits (e.g., rosemary, thyme, and citrus) are becoming popular due to their antioxidant and antimicrobial properties.

These natural additives help in extending shelf life without the use of synthetic chemicals. Natural preservatives such as lysozyme (derived from egg whites) and lactoferrin (found in milk) are gaining traction for their effectiveness in inhibiting bacterial growth.

Bacteriocins produced by certain bacteria, like nisin and natamycin, are increasingly used in food preservation. These natural antimicrobial agents are effective against a broad spectrum of pathogens and spoilage organisms.

Technological Advancements in Extraction and Application Methods

Advancements in technology are enhancing the efficiency and effectiveness of natural food preservatives. Innovations in extraction methods and application techniques are making plant, animal, and microbial-based preservatives more viable and appealing to the food industry.

Advanced extraction methods such as supercritical fluid extraction and nanoencapsulation are improving the stability and potency of plant-based preservatives. Improved purification and formulation technologies are enhancing the functionality of animal-derived preservatives. Techniques like microencapsulation help in controlling the release of active compounds, improving their efficacy and stability.

Regulatory Support and Consumer Education

Regulatory bodies and consumer education initiatives are playing a crucial role in the adoption of natural food preservatives. Increased regulatory support for natural ingredients and growing awareness about the health benefits of natural preservatives are driving growth. Regulatory approvals for plant extracts and essential oils as food preservatives are expanding.

Organizations such as the FDA and EFSA are recognizing the safety and efficacy of these natural compounds, facilitating their use in the food industry. Increased research and positive regulatory evaluations are boosting the acceptance of microbial-based preservatives. Educational initiatives are informing consumers about the safety and benefits of these natural antimicrobials which is leading to more acceptance and demand.

2020 to 2024 Global Natural Food Preservatives Sales Analysis Compared to Demand Forecasts for 2025 to 2035

Global demand for natural food preservatives increased significantly between 2020 and 2025 as a result of rising consumer knowledge about ingredients such as Nisin, Natamycin, Polylysine and Botanical Extracts.

CAGR for last five years was 6.8%. Demand for plant, animal, and microbiological-based preservatives has surged as a result of food manufactures are searching for natural options in response to consumers' shift to healthier and cleaner eating habits.

Enhancing the effectiveness and attractiveness of natural preservatives has also been made possible by technological developments in formulation and extraction. Furthermore, consumer confidence has been reinforced by governmental support and certification for natural ingredients, which has further accelerated industry expansion.

It is projected that from 2025 to 2035, the market for natural food preservatives would continue to grow. The clean label movement and consumers' growing awareness with regard to comes to ingredient lists are driving growth in the natural preservative market.

More research and development funding along with advancements in preservation methods should result in a wider range of natural preservative options that are both more potent and more varied.

Furthermore, the combination of natural preservatives into mainstream food products will increase in popularity as food producers work to meet strict regulatory requirements and consumer expectations, which will fuel strong market expansion throughout the projection period.
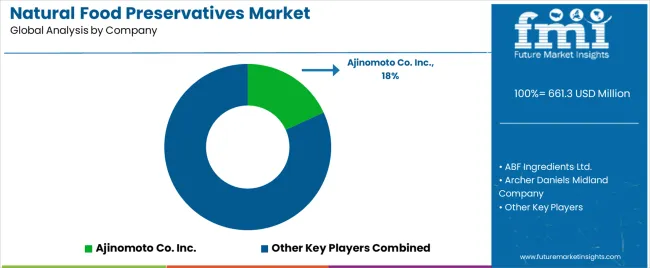
Market Concentration

Natural Food Preservatives Market Analysis By Company

Tier 1 companies in the preservative industry are typically large, multinational corporations with extensive resources and advanced research and development capabilities. Despite their significant influence and extensive distribution networks, these companies hold only 25-30% of the overall market share due to the fragmented nature of the industry.

Their focus is often on innovation and the development of high-quality, reliable preservatives that meet stringent regulatory standards.

Tier 1 companies include Ajinomoto Co. Inc., Archer Daniels Midland Company, Albemarle Corporation, Brenntag Inc., Cargill, Incorporated, Celanese Corporation, Sevarome, Jungbunzlauer AG, Kerry Group, Purac Biochem B.V, Royal DSM N.V., Dupont De Nemours & Company, Galactic S.A., Corbion N.V., BASF SE, Akzo Nobel N.V., Tate & Lyle Plc, Kemin Industries

Tier 2 companies represent a substantial portion of the market, accounting for 50-55%% of the overall share. They are well-positioned to adapt to changing consumer preferences and regulatory requirements, offering a diverse range of products that cater to local and regional needs.

These companies typically combine a strong understanding of market demands with innovative approaches, allowing them to effectively compete against larger corporations and maintain a significant presence in the market.

Tier 3 companies are local and regional producers that play a crucial role in the preservative industry. These smaller enterprises often have deep ties to their communities and a thorough understanding of local market dynamics. They can quickly respond to regional trends and demands, providing customized solutions that larger companies might overlook.

Country-wise Insights

The following table shows the estimated growth rates of the Natural Food Preservatives Industry. India and the Japan are set to exhibit target markets, recording CAGRs of 7.8% and 6.8%, respectively, through 2035.

Countries CAGR (2035)
USA 6.0%
India 7.8%
China 6.0%
Germany 5.8%
Japan 6.8%

Growth of Natural Food Preservatives Market in the USA

The USA is experiencing a CAGR of 6.0% in the natural food preservatives, driven by the growing popularity of healthy snacking options among the working population. Changing lifestyles, urbanization, and hectic work schedules have fuelled the demand for convenient and nutritious snack choices.

Lentils, known for stabilizing emulsions, are pivotal in the formulation of various novel foods such as sausages, bologna, meat analogs, cakes, and soups. Meat analogs, which mimic the texture, flavor, and appearance of meat using non-meat ingredients, have gained traction as consumers seek plant-based alternatives.

The convenience factor significantly influences food purchasing decisions, prompting increased use of preservatives in meat and dairy alternatives. This trend is driving the demand for natural food preservatives in the USA, reflecting a broader shift towards healthier and more sustainable food options.

Growing Demand for Antioxidant-based Preservatives in Japan

In Japan, there is a burgeoning demand for antioxidant-based preservatives amidst the global trend. Industrialized economies, including Japan, are recognizing the growth potential of natural preservatives like rosemary extract. Antioxidants are extensively employed in the food and beverage sector to extend shelf life.

As the global population expands, sectors such as pharmaceuticals and animal feed are expected to witness heightened demand for antioxidant applications. In the Asia-Pacific region, including Japan, there is a notable demand for antioxidant supplements due to prevalent cases of under-nutrition.

Additionally, farmers are incentivized to incorporate antioxidant-rich feed, such as hay, to enhance cattle health and milk yield. This holistic approach underscores the multifaceted growth prospects for antioxidant-based preservatives in Japan's evolving landscape.

Increasing Demand for Packaged Drinks & Beverages in India

In India, there is a growing demand for packaged drinks and beverages, driven by the convenience. Ready-to-drink (RTD) beverages are particularly favored for their convenience and portability.

This category encompasses both refrigerated and shelf-stable beverages, with a notable preference for shelf-stable products due to their ease of distribution and storage in India's diverse climate and logistical landscape.

Natural antimicrobial solutions are gaining popularity in the Indian RTD beverage industry for their superior antimicrobial and antioxidative properties. These solutions are preferred for their ease of digestibility and unique functional benefits within beverage systems.

As consumer preferences increasingly lean towards healthier and more natural ingredients, the demand for beverages preserved with natural antimicrobials is expected to rise significantly in India.

Category-Wise Insights

Nisin to hold dominating value share

Segment Product types - Nisin
Value Share (2025) 23.5%

Nisin is poised to hold a significant value share of 23.5% in the product types segment by 2025. Nisin is a natural antimicrobial agent derived from bacteria and is highly effective against a broad spectrum of bacteria, particularly those responsible for food spoilage. Its ability to inhibit bacterial growth at low concentrations makes it a preferred choice in food preservation.

With increasing consumer awareness and regulatory pressures favoring natural food ingredients, there is a growing preference for preservatives like nisin over synthetic alternatives. Nisin aligns well with consumer preferences for clean-label products and manufacturers' efforts to meet clean-label trends.

Nisin has use in a wide range of food products, including dairy, meat, beverages, and canned foods. Its versatility and compatibility with various food matrices make it a versatile option for food manufacturers seeking effective preservation solutions.

Microbial Source to have Leading Value Share

Segment Source - Microbial
Value Share (2025) 38.9%

The integration of Natural Food Preservatives across the food and beverage industry is reshaping Microbial preservatives, such as nisin and natamycin, are highly effective in inhibiting a broad spectrum of spoilage and pathogenic microorganisms.

Their superior antimicrobial properties ensure the extended shelf life and safety of food products, making them a preferred choice for food manufacturers. As consumer demand shifts towards natural and clean-label products, microbial preservatives are increasingly favored over synthetic chemicals.

Derived from natural microbial processes, these preservatives are perceived as safer and more environmentally friendly, aligning with the growing health and sustainability trends.

Microbial preservatives are versatile and can be used in a wide range of food products, including dairy, meat, beverages, and baked goods. Their broad-spectrum activity and compatibility with various food matrices enhance their utility and adoption across diverse food industries.

Competition Outlook

The food preservatives industry is characterized by intense competition among key players and a diverse landscape of emerging and established companies. Here’s an assessment of the competitive dynamics. The market is fragmented with a mix of large multinational corporations, mid-sized companies, and numerous small-scale regional players.

This fragmentation is driven by the diverse needs of global and local markets, regulatory variations, and consumer preferences for specific types of preservatives. Tier 1 companies, such as major multinational corporations, hold a significant but not dominating share due to the market’s fragmentation.

These players leverage extensive R&D capabilities, global distribution networks, and brand recognition to maintain their competitive edge. Examples include Kerry Group, DuPont de Nemours, Inc., and DSM.

Tier 2 and Tier 3 companies comprise a substantial portion is, focusing on niche markets, specific product types, or regional preferences. These companies often emphasize innovation, flexibility, and responsiveness to local regulatory requirements and consumer trends.

They contribute to diversity and competitive pricing strategies. Competitive differentiation revolves around product innovation and development of novel preservative solutions.

Companies are investing in research to enhance the efficacy, stability, and safety profiles of preservatives while meeting clean-label and sustainability demands. Innovations in natural preservatives derived from plant extracts, microbial sources, and antioxidants are gaining traction.

Increasing consumer awareness of health and sustainability is reshaping competitive strategies. Companies that can offer clean-label products with natural, sustainable, and environmentally friendly preservatives are gaining competitive advantage.

Leading Natural Food Preservatives Brands

  • Ajinomoto Co. Inc.
  • Archer Daniels Midland Company
  • Albemarle Corporation
  • Brenntag Inc.
  • Cargill, Incorporated
  • Celanese Corporation
  • Sevarome
  • Jungbunzlauer AG
  • Kerry Group
  • Purac Biochem B.V
  • Royal DSM N.V.
  • Dupont De Nemours & Company
  • Galactic S.A.
  • Corbion N.V.
  • BASF SE
  • Akzo Nobel N.V.
  • Tate & Lyle Plc
  • Kemin Industries

Key Segments of Report

By Product Type:

As per product type, the industry has been categorized into Nisin, Natamycin, Polylysine, Natural Acids, Botanical Extracts, Propolis, Cultured starches and Chitosan

By Source:

As per Source, the industry has been categorized into Plant, Animal, Microbial and Mineral

By Application:

As per the application, the industry is sub-segmented into Bakery, Confectionery, Dairy Products, Soups, Beverages, Snacks, Jams & Spreads, Meat, Fish & Poultry Products, Sauces & Dressings

By Region:

Industry analysis has been carried out in key countries of the regions such as North America, Latin America, Europe, East Asia, South Asia, Oceania, and the Middle East & Africa.

Frequently Asked Questions

How big is the natural food preservatives market in 2025?

The global natural food preservatives market is estimated to be valued at USD 661.3 million in 2025.

What will be the size of natural food preservatives market in 2035?

The market size for the natural food preservatives market is projected to reach USD 1,375.7 million by 2035.

How much will be the natural food preservatives market growth between 2025 and 2035?

The natural food preservatives market is expected to grow at a 7.6% CAGR between 2025 and 2035.

What are the key product types in the natural food preservatives market?

The key product types in natural food preservatives market are nisin, natamycin, polylysine, natural acids, botanical extracts, propolis, cultured starches and chitosan.

Which source segment to contribute significant share in the natural food preservatives market in 2025?

In terms of source, microbial segment to command 38.9% share in the natural food preservatives market in 2025.

Table of Content

  1. Executive Summary
    • Global Market Outlook
    • Demand-side Trends
    • Supply-side Trends
    • Technology Roadmap Analysis
    • Analysis and Recommendations
  2. Market Overview
    • Market Coverage / Taxonomy
    • Market Definition / Scope / Limitations
  3. Market Background
    • Market Dynamics
      • Drivers
      • Restraints
      • Opportunity
      • Trends
    • Scenario Forecast
      • Demand in Optimistic Scenario
      • Demand in Likely Scenario
      • Demand in Conservative Scenario
    • Opportunity Map Analysis
    • Product Life Cycle Analysis
    • Supply Chain Analysis
    • Investment Feasibility Matrix
    • Value Chain Analysis
    • PESTLE and Porter’s Analysis
    • Regulatory Landscape
    • Regional Parent Market Outlook
    • Production and Consumption Statistics
    • Import and Export Statistics
  4. Global Market Analysis 2020 to 2024 and Forecast, 2025 to 2035
    • Historical Market Size Value (USD Million) Analysis, 2020 to 2024
    • Current and Future Market Size Value (USD Million) Projections, 2025 to 2035
      • Y-o-Y Growth Trend Analysis
      • Absolute $ Opportunity Analysis
  5. Global Market Pricing Analysis 2020 to 2024 and Forecast 2025 to 2035
  6. Global Market Analysis 2020 to 2024 and Forecast 2025 to 2035, By Product Type
    • Introduction / Key Findings
    • Historical Market Size Value (USD Million) Analysis By Product Type , 2020 to 2024
    • Current and Future Market Size Value (USD Million) Analysis and Forecast By Product Type , 2025 to 2035
      • Nisin
      • Natamycin
      • Polylysine
      • Natural Acids
      • Botanical Extracts
      • Propolis
      • Cultured Starches
      • Chitosan
    • Y-o-Y Growth Trend Analysis By Product Type , 2020 to 2024
    • Absolute $ Opportunity Analysis By Product Type , 2025 to 2035
  7. Global Market Analysis 2020 to 2024 and Forecast 2025 to 2035, By Source
    • Introduction / Key Findings
    • Historical Market Size Value (USD Million) Analysis By Source, 2020 to 2024
    • Current and Future Market Size Value (USD Million) Analysis and Forecast By Source, 2025 to 2035
      • Microbial
      • Plant
      • Animal
      • Mineral
    • Y-o-Y Growth Trend Analysis By Source, 2020 to 2024
    • Absolute $ Opportunity Analysis By Source, 2025 to 2035
  8. Global Market Analysis 2020 to 2024 and Forecast 2025 to 2035, By Application
    • Introduction / Key Findings
    • Historical Market Size Value (USD Million) Analysis By Application, 2020 to 2024
    • Current and Future Market Size Value (USD Million) Analysis and Forecast By Application, 2025 to 2035
      • Bakery
      • Confectionery
      • Dairy Products
      • Soups
      • Beverages
      • Snacks
      • Jams & Spreads
      • Meat, Fish & Poultry Products
      • Sauces & Dressings
    • Y-o-Y Growth Trend Analysis By Application, 2020 to 2024
    • Absolute $ Opportunity Analysis By Application, 2025 to 2035
  9. Global Market Analysis 2020 to 2024 and Forecast 2025 to 2035, By Region
    • Introduction
    • Historical Market Size Value (USD Million) Analysis By Region, 2020 to 2024
    • Current Market Size Value (USD Million) Analysis and Forecast By Region, 2025 to 2035
      • North America
      • Latin America
      • Western Europe
      • Eastern Europe
      • East Asia
      • South Asia and Pacific
      • Middle East & Africa
    • Market Attractiveness Analysis By Region
  10. North America Market Analysis 2020 to 2024 and Forecast 2025 to 2035, By Country
    • Historical Market Size Value (USD Million) Trend Analysis By Market Taxonomy, 2020 to 2024
    • Market Size Value (USD Million) Forecast By Market Taxonomy, 2025 to 2035
      • By Country
        • USA
        • Canada
        • Mexico
      • By Product Type
      • By Source
      • By Application
    • Market Attractiveness Analysis
      • By Country
      • By Product Type
      • By Source
      • By Application
    • Key Takeaways
  11. Latin America Market Analysis 2020 to 2024 and Forecast 2025 to 2035, By Country
    • Historical Market Size Value (USD Million) Trend Analysis By Market Taxonomy, 2020 to 2024
    • Market Size Value (USD Million) Forecast By Market Taxonomy, 2025 to 2035
      • By Country
        • Brazil
        • Chile
        • Rest of Latin America
      • By Product Type
      • By Source
      • By Application
    • Market Attractiveness Analysis
      • By Country
      • By Product Type
      • By Source
      • By Application
    • Key Takeaways
  12. Western Europe Market Analysis 2020 to 2024 and Forecast 2025 to 2035, By Country
    • Historical Market Size Value (USD Million) Trend Analysis By Market Taxonomy, 2020 to 2024
    • Market Size Value (USD Million) Forecast By Market Taxonomy, 2025 to 2035
      • By Country
        • Germany
        • UK
        • Italy
        • Spain
        • France
        • Nordic
        • BENELUX
        • Rest of Western Europe
      • By Product Type
      • By Source
      • By Application
    • Market Attractiveness Analysis
      • By Country
      • By Product Type
      • By Source
      • By Application
    • Key Takeaways
  13. Eastern Europe Market Analysis 2020 to 2024 and Forecast 2025 to 2035, By Country
    • Historical Market Size Value (USD Million) Trend Analysis By Market Taxonomy, 2020 to 2024
    • Market Size Value (USD Million) Forecast By Market Taxonomy, 2025 to 2035
      • By Country
        • Russia
        • Poland
        • Hungary
        • Balkan & Baltic
        • Rest of Eastern Europe
      • By Product Type
      • By Source
      • By Application
    • Market Attractiveness Analysis
      • By Country
      • By Product Type
      • By Source
      • By Application
    • Key Takeaways
  14. East Asia Market Analysis 2020 to 2024 and Forecast 2025 to 2035, By Country
    • Historical Market Size Value (USD Million) Trend Analysis By Market Taxonomy, 2020 to 2024
    • Market Size Value (USD Million) Forecast By Market Taxonomy, 2025 to 2035
      • By Country
        • China
        • Japan
        • South Korea
      • By Product Type
      • By Source
      • By Application
    • Market Attractiveness Analysis
      • By Country
      • By Product Type
      • By Source
      • By Application
    • Key Takeaways
  15. South Asia and Pacific Market Analysis 2020 to 2024 and Forecast 2025 to 2035, By Country
    • Historical Market Size Value (USD Million) Trend Analysis By Market Taxonomy, 2020 to 2024
    • Market Size Value (USD Million) Forecast By Market Taxonomy, 2025 to 2035
      • By Country
        • India
        • ASEAN
        • Australia & New Zealand
        • Rest of South Asia and Pacific
      • By Product Type
      • By Source
      • By Application
    • Market Attractiveness Analysis
      • By Country
      • By Product Type
      • By Source
      • By Application
    • Key Takeaways
  16. Middle East & Africa Market Analysis 2020 to 2024 and Forecast 2025 to 2035, By Country
    • Historical Market Size Value (USD Million) Trend Analysis By Market Taxonomy, 2020 to 2024
    • Market Size Value (USD Million) Forecast By Market Taxonomy, 2025 to 2035
      • By Country
        • Kingdom of Saudi Arabia
        • Other GCC Countries
        • Turkiye
        • South Africa
        • Other African Union
        • Rest of Middle East & Africa
      • By Product Type
      • By Source
      • By Application
    • Market Attractiveness Analysis
      • By Country
      • By Product Type
      • By Source
      • By Application
    • Key Takeaways
  17. Key Countries Market Analysis
    • USA
      • Pricing Analysis
      • Market Share Analysis, 2024
        • By Product Type
        • By Source
        • By Application
    • Canada
      • Pricing Analysis
      • Market Share Analysis, 2024
        • By Product Type
        • By Source
        • By Application
    • Mexico
      • Pricing Analysis
      • Market Share Analysis, 2024
        • By Product Type
        • By Source
        • By Application
    • Brazil
      • Pricing Analysis
      • Market Share Analysis, 2024
        • By Product Type
        • By Source
        • By Application
    • Chile
      • Pricing Analysis
      • Market Share Analysis, 2024
        • By Product Type
        • By Source
        • By Application
    • Germany
      • Pricing Analysis
      • Market Share Analysis, 2024
        • By Product Type
        • By Source
        • By Application
    • UK
      • Pricing Analysis
      • Market Share Analysis, 2024
        • By Product Type
        • By Source
        • By Application
    • Italy
      • Pricing Analysis
      • Market Share Analysis, 2024
        • By Product Type
        • By Source
        • By Application
    • Spain
      • Pricing Analysis
      • Market Share Analysis, 2024
        • By Product Type
        • By Source
        • By Application
    • France
      • Pricing Analysis
      • Market Share Analysis, 2024
        • By Product Type
        • By Source
        • By Application
    • India
      • Pricing Analysis
      • Market Share Analysis, 2024
        • By Product Type
        • By Source
        • By Application
    • ASEAN
      • Pricing Analysis
      • Market Share Analysis, 2024
        • By Product Type
        • By Source
        • By Application
    • Australia & New Zealand
      • Pricing Analysis
      • Market Share Analysis, 2024
        • By Product Type
        • By Source
        • By Application
    • China
      • Pricing Analysis
      • Market Share Analysis, 2024
        • By Product Type
        • By Source
        • By Application
    • Japan
      • Pricing Analysis
      • Market Share Analysis, 2024
        • By Product Type
        • By Source
        • By Application
    • South Korea
      • Pricing Analysis
      • Market Share Analysis, 2024
        • By Product Type
        • By Source
        • By Application
    • Russia
      • Pricing Analysis
      • Market Share Analysis, 2024
        • By Product Type
        • By Source
        • By Application
    • Poland
      • Pricing Analysis
      • Market Share Analysis, 2024
        • By Product Type
        • By Source
        • By Application
    • Hungary
      • Pricing Analysis
      • Market Share Analysis, 2024
        • By Product Type
        • By Source
        • By Application
    • Kingdom of Saudi Arabia
      • Pricing Analysis
      • Market Share Analysis, 2024
        • By Product Type
        • By Source
        • By Application
    • Turkiye
      • Pricing Analysis
      • Market Share Analysis, 2024
        • By Product Type
        • By Source
        • By Application
    • South Africa
      • Pricing Analysis
      • Market Share Analysis, 2024
        • By Product Type
        • By Source
        • By Application
  18. Market Structure Analysis
    • Competition Dashboard
    • Competition Benchmarking
    • Market Share Analysis of Top Players
      • By Regional
      • By Product Type
      • By Source
      • By Application
  19. Competition Analysis
    • Competition Deep Dive
      • Ajinomoto Co. Inc.
        • Overview
        • Product Portfolio
        • Profitability by Market Segments (Product/Age /Sales Channel/Region)
        • Sales Footprint
        • Strategy Overview
          • Marketing Strategy
          • Product Strategy
          • Channel Strategy
      • ABF Ingredients Ltd.
      • Archer Daniels Midland Company
      • Albemarle Corporation, Brenntag Inc.
      • Cargill, Incorporated, Celanese Corporation
      • Sevarome
      • Jungbunzlauer AG
      • Kerry Group
      • Purac Biochem B.V
      • Royal DSM N.V.
      • Dupont De Nemours & Company
      • Galactic S.A.
      • Corbion N.V.
      • BASF SE
      • Akzo Nobel N.V.
      • Tate & Lyle Plc
      • Kemin Industries
  20. Assumptions & Acronyms Used
  21. Research Methodology

List of Tables

  • Table 1: Global Market Value (USD Million) Forecast by Region, 2020 to 2035
  • Table 2: Global Market Value (USD Million) Forecast by Product Type , 2020 to 2035
  • Table 3: Global Market Value (USD Million) Forecast by Source, 2020 to 2035
  • Table 4: Global Market Value (USD Million) Forecast by Application, 2020 to 2035
  • Table 5: North America Market Value (USD Million) Forecast by Country, 2020 to 2035
  • Table 6: North America Market Value (USD Million) Forecast by Product Type , 2020 to 2035
  • Table 7: North America Market Value (USD Million) Forecast by Source, 2020 to 2035
  • Table 8: North America Market Value (USD Million) Forecast by Application, 2020 to 2035
  • Table 9: Latin America Market Value (USD Million) Forecast by Country, 2020 to 2035
  • Table 10: Latin America Market Value (USD Million) Forecast by Product Type , 2020 to 2035
  • Table 11: Latin America Market Value (USD Million) Forecast by Source, 2020 to 2035
  • Table 12: Latin America Market Value (USD Million) Forecast by Application, 2020 to 2035
  • Table 13: Western Europe Market Value (USD Million) Forecast by Country, 2020 to 2035
  • Table 14: Western Europe Market Value (USD Million) Forecast by Product Type , 2020 to 2035
  • Table 15: Western Europe Market Value (USD Million) Forecast by Source, 2020 to 2035
  • Table 16: Western Europe Market Value (USD Million) Forecast by Application, 2020 to 2035
  • Table 17: Eastern Europe Market Value (USD Million) Forecast by Country, 2020 to 2035
  • Table 18: Eastern Europe Market Value (USD Million) Forecast by Product Type , 2020 to 2035
  • Table 19: Eastern Europe Market Value (USD Million) Forecast by Source, 2020 to 2035
  • Table 20: Eastern Europe Market Value (USD Million) Forecast by Application, 2020 to 2035
  • Table 21: East Asia Market Value (USD Million) Forecast by Country, 2020 to 2035
  • Table 22: East Asia Market Value (USD Million) Forecast by Product Type , 2020 to 2035
  • Table 23: East Asia Market Value (USD Million) Forecast by Source, 2020 to 2035
  • Table 24: East Asia Market Value (USD Million) Forecast by Application, 2020 to 2035
  • Table 25: South Asia and Pacific Market Value (USD Million) Forecast by Country, 2020 to 2035
  • Table 26: South Asia and Pacific Market Value (USD Million) Forecast by Product Type , 2020 to 2035
  • Table 27: South Asia and Pacific Market Value (USD Million) Forecast by Source, 2020 to 2035
  • Table 28: South Asia and Pacific Market Value (USD Million) Forecast by Application, 2020 to 2035
  • Table 29: Middle East & Africa Market Value (USD Million) Forecast by Country, 2020 to 2035
  • Table 30: Middle East & Africa Market Value (USD Million) Forecast by Product Type , 2020 to 2035
  • Table 31: Middle East & Africa Market Value (USD Million) Forecast by Source, 2020 to 2035
  • Table 32: Middle East & Africa Market Value (USD Million) Forecast by Application, 2020 to 2035

List of Figures

  • Figure 1: Global Market Pricing Analysis
  • Figure 2: Global Market Value (USD Million) Forecast 2020-2035
  • Figure 3: Global Market Value Share and BPS Analysis by Product Type , 2025 and 2035
  • Figure 4: Global Market Y-o-Y Growth Comparison by Product Type , 2025-2035
  • Figure 5: Global Market Attractiveness Analysis by Product Type
  • Figure 6: Global Market Value Share and BPS Analysis by Source, 2025 and 2035
  • Figure 7: Global Market Y-o-Y Growth Comparison by Source, 2025-2035
  • Figure 8: Global Market Attractiveness Analysis by Source
  • Figure 9: Global Market Value Share and BPS Analysis by Application, 2025 and 2035
  • Figure 10: Global Market Y-o-Y Growth Comparison by Application, 2025-2035
  • Figure 11: Global Market Attractiveness Analysis by Application
  • Figure 12: Global Market Value (USD Million) Share and BPS Analysis by Region, 2025 and 2035
  • Figure 13: Global Market Y-o-Y Growth Comparison by Region, 2025-2035
  • Figure 14: Global Market Attractiveness Analysis by Region
  • Figure 15: North America Market Incremental Dollar Opportunity, 2025-2035
  • Figure 16: Latin America Market Incremental Dollar Opportunity, 2025-2035
  • Figure 17: Western Europe Market Incremental Dollar Opportunity, 2025-2035
  • Figure 18: Eastern Europe Market Incremental Dollar Opportunity, 2025-2035
  • Figure 19: East Asia Market Incremental Dollar Opportunity, 2025-2035
  • Figure 20: South Asia and Pacific Market Incremental Dollar Opportunity, 2025-2035
  • Figure 21: Middle East & Africa Market Incremental Dollar Opportunity, 2025-2035
  • Figure 22: North America Market Value Share and BPS Analysis by Country, 2025 and 2035
  • Figure 23: North America Market Value Share and BPS Analysis by Product Type , 2025 and 2035
  • Figure 24: North America Market Y-o-Y Growth Comparison by Product Type , 2025-2035
  • Figure 25: North America Market Attractiveness Analysis by Product Type
  • Figure 26: North America Market Value Share and BPS Analysis by Source, 2025 and 2035
  • Figure 27: North America Market Y-o-Y Growth Comparison by Source, 2025-2035
  • Figure 28: North America Market Attractiveness Analysis by Source
  • Figure 29: North America Market Value Share and BPS Analysis by Application, 2025 and 2035
  • Figure 30: North America Market Y-o-Y Growth Comparison by Application, 2025-2035
  • Figure 31: North America Market Attractiveness Analysis by Application
  • Figure 32: Latin America Market Value Share and BPS Analysis by Country, 2025 and 2035
  • Figure 33: Latin America Market Value Share and BPS Analysis by Product Type , 2025 and 2035
  • Figure 34: Latin America Market Y-o-Y Growth Comparison by Product Type , 2025-2035
  • Figure 35: Latin America Market Attractiveness Analysis by Product Type
  • Figure 36: Latin America Market Value Share and BPS Analysis by Source, 2025 and 2035
  • Figure 37: Latin America Market Y-o-Y Growth Comparison by Source, 2025-2035
  • Figure 38: Latin America Market Attractiveness Analysis by Source
  • Figure 39: Latin America Market Value Share and BPS Analysis by Application, 2025 and 2035
  • Figure 40: Latin America Market Y-o-Y Growth Comparison by Application, 2025-2035
  • Figure 41: Latin America Market Attractiveness Analysis by Application
  • Figure 42: Western Europe Market Value Share and BPS Analysis by Country, 2025 and 2035
  • Figure 43: Western Europe Market Value Share and BPS Analysis by Product Type , 2025 and 2035
  • Figure 44: Western Europe Market Y-o-Y Growth Comparison by Product Type , 2025-2035
  • Figure 45: Western Europe Market Attractiveness Analysis by Product Type
  • Figure 46: Western Europe Market Value Share and BPS Analysis by Source, 2025 and 2035
  • Figure 47: Western Europe Market Y-o-Y Growth Comparison by Source, 2025-2035
  • Figure 48: Western Europe Market Attractiveness Analysis by Source
  • Figure 49: Western Europe Market Value Share and BPS Analysis by Application, 2025 and 2035
  • Figure 50: Western Europe Market Y-o-Y Growth Comparison by Application, 2025-2035
  • Figure 51: Western Europe Market Attractiveness Analysis by Application
  • Figure 52: Eastern Europe Market Value Share and BPS Analysis by Country, 2025 and 2035
  • Figure 53: Eastern Europe Market Value Share and BPS Analysis by Product Type , 2025 and 2035
  • Figure 54: Eastern Europe Market Y-o-Y Growth Comparison by Product Type , 2025-2035
  • Figure 55: Eastern Europe Market Attractiveness Analysis by Product Type
  • Figure 56: Eastern Europe Market Value Share and BPS Analysis by Source, 2025 and 2035
  • Figure 57: Eastern Europe Market Y-o-Y Growth Comparison by Source, 2025-2035
  • Figure 58: Eastern Europe Market Attractiveness Analysis by Source
  • Figure 59: Eastern Europe Market Value Share and BPS Analysis by Application, 2025 and 2035
  • Figure 60: Eastern Europe Market Y-o-Y Growth Comparison by Application, 2025-2035
  • Figure 61: Eastern Europe Market Attractiveness Analysis by Application
  • Figure 62: East Asia Market Value Share and BPS Analysis by Country, 2025 and 2035
  • Figure 63: East Asia Market Value Share and BPS Analysis by Product Type , 2025 and 2035
  • Figure 64: East Asia Market Y-o-Y Growth Comparison by Product Type , 2025-2035
  • Figure 65: East Asia Market Attractiveness Analysis by Product Type
  • Figure 66: East Asia Market Value Share and BPS Analysis by Source, 2025 and 2035
  • Figure 67: East Asia Market Y-o-Y Growth Comparison by Source, 2025-2035
  • Figure 68: East Asia Market Attractiveness Analysis by Source
  • Figure 69: East Asia Market Value Share and BPS Analysis by Application, 2025 and 2035
  • Figure 70: East Asia Market Y-o-Y Growth Comparison by Application, 2025-2035
  • Figure 71: East Asia Market Attractiveness Analysis by Application
  • Figure 72: South Asia and Pacific Market Value Share and BPS Analysis by Country, 2025 and 2035
  • Figure 73: South Asia and Pacific Market Value Share and BPS Analysis by Product Type , 2025 and 2035
  • Figure 74: South Asia and Pacific Market Y-o-Y Growth Comparison by Product Type , 2025-2035
  • Figure 75: South Asia and Pacific Market Attractiveness Analysis by Product Type
  • Figure 76: South Asia and Pacific Market Value Share and BPS Analysis by Source, 2025 and 2035
  • Figure 77: South Asia and Pacific Market Y-o-Y Growth Comparison by Source, 2025-2035
  • Figure 78: South Asia and Pacific Market Attractiveness Analysis by Source
  • Figure 79: South Asia and Pacific Market Value Share and BPS Analysis by Application, 2025 and 2035
  • Figure 80: South Asia and Pacific Market Y-o-Y Growth Comparison by Application, 2025-2035
  • Figure 81: South Asia and Pacific Market Attractiveness Analysis by Application
  • Figure 82: Middle East & Africa Market Value Share and BPS Analysis by Country, 2025 and 2035
  • Figure 83: Middle East & Africa Market Value Share and BPS Analysis by Product Type , 2025 and 2035
  • Figure 84: Middle East & Africa Market Y-o-Y Growth Comparison by Product Type , 2025-2035
  • Figure 85: Middle East & Africa Market Attractiveness Analysis by Product Type
  • Figure 86: Middle East & Africa Market Value Share and BPS Analysis by Source, 2025 and 2035
  • Figure 87: Middle East & Africa Market Y-o-Y Growth Comparison by Source, 2025-2035
  • Figure 88: Middle East & Africa Market Attractiveness Analysis by Source
  • Figure 89: Middle East & Africa Market Value Share and BPS Analysis by Application, 2025 and 2035
  • Figure 90: Middle East & Africa Market Y-o-Y Growth Comparison by Application, 2025-2035
  • Figure 91: Middle East & Africa Market Attractiveness Analysis by Application
  • Figure 92: Global Market - Tier Structure Analysis
  • Figure 93: Global Market - Company Share Analysis
Dashboard
Dashboard
Dashboard
Dashboard
Dashboard
Dashboard

Full Research Suite comprises of:

Market outlook & trends analysis

Market outlook & trends analysis

Interviews & case studies

Interviews & case studies

Strategic recommendations

Strategic recommendations

Vendor profiles & capabilities analysis

Vendor profiles & capabilities analysis

5-year forecasts

5-year forecasts

8 regions and 60+ country-level data splits

8 regions and 60+ country-level data splits

Market segment data splits

Market segment data splits

12 months of continuous data updates

12 months of continuous data updates

DELIVERED AS:

PDF EXCEL ONLINE

Full Research Suite


$3500

$5000

$6500

Buy Report Now
Similar Industry Reports

Similar Industry Reports

Natural Food and Beverage Preservatives Market

Natural Food and Beverage Preservatives Market Size and Share Forecast Outlook 2025 to 2035

Natural Antioxidant Market

Natural Antioxidant Market Size and Share Forecast Outlook 2025 to 2035

Natural Disaster Detection IoT Market

Natural Disaster Detection IoT Market Forecast Outlook 2025 to 2035

Natural Cosmetic Color Market

Natural Cosmetic Color Market Size and Share Forecast Outlook 2025 to 2035

Natural Polymer Market

Natural Polymer Market Size and Share Forecast Outlook 2025 to 2035

Natural Gas Analyzers Market

Natural Gas Analyzers Market Size and Share Forecast Outlook 2025 to 2035

Natural Mineral Oil Coolant Market

Natural Mineral Oil Coolant Market Size and Share Forecast Outlook 2025 to 2035

Natural Synthetic Cytokinin (Anti-zeatin Riboside) Market

Natural Synthetic Cytokinin (Anti-zeatin Riboside) Market Size and Share Forecast Outlook 2025 to 2035

Natural Silicone Alternative Market

Natural Silicone Alternative Market Analysis - Size and Share Forecast Outlook 2025 to 2035

Natural Surfactant Market

Natural Surfactant Market Size and Share Forecast Outlook 2025 to 2035

Natural Bitterness Blockers Market

Natural Bitterness Blockers Market Analysis - Size And Share Forecast Outlook 2025 To 2035

Natural Refrigerants Market

Natural Refrigerants Market Size and Share Forecast Outlook 2025 to 2035

Natural Ferulic Acid Market

Natural Ferulic Acid Market Size and Share Forecast Outlook 2025 to 2035

Natural Vitamin E Product Market

Natural Vitamin E Product Market Size and Share Forecast Outlook 2025 to 2035

Natural Oil Polyols NOP Market

Natural Oil Polyols NOP Market Size and Share Forecast Outlook 2025 to 2035

Natural Rubber Market

Natural Rubber Market Size and Share Forecast Outlook 2025 to 2035

Natural Language Processing in Finance Market

Natural Language Processing in Finance Market Size and Share Forecast Outlook 2025 to 2035

Naturally Derived Fatty Alcohol Market

Naturally Derived Fatty Alcohol Market Size and Share Forecast Outlook 2025 to 2035

Natural Fiber Composites Market

Natural Fiber Composites Market Size and Share Forecast Outlook 2025 to 2035

Naturally Derived Sweeteners Market

Naturally Derived Sweeteners Market Size and Share Forecast Outlook 2025 to 2035

Future Market Insights

Natural Food Preservatives Market

Chat With MaRIA

Chat With

MaRIA

Hi There, I am MaRIA, Your Market Research Intelligence Assistant. How may I help you?