The confectionery market is projected to be valued at USD 324.7 billion in 2025 and is anticipated to grow to USD 605.8 billion by 2035, registering a compound annual growth rate (CAGR) of 6.2% over the forecast period. The global demand for chocolates, gummies, candies, and other confectionery items is fueled by changing consumer preferences, growing disposable incomes, and the increasing popularity of convenience foods.
As consumers indulge in occasional treats, the market is poised for substantial growth in both developed and emerging economies.
A key driver of the market’s growth is the rising demand for premium and healthier confectionery options. Consumers are becoming more health-conscious and are seeking lower-sugar, organic, and functional confectionery products that offer better nutritional value.
In response to this trend, companies are innovating by introducing sugar-free, plant-based, and low-calorie alternatives to cater to the evolving preferences of health-focused consumers. Additionally, the rise of e-commerce platforms has made it easier for consumers to access a wide range of confectionery products, further boosting market sales.
Recent developments in the confectionery market highlight the growing emphasis on sustainability and ethical sourcing. Manufacturers are increasingly focused on sourcing ingredients like cocoa and sugar from sustainable and fair-trade sources to meet consumer demand for ethically produced products.
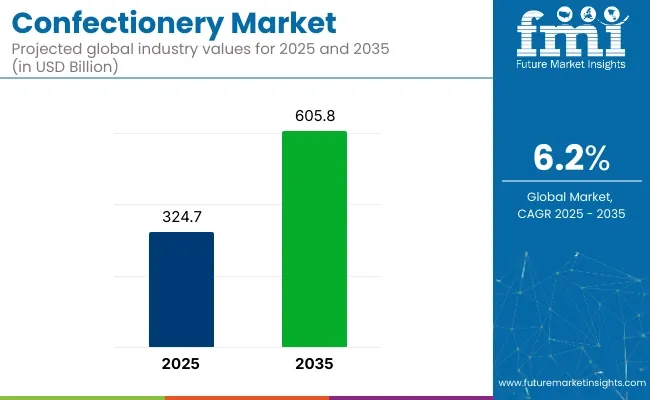
| Attributes | Description |
|---|---|
| Estimated Business Size (2025) | USD 324.7 billion |
| Projected Business Value (2035) | USD 605.8 billion |
| Value-based CAGR (2025 to 2035) | 6.2% |
On May 8, 2025, The Hershey Company introduced its innovation and consumer-focused packaging strategy at the 2025 NCA Sweets & Snacks Expo. This initiative includes the launch of Reese's Filled Pretzels and a commitment to enhance sustainability through recyclable and reusable packaging solutions.
The company aims to meet evolving consumer preferences and environmental goals. This was officially announced in the company's press release. As the market continues to grow, the rising preference for healthier and more sustainable options, coupled with ongoing innovations in product offerings, will drive further expansion in the confectionery sector.
Per capita spending on confectionery varies widely across regions, influenced by income levels, cultural preferences, health consciousness, and market availability. Developed countries typically show higher spending, driven by strong brand presence, frequent snacking habits, and seasonal consumption patterns. In contrast, emerging markets are experiencing gradual growth in spending as disposable incomes rise and Western-style confectionery becomes more accessible.
Labeling certifications play a vital role in the confectionery market by ensuring transparency, building consumer trust, and supporting compliance with health, safety, and ethical standards. These certifications help consumers make informed choices based on dietary needs, quality, and sourcing practices. Key labeling certifications include:
The below table presents a comparative assessment of the variation in CAGR over six months for the base year (2024) and current year (2025) for global confectionery market.
This analysis reveals crucial shifts in market performance and indicates revenue realization patterns, thus providing stakeholders with a better vision about the market growth trajectory over the year. The first half of the year, or H1, spans from January to June. The second half, H2, includes the months from July to December.
| Particular | Value CAGR |
|---|---|
| H1 (2024 to 2034) | 5.8% |
| H2 (2024 to 2034) | 6.0% |
| H1 (2025 to 2035) | 6.3% |
| H2 (2025 to 2035) | 6.6% |
The above table presents the expected CAGR for the global confectionery demand space over semi-annual period spanning from 2025 to 2035. In the first half (H1) of the year 2024, the business is predicted to surge at a CAGR of 5.8%, followed by a slightly higher growth rate of 6.0% in the second half (H2) of the same year.
Moving into year 2025, the CAGR is projected to increase slightly to 6.3% in the first half and remain relatively moderate at 6.6% in the second half. In the first half (H1 2024) the market witnessed a decrease of 18 BPS while in the second half (H2 2025), the market witnessed an increase of 26 BPS.
The global confectionery market is poised for stable growth through 2035, supported by indulgence-driven snacking and flavor innovation. In 2025, chocolate confectionery is projected to account for 42%, while fruit flavors are expected to hold 35% of their respective segment shares. Key players include Mars, Ferrero, and Mondelez.
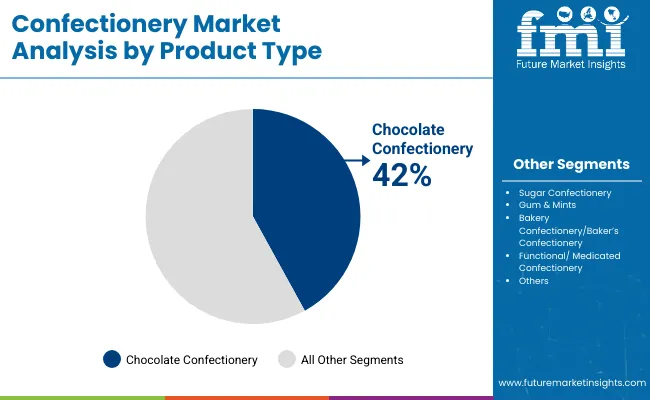
The chocolate confectionery segment is projected to command 42% of the product type market share in 2025. Premiumization, seasonal gifting, and impulse buying continue to drive strong performance. Dark chocolate is gaining popularity for its perceived health benefits, while filled and artisanal varieties offer innovation opportunities.
Brands like Ferrero and Lindt are focusing on origin-specific cocoa, clean labels, and eco-conscious sourcing to appeal to discerning consumers. Additionally, single-serve packaging and limited-edition flavors are helping chocolate brands stay competitive in both retail and online channels. With growing demand in emerging markets and sustained loyalty in mature ones, chocolate remains the anchor of global confectionery portfolios.
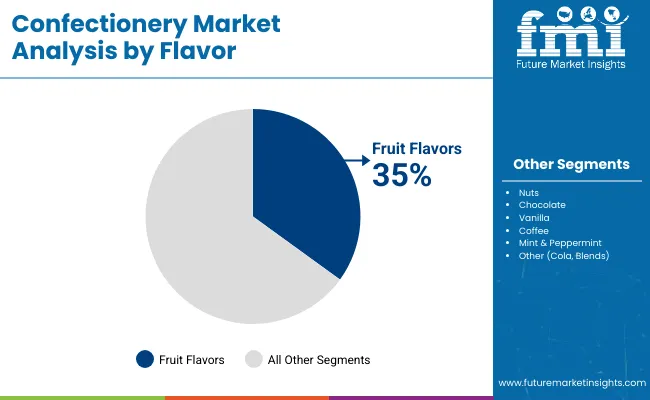
The fruit flavors segment is expected to hold 35% of the flavor segment market share in 2025. Consumer preference for refreshing, recognizable, and natural flavor profiles continues to elevate fruit-based confectionery products. Strawberry, orange, and cherry remain classics, while passionfruit, mango, and yuzu offer novelty appeal in global markets.
Companies like Haribo and Perfetti Van Melle are introducing hybrid products with real fruit juice and vitamin-fortified options to align with wellness trends. Fruit flavors also dominate in gummy, hard candy, and chewy formats, benefiting from their cross-generational appeal and low allergen profile. As brands explore exotic fruits and cleaner labels, this segment continues to grow in mainstream and premium categories alike.
Dark chocolate is being favored by health-conscious consumers due to its rich content of antioxidants, which are believed to combat free radicals and reduce inflammation. Additionally, dark chocolate contains higher cocoa percentage and less sugar compared to milk chocolate, which makes it a healthier choice.
Studies suggest that moderate consumption of dark chocolate can improve heart health, enhance brain function, and even elevate mood. These perceived health benefits have markedly boosted its popularity, leading to increased sales in the chocolate confectionery market. Brands are introducing a variety of dark chocolate products, including bars, truffles, and snacks.
Nestle launched 70% dark chocolate Kitkat bar in UK and Ireland, which is a limited edition treat. Further the dark chocolate bar is made with cocoa mass sourced from farmers.
Innovative packaging solutions are revolutionizing the confectionery market by addressing to modern consumer demands for convenience and sustainability. Resealable bags offer the practicality of keeping products fresh and portable, ideal for on-the-go snacking.
Single-serving packs provide portion control, appealing to health-conscious individuals and those seeking quick, easy treats. Eco-friendly materials, such as biodegradable or recyclable packaging, resonate with environmentally aware consumers who prioritize reducing their carbon footprint.
Mars launched its snickers bars in China which features individual packaging, made from a mono PP Material which has a concept of “designed for recycling”.
Seasonal and limited-edition products leverage the psychology of scarcity and exclusivity to boost sales. By offering unique flavors and products only available for a short period, brands create a sense of urgency among consumers, which encourages them to purchase before the time is gone.
This strategy is particularly effective during holidays and special occasions when consumers are more inclined to indulge or gift. The limited availability not only drives immediate sales spikes but also enhances brand appeal and customer loyalty, as consumers associate the brand with special, memorable experiences. This strategy also generates buzz and word-of-mouth marketing.
Functional confectionery is getting popular as consumers are searching for snacks that offer health benefits beyond mere indulgence. These products, like energy-boosting candies or stress-relief gummies, cater to the growing demand for wellness-oriented treats. By including ingredients such as vitamins, adaptogens, or natural stimulants, functional confectionery provides added value, appealing to health-conscious individuals.
This reflects a broader shift towards thoughtful eating, where consumers are prioritizing snacks that support their lifestyle and well-being. As a result, brands are innovating to create confectionery that not only satisfies sweet cravings but also contributes to overall health, making them a popular choice in the market.
Warrior, a sports nutirion brand announced about innovating a high protein range of crunch bars which includes new white chocolate blondie flavour.
The travel and hospitality industry are improving their confectionery offerings to address to travelers searching for unique and convenient treats. Airports, hotels, and other travel-related locations now feature exclusive flavors and special product placements, which creates a memorable experience for customers.
These offerings often include limited-edition items and region-specific flavors that allure to tourists and frequent travelers. By providing these unique choices, the travel retail and hospitality industry not only boost sales but also improves customer satisfaction and brand loyalty.
Rise of the Gourmet Gum and Mints Market
The gourmet gum and mints market is expanding as adult consumers are seeking more refined taste experiences. These products feature high-quality ingredients and unique flavors, such as exotic fruits, herbs, and spices, which distinguishes them from traditional offerings. This shows a broader shift towards artisanal and specialty foods, where consumers prioritize quality and uniqueness over mass-produced alternatives.
Tier 1 companies comprise market leaders with market revenue of above USD 100 million capturing significant sales domain share of 45% to 55% in the global sphere. These business leaders are characterized by high production capacity and a wide product portfolio.
These trade leaders are distinguished by their extensive expertise in manufacturing and reconditioning across multiple packaging formats and a broad geographical reach, underpinned by a robust consumer base. They provide a wide range of series including reconditioning, recycling, and manufacturing utilizing the latest technology and meeting the regulatory standards providing the highest quality.
Prominent companies within tier 1 include Ferrero International S.A., Nestle SA, The Hershey Company, Lotte Confectionery Co. Ltd., Perfetti Van Melle Group B.V. , Mondelez International, Inc., Mars Inc., and Chocoladefabriken Lindt & Sprüngli Ag.
Tier 2 companies include mid-size players with revenue of USD 50 to 100 million having presence in specific regions and highly influencing the local retail space. These are characterized by a strong presence overseas and strong consumer base knowledge.
These industry players have good technology and ensure regulatory compliance but may not have advanced technology and wide global reach. Prominent companies in tier 2 include Meiji Holdings Company, Ltd, Ezaki Glico Co. Ltd, Kervan Gida Sanayi Ve Ticaret AS, Yildiz Holding, and August Storck KG.
Tier 3 includes the majority of small-scale companies operating at the local presence and serving niche demand space having revenue below USD 50 million. These companies are notably oriented towards fulfilling local marketplace demands and are consequently classified within the tier 3 share segment.
They are small-scale players and have limited geographical reach. Tier 3, within this context, is recognized as an unorganized field, denoting a sector characterized by a lack of extensive structure and formalization when compared to organized competitors.
The following table shows the estimated growth rates of the top sales domains. The United Kingdom and China are set to exhibit high confectionery consumption, recording CAGRs of 6.5% and 7.5%, respectively, through 2035.
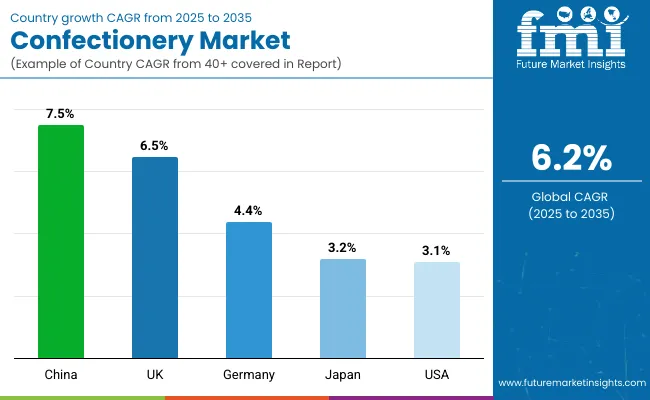
| Countries | CAGR (2025 to 2025) |
|---|---|
| Germany | 4.4% |
| UK | 6.5% |
| USA | 3.1% |
| China | 7.5% |
| Japan | 3.2% |
Confectionery demand in Germany is calculated to rise at a value CAGR of 4.4% during the forecast period (2025 to 2025). By 2035, Germany is expected to account for 29.4% of Confectionery sales in Europe.
Germany’s reputation for high-quality confectionery stems from its meticulous production standards and use of premium ingredients, making its chocolates and sweets highly sought after both domestically and internationally. The market is diverse, which offers everything from traditional treats like marzipan and gingerbread to innovative flavors and health-conscious choices, such as sugar-free and organic sweets.
This extensive variety addresses to a wide range of consumer preferences, ensuring continuous interest and engagement. Additionally, German confectionery brands often emphasize sustainability and ethical sourcing, which further enhances their appeal in the current consumer market. This combination of quality, variety, and ethical practices solidifies Germany’s leading position in the confectionery industry.
The ecosystem for Confectionery in the United States is projected to exhibit a CAGR of 3.1% during the assessment period. By 2035, revenue from the sales of Confectionery in the country is expected to reach USD 79.8 billion.
Major confectionery brands like Mondelez International, The Hershey Company, and Ferrero have dramatically expanded their market presence in the USA This expansion, linked with improved distribution channels and online availability, has made their products more accessible to a broader audience, driving market growth.
Further, confectionery products are integral to seasonal celebrations and gifting traditions. Post-pandemic, there’s been a resurgence in these activities as individuals are reconnecting with traditional festivities. This renewed enthusiasm for celebrations has boosted the demand for sweets and chocolates, making them popular choices for sharing and gifting during holidays and special occasions.
Consumption of Confectionery in China is projected to increase at a value CAGR of 7.5% over the next ten years. By 2035, the segment size is forecasted to reach USD 38.8 billion, with China expected to account for a demand space share of 60.8% in East Asia.
The increasing exposure to Western culture through media, travel, and international trade has introduced Chinese consumers to a wide range of Western confectionery products. This includes popular chocolates, candies, and sweets that were previously less common in China. Because of this, these products have gained popularity, especially among younger generations who are more open to trying new flavors and brands.
To accommodate with local tastes, confectionery companies are developing innovative products that blend traditional Chinese flavors with Western confectionery styles. For instance, including green tea-flavored chocolates, red bean candies, and other unique combinations. This fusion of flavors appeals to Chinese consumers’ preferences while offering something new and exciting, further driving and amplifying consumption.
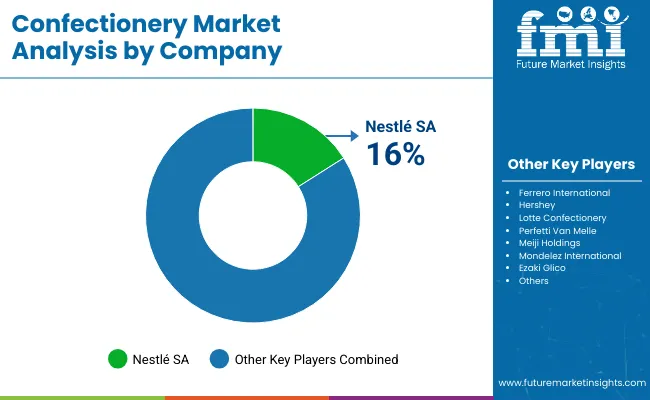
The Confectionery territory encompasses a diverse and dynamic competitive landscape. Leading Confectionery manufacturing companies are focusing on continuously developing new and unique flavors, including health-conscious options like sugar-free and organic sweets, to cater to evolving consumer preferences. And creating emotional connections with consumers through storytelling, brand heritage, and engaging marketing campaigns helps build brand loyalty.
| Report Attributes | Details |
|---|---|
| Current Total Market Size (2025) | USD 324.7 billion |
| Projected Market Size (2035) | USD 605.8 billion |
| CAGR (2025 to 2035) | 6.2% |
| Base Year for Estimation | 2024 |
| Historical Period | 2020 to 2024 |
| Projections Period | 2025 to 2035 |
| Quantitative Units | USD million for value |
| Product Types Analyzed (Segment 1) | Chocolate Confectionery, Sugar Confectionery, Gum & Mints, Bakery/Baker’s Confectionery, Functional/Medicated Confectionery |
| Flavor Categories Covered (Segment 2) | Fruits, Nuts, Chocolate, Vanilla, Coffee, Mint & Peppermint, Others (Cola, Blends) |
| Distribution Channels Covered (Segment 3) | Food Service, Airport Retail, Travel Retail (airplanes, cruise ships), Retail/Household |
| Regions Covered | North America; Latin America; Europe; Asia-Pacific; Middle East & Africa |
| Countries Covered | United States, Germany, United Kingdom, China, India, Japan, South Korea, Brazil, Canada |
| Key Players Influencing the Market | Ferrero International, Nestlé, Hershey, Lotte Confectionery, Perfetti Van Melle, Meiji Holdings, Mondelez International, Ezaki Glico, Lindt & Sprüngli, Mars Inc., Kervan Gida, Yildiz Holding, August Storck KG |
| Additional Attributes | Dollar sales by product type and distribution channel, impulse buying trends, promotion impacts, expanding retail networks, regional consumer preferences |
As per product type, the ecosystem has been categorized into Chocolate Confectionery, Sugar Confectionery, Gum & Mints, Bakery Confectionery/Baker’s Confectionery, and Functional/ Medicated Confectionery.
This segment is further categorized into Fruits, Nuts, Chocolate, Vanilla, Coffee, Mint & Peppermint, and Other (Cola, Blends).
This segment is further categorized into Food Service, Airport Retail, Travel Retail (airplanes, Cruise ships), and Retail/Household.
Industry analysis has been carried out in key countries of North America, Latin America, Europe, East Asia, South Asia, Oceania, and the Middle East & Africa.
The market is valued at USD 324.7 billion in 2025.
Confectionery sales grew at a 5.1% CAGR between 2020 and 2024.
Ferrero, Nestlé, Hershey, Lotte, Perfetti Van Melle, Mondelez, Mars, and Lindt lead the industry.
Europe will hold a 41.2% revenue share by 2035.
North America will hold an 18.7% share of global demand in 2025.


Our Research Products

The "Full Research Suite" delivers actionable market intel, deep dives on markets or technologies, so clients act faster, cut risk, and unlock growth.

The Leaderboard benchmarks and ranks top vendors, classifying them as Established Leaders, Leading Challengers, or Disruptors & Challengers.

Locates where complements amplify value and substitutes erode it, forecasting net impact by horizon

We deliver granular, decision-grade intel: market sizing, 5-year forecasts, pricing, adoption, usage, revenue, and operational KPIs—plus competitor tracking, regulation, and value chains—across 60 countries broadly.

Spot the shifts before they hit your P&L. We track inflection points, adoption curves, pricing moves, and ecosystem plays to show where demand is heading, why it is changing, and what to do next across high-growth markets and disruptive tech

Real-time reads of user behavior. We track shifting priorities, perceptions of today’s and next-gen services, and provider experience, then pace how fast tech moves from trial to adoption, blending buyer, consumer, and channel inputs with social signals (#WhySwitch, #UX).

Partner with our analyst team to build a custom report designed around your business priorities. From analysing market trends to assessing competitors or crafting bespoke datasets, we tailor insights to your needs.
Supplier Intelligence
Discovery & Profiling
Capacity & Footprint
Performance & Risk
Compliance & Governance
Commercial Readiness
Who Supplies Whom
Scorecards & Shortlists
Playbooks & Docs
Category Intelligence
Definition & Scope
Demand & Use Cases
Cost Drivers
Market Structure
Supply Chain Map
Trade & Policy
Operating Norms
Deliverables
Buyer Intelligence
Account Basics
Spend & Scope
Procurement Model
Vendor Requirements
Terms & Policies
Entry Strategy
Pain Points & Triggers
Outputs
Pricing Analysis
Benchmarks
Trends
Should-Cost
Indexation
Landed Cost
Commercial Terms
Deliverables
Brand Analysis
Positioning & Value Prop
Share & Presence
Customer Evidence
Go-to-Market
Digital & Reputation
Compliance & Trust
KPIs & Gaps
Outputs
Full Research Suite comprises of:
Market outlook & trends analysis
Interviews & case studies
Strategic recommendations
Vendor profiles & capabilities analysis
5-year forecasts
8 regions and 60+ country-level data splits
Market segment data splits
12 months of continuous data updates
DELIVERED AS:
PDF EXCEL ONLINE
Confectionery Coating Market Size and Share Forecast Outlook 2025 to 2035
Confectionery Fillings Market Size and Share Forecast Outlook 2025 to 2035
Confectionery Packaging Market Size, Share & Forecast 2025 to 2035
Confectionery Ingredients Market Analysis - Size, Share, and Forecast Outlook 2025 to 2035
Market Share Distribution Among Confectionery Packaging Manufacturers
Confectionery Flexible Packaging Market Trends – 2024-2034
Confectionery Fats Market
Vegan Confectionery Market Size and Share Forecast Outlook 2025 to 2035
Sugar Confectionery Market Analysis by Form, Application, Packaging, Distribution Channel and Region through 2035
Liquor Confectionery Market Insights - Indulgent Sweets & Alcohol-Infused Treats 2025 to 2035
Chocolate Confectionery Market Analysis by Product, Type, Distribution Channel, and Region Through 2035
US Convenience Confectionery Retail Sales Analysis - Size, Share & Forecast 2025 to 2035

Thank you!
You will receive an email from our Business Development Manager. Please be sure to check your SPAM/JUNK folder too.
Chat With
MaRIA