The sugar confectionery market is estimated to be valued at USD 57.99 billion in 2025 and is projected to reach USD 89.21 billion by 2035, expanding at a CAGR of 4.4% during the assessment period.
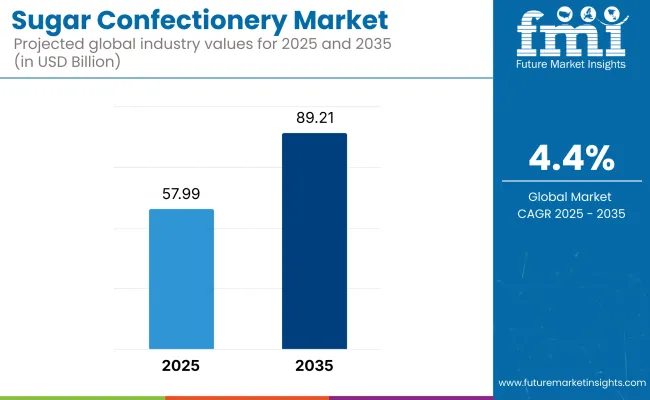
The industry is experiencing consistent growth, which is primarily due to the changing consumer preferences, product development, and the increase in retail distribution channels. Among the types of sugar confectioneries that are dedicated to the sub-sector are candies, toffees, gums, mints, and lollipops which are still the most favorite treats for many all around the globe. The dominance of premium, functional, and exotic-flavored confectionery products is the additional reason besides, the above ones that further develop the industry.
Another main aspect contributing to the growth of the industry is the need for artisanal and premium confectionery products. Customers realize that eating good food made ingredient by nature, real flavors, and an unusual mouthfeel is the cause of new innovations in the field of gastronomy. One special product that is nice and tasty is the chocolate bar made of organic cacao beans or hard candies made without sugar. Apart from that, the rise in gifting and seasonal candies is another reason for the increase in demand, especially during holidays and celebratory events.
Technological breakthroughs in making candy, like the ones that improve the process of flavor encapsulation, texture enhancement, and innovative packaging contradict things and make them stay preservation of products. It has been noticed that the cell of the sugar confectionery brands by digital marketing, social media influence, and over-the-top performances in e-commerce has also a spectrum expansion.
Nonetheless, the industry has its obstacles to deal with, like the price of the raw materials that are volatile, the regulatory concerns over sugar consumption, and the competition from healthier snacks which are increasing. Furthermore, the transition of consumer choices that now are more focused on lower sugar intake will also affect the industry for traditional confectionery products.
Despite these challenges, there exist substantial openings for expansion in the industry. The wide range of plant-based, fruity, and limited-time flavors that people want serves as the gateway to new opportunities. Also, the use of recycle and eco-friendly packaging will drive further innovation, cutting down on both emission levels and mass production. Therefore, with candy manufacturers working on various areas such as pleasure of the palate, health-oriented formulations, and premium branding, the future stays promising in the sugar confectionery sector.
The sugar confectionery industry is transforming with changing consumer tastes, health-oriented trends, and premiumization tactics. Traditional sugar-based products still enjoy a firm hold, yet functional and lower-sugar confections are increasingly popular among health-conscious shoppers.
In the foodservice sector, there is increasing demand for premium, exotic, and artisanal confectionery products, especially in dessert cafes and parlors. In the industrial sector, which includes dairy and baking industries, sugar confectionery as inclusions, fillings, and decorative items is the preferred option, increasing the demand for high-quality, bulk ingredients.
Gifting & specialty category is growing rapidly, as premium packaging, new flavors and seasonality approach appealing to consumers. Brands valorizing ingredient transparency, nature-based sweeteners, and novel product formats will surely carve out competitive advantage in this emergent and dynamic industry.
The table below provides a comparative assessment of the variation in CAGR over six months for the base year (2024) and the current year (2025) in the global industry. This analysis highlights key shifts in industry performance and revenue patterns, helping stakeholders gain a clear perspective on growth trends. The first half (H1) covers January to June, while the second half (H2) spans July to December.
| Particular | Value CAGR |
|---|---|
| H1 (2024 to 2034) | 4.2% |
| H2 (2024 to 2034) | 4.5% |
| H1 (2025 to 2035) | 4.3% |
| H2 (2025 to 2035) | 4.6% |
From H1 2025 to H2 2035, the industry is anticipated to expand at a CAGR of 4.2% in the first half, followed by 4.5% in the second half of the same period. Comparatively, during the previous decade (2024 to 2034), the CAGR was slightly lower, recorded at 4.3% in H1 and 4.6% in H2. The industry witnessed an increase of 10 BPS in H1 2025 and a further rise of 10 BPS in H2, indicating steady momentum in product innovation and consumer demand.
Between 2020 to 2024, the sugar confectionery industry underwent a stark transformation with consumers turning to health for the betterment of their health, which created a move towards lower-sugar and functional products. Novel sweeteners, like monk fruit extract and allulose, were having their moment, enabling the formulation of foods that tasted and felt like regular sweets.
Functional and medicated candies have exploded - gummies and lozenges spiked with vitamins, probiotics and adaptogens are hot. Hybrid confections were also on the rise, combining disparate textures and tastes to create new experiences seen as attractive, especially to younger consumers.
In addition, AI and blockchain technologies also started bolstering the efficiency of supply chains in the face of rising ingredient costs and supply chain disruption that enables producers to better combat rising ingredient costs, and also promote quality control and traceability.
From 2025 to 2035, sugar confectionery will be highly customized and technology-centric. AI mixing means sugar reduction methods can be taken to the next level, further balancing health-indulgence. There will be slow growth in functional confectionery in the form of highly specialized items such as mood-elevating, cognitive-enhancing, and gut-friendly products.
Plant-animal-sustainability hybrid foods will contain the finest plant and animal-based, along with sustainable, ingredients. Intelligent packaging and Augmented Reality (AR) will change the face of marketing. Real-time data analysis and Artificial Intelligence (AI)-driven logistics will optimize manufacturing while minimizing waste and optimizing global supply chains. The future marketplace will be influenced by brands with a capability to combine health-driven innovation and experience-based engagement.
Comparative Market Shift Analysis (2020 to 2024 vs. 2025 to 2035)
| 2020 to 2024 | 2025 to 2035 |
|---|---|
| Less sugar and natural sweeteners. | AI-driven personalization for personalized confectionery experiences. |
| Upscale and artisanal confectionery gained traction. | Functional confectionery with adaptogens, probiotics, and vitamins. |
| Direct-to-consumer sales and e-commerce expansion. | Metaverse virtual taste experiences. |
| Sustainability emphasis on green packaging. | Carbon-neutral production and biodegradable packaging as the norm. |
| Increased use of responsibly sourced ingredients. | Blockchain ingredient tracking for transparency. |
| Inflation in raw material costs influencing raw material costs. | AI-optimized production to reduce costs and less waste. |
| Increased regulation on sugar levels and labeling. | New plant-based and alt sweeteners with increased functionality to reduce sugar levels. |
Sugar confectionery products are at risk of supply chain disturbances accompanied by fluctuations in sugar and cocoa prices, the impact of climate change on crop yields, and trade limitations. Disruptions in sourcing the raw materials can cause a rise in production costs and also lead to supply shortages. Disposal firms need to come face coked with resilient procurement strategies and also looking for alternative ingredient sourcing.
Consumer preference changes are another major challenge here. With the increasing health and wellness cognizance, consumer demand has shifted toward naturally sourced and organic confectionery products. Companies ought to expand their product lines with low sugar products, plant-based products, and enriched goods in order to meet the tastes of customers and thus stay relevant in the industry.
Economic liquidity and inflationary pressures directly influence the consumer buying behavior. Luxury confectionery brands may run during times of economic depression, fluctuate in demand, while less expensive brands may get more popularity. Enterprises should establish pricing strategies that are flexible as well as develop a multi-tier product offering to keep a wider customer base.
Concerns about sustainability such as plastic packaging waste and responsible sourcing are crucial points to be looked into. The companies will be following the eco-friendly path through using the recyclable packaging other than that they will make sure fair trade and responsible sourcing of ingredients is in line with environmental and social expectations thus eradicating the compliance and reputational risks.
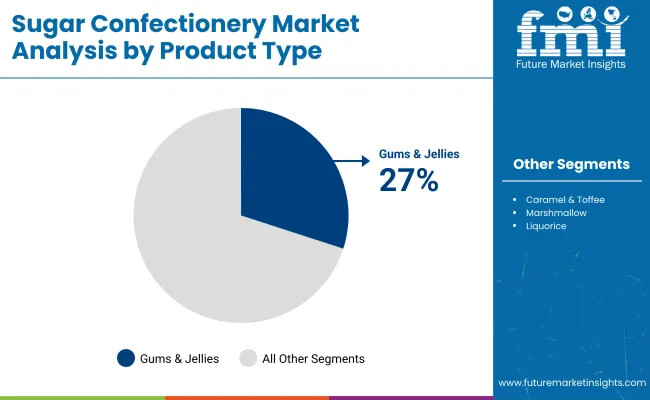
Gums & Jellies Leading in Product Type Segment
| Segment | Value Share (2025) |
|---|---|
| Gums & Jellies (By Product Type) | 27% |
In 2025, gums and jellies and caramel and toffees will be the two dominant segments in the industry. However, gummies & jellies have dominated the industry with a 27% share, owing to higher popularity concerning chewy texture, fruity flavor varieties, and sugar-free and functional types. The segment is driven by strong demand in Europe and North America, where consumers are seeking luxury, unconventional, and natural ingredient-based sweets.
Big gelatine-based players include Haribo, Mondelez (Trolli), and Perfetti Van Melle (Alpenliebe Jellies), who tussle against a spectrum of fruity and vitamin-stuffed jellies. Haribo Goldbears, for instance, remain a bestseller in Europe, while Trolli’s gummy creations appeal to the younger set with fanciful shapes and flavours.
The caramel & toffees industry segment has captured a 20% industry share, with North America and Asia being the most lucrative regions, where the demand for creamy & indulgent confectionery products is leading. This is due to the growing preference for premium dairy-based caramel candy and toffee. Nestlé (Quality Street Toffees), Mars (Werther’s Original), and Lotte (Milk Caramel) are prominent national and local players.
Werther’s Original, a caramel brand, for example, is a favorite in both North America and Europe for its thick, buttery flavor and nostalgic value. Domestic artisanal brands in Asia, such as Glico and Morinaga, also produce regionally inspired caramel candies filled with local tastes, including matcha and black sesame.
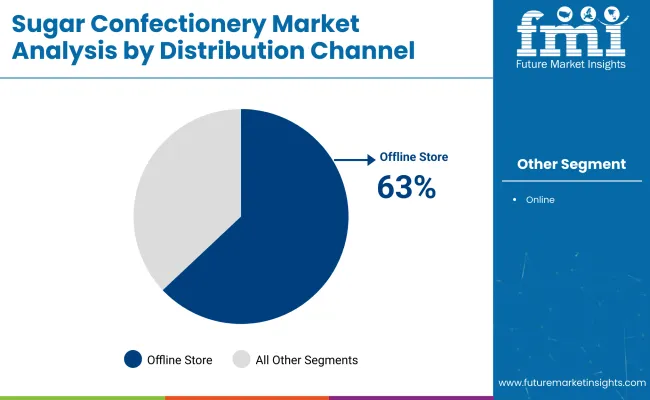
Offline Stores Remain the Dominant Distribution Channel
| Segment | Value Share (2025) |
|---|---|
| Offline Stores (By Distribution Channel) | 63% |
In 2025, offline stores will dominate the industry with a 63% industry share, while online platforms will account for 37%. Sugar confectionery is mainly impulse-buying, so offline stores- including supermarkets, convenience stores, and specialty candy shops- remain the most favored distribution channel. As for retail stores, consumers frequently buy unplanned items during their shopping, a midstream element that can drive sales.
Companies: The supermarkets that run the countries, such as Walmart, Tesco, and Carrefour, all sell a sample of confectionery brands. Then there are specialty candy shops like Lindt Boutiques and See’s Candies that cater to high-end clientele seeking luxury confections. Asia-Pacific, as well as Europe, show a very strong dominance for offline retail, which is rooted in traditional chocolate shopping behavior and stores.
Online platforms, with a 37% industry share, are growing quickly thanks to the e-commerce boom and the rise of DTC brands. E-commerce Platforms: Amazon, Alibaba, Walmart. The site also makes it easy for consumers to buy various types of confectionery.
Online sales surge reportedly due to customized assortments, gift packaging, and exclusive online-only flavours from brands including Ferrero Rocher, Lindt, and Hershey’s. DTC brands like SmartSweets and YumEarth also focus on better alternatives to traditional confectionery, thanks to the growing consumer demand for sugar-free products and organic ingredients. The online channel is particularly strong in North America, where digital shopping habits and subscription-based candy boxes are on the rise.
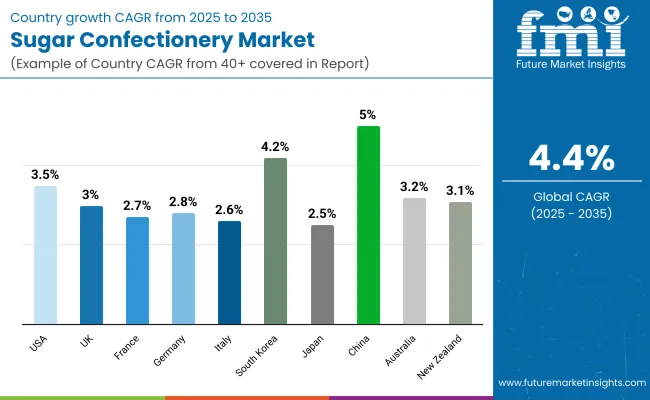
| Countries | CAGR (2025 to 2035) |
|---|---|
| USA | 3.5% |
| UK | 3.0% |
| France | 2.7% |
| Germany | 2.8% |
| Italy | 2.6% |
| South Korea | 4.2% |
| Japan | 2.5% |
| China | 5% |
| Australia | 3.2% |
| New Zealand | 3.1% |
The USA industry is forecasted to have a CAGR of 3.5% from 2025 to 2035. The sales of premium confectionery products like gourmet chocolates and organic sweets are on the rise as buyers are seeking superior and healthy ingredients. Confectionery sales in the festive and holiday seasons are high as manufacturers produce limited-range products to lure buyers.
The presence of robust distribution channels such as supermarkets, convenience stores, and internet channels is also driving industry growth. Product innovation is also a key strategy, and companies are innovating through new flavors, textures, and functional ingredients such as added vitamins or low-sugar formats.
The UK industry is anticipated to exhibit a CAGR of 3.0% over the forecast period. The industry is driven by shifting consumption patterns towards low-sugar and sugar-free products due to increasing health consciousness. Most leading businesses are pledging to reformulate traditional products based on government recommendations to lower sugar levels.
Premiumization has also led to increased demand for handmade and artisan confectionery. Online distribution is also becoming a crucial channel, giving consumers easy accessibility to different confectionary products. Seasonal retail of confectionery products during festivals like Christmas and Easter also contributes towards stabilizing the industry.
French sugar confectionery is expected to reach a CAGR of 2.7% from 2025 to 2035. French consumers value quality and authenticity the most, and therefore, traditional sweets and handmade sweets enjoy strong demand. Natural and organic ingredients lead to innovation in the sector, with high-end brands preferring clean-label products.
Specialty confectionery items like nougats and fruit candies remain favorites among buyers. Supermarkets remain the most popular sales channel, though internet shopping is growing, particularly among younger consumers who are seeking the convenience of purchase.
The German industry is anticipated to grow at a CAGR of 2.8% during the forecast period. Demand expansion is prompted by functional confectionery carrying the inherent health merits of vitamin-enhanced gummies. Sustainability gains a lot of prominence as manufacturers adopt greener packaging types and employ ingredients with ethical sourcing.
Sugar-reduction initiatives influence reformulation, with firms introducing products that contain reduced sugars in order to capture demands from consumers who are sensitive to health. Retail expansion is prompted by discounters and Internet channels, which in turn propel the progress of the industry.
The Italian sugar confectionery industry is expected to grow at a CAGR of 2.6% from 2025 to 2035. Traditional confectionery items such as torrone and sweets are still popular, and low-sugar and sugar-free products are gaining popularity. Premium and artisanal confectionery sales are changing buying behavior with a higher emphasis on locally produced ingredients.
Confectionery gifting culture is maintained, driving the retailing of premium chocolates and boxed goods. The distribution channels through supermarkets and specialist channels are strong, with the increase in internet distribution.
The industry in South Korea is anticipated to grow at a CAGR of 4.2%. The demand is fueled by shifting tastes and attitudes, with hybrid confectionery demand providing a blend of Western and traditional Korean flavors. Creative marketing and packaging among youth are fueling the sales.
The culture of convenience stores, as well as the far-reaching penetration of e-commerce, is expanding the availability of the items. Furthermore, health-conscious phenomena are compelling manufacturers to innovate confectionery products that contain no sugar as well as have functional properties.
Japan's industry will grow at a CAGR of 2.5% through the forecast period. The demand for season and limited-series products drives the industry, as the manufacturers will introduce new flavors in accordance with consumers' requirements.
Functional candies, including collagen candies and probiotic candies, are more popular. Japanese consumers have a great preference for a nice appearance and small package size, which means that packaging plays an important role in sales. Apart from the origin of the price of demand, the industry is supported by large retailing channels such as department stores, convenience stores, and vending machines.
China's industry is also anticipated to increase at a CAGR of 5% from 2025 to 2035. Urbanization and rising disposable incomes are fueling demand for confectionery products, with local players expanding the product line to include traditional Chinese confectionery and Western sweets.
The blend of traditional tastes and modern confectionery manufacturing is luring customers. Channels for online retailing are a key driver for industry growth with complete product coverage. Expanding global brand power is also contributing to product diversification.
The Australian industry will expand at 3.2% CAGR over the forecast period. Natural and organic confectionery consumption is increasing as the consumer becomes increasingly health-conscious. Moral sourcing and eco-friendly packaging are the biggest issues for brands looking to appeal to green-aware consumers.
Multiculturalism is driving future flavor trends, with fusion and exotic confectionery being the flavor du jour. Online shopping for confectionery and subscription boxes is introducing new levels of consumer engagement and industry growth.
The New Zealand industry is expected to expand at 3.1% CAGR. The industry is witnessing steady demand for traditional sweets, with low-sugar and vegan confectionery in rising popularity. Premiumization is also witnessed, with consumers increasingly asking for top-quality, locally made ingredients.
A strong gifting culture in the confectionery industry is seen, particularly at festival times. Growth of the industry over the long term will be driven by retail expansion in supermarkets and specialist outlets, as well as online buying of confectionery.
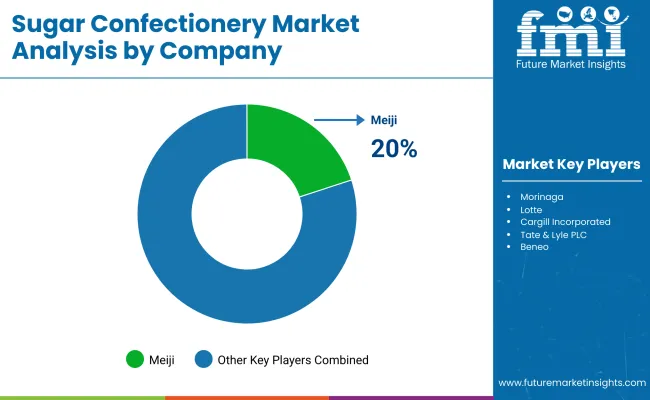
The industry is advancing around the world because of changing consumer needs, product innovation, and a demand for premium and functional sweets. Leading confectioners such as Meiji, Morinaga, and Lotte, which boast considerable strength from loyalty in their brands, a wide distribution network as well as product diversification strategies, have dominated the industry.
The focus of companies today, in line with changing consumer attitudes towards healthy indulgence and ethical manufacture, has been on flavor innovation, sugar reduction, and sustainable ingredient sourcing.
Ingredient suppliers Cargill, Tate & Lyle, and Archer Daniels Midland (ADM) enhance the contribution of sweeteners, texturizers, and sugar alternatives to final makeup, thus affecting the nutritional profile of confectionery products. As the trend of sugar reduction moves along, manufacturers are introducing natural sweeteners and functional ingredients in low-sugar and sugar-free candies while keeping the taste and integrity of texture.
Besides, sustainability is among the major competitive areas; thus, companies are increasingly investing in responsible sourcing and fair trade certifications of sugar as well as green packaging solutions. Industry consolidation through mergers and acquisitions is further intensifying competition as established players seek to enhance their product offerings and industry reach.
Market Share Analysis by Company
| Company Name | Estimated Market Share (%) |
|---|---|
| Meiji | 20-24% |
| Morinaga | 16-20% |
| Lotte | 12-16% |
| Cargill, Incorporated | 10-14% |
| Tate & Lyle PLC | 8-12% |
| Other Companies (Combined) | 25-35% |
| Company Name | Key Offerings & Market Focus |
|---|---|
| Meiji | Dominates the Asian confectionery industry with premium chocolates and sugar-based candies, focusing on functional ingredients and health-conscious formulations. |
| Morinaga | Specializes in traditional and innovative sugar confections, integrating natural fruit extracts and low-calorie alternatives into its product lines. |
| Lotte | Expand global reach through diverse sugar-based confectionery, chewing gums, and soft candies while incorporating sustainability initiatives in ingredient sourcing. |
| Cargill, Incorporated | Supplies high-quality sugar, sweeteners, and alternative ingredients to confectionery brands, enabling low-sugar and plant-based product innovations. |
| Tate & Lyle PLC | Pioneers in sugar reduction technologies, offering natural as well as artificial sweeteners for reduced-calorie confections. |
Key Company Insights
Meiji (20-24%)
Meiji is the leader in the Asian industry, offering a large variety of product lines in chocolate, fruit-flavored candy, and functional sweets, focusing on premiumization and health-oriented innovations, including collagen-rich candies and vitamin-added confections.
Morinaga (16 to 20%)
Morinaga is a key player in the Japanese industry. It offers chewy caramels, gummies with fruit flavors, and soft candies. The company integrates real fruit extracts as well as sugar alternatives into its products for indulgent, guilt-free munching.
Lotte (12-16%)
Lotte is expanding internationally based on its existence in the sugar confectionery and gum industries. The company has made sustainable commitments to ethical ingredient sourcing and eco-friendly packaging, which gives it a strong hold in the industry strategy based on sustainability.
Cargill, Incorporated (10-14%)
Cargill is significant as the foremost ingredient supplier of sugar, glucose syrup, and plant sweeteners, which makes it a better choice for confectioners to make lower-calory, sugar-free, and organic product variants.
Tate and Lyle PLC (8-12%)
Tate & Lyle manufactures its collection of sugar substitutes, such as Stevia and fiber-enhanced sweeteners, to help brands reduce their sugar levels while retaining sweetness and mouthfeel.
Other Key Players (25-35% Combined)
By product type, it is segmented into hard-boiled sweets, caramel & toffees, gums & jellies, medicated confectionery, mints, marshmallows, nougat, lollipops, and liquorice.
By packaging, the industry is segmented into sachet, box, and others based on packaging types.
By distribution channel, it is divided into offline stores and online platforms, with offline channels holding a major share due to impulse buying behavior.
By region, it is segregated by North America, Latin America, Western Europe, Eastern Europe, South Asia & Pacific, East Asia, Central Asia, Balkan and Baltic Countries, Russia and Belarus, the Middle East & Africa.
The industry is expected to reach USD 57.99 billion in 2025.
The industry is projected to grow to USD 89.21 billion by 2035.
The industry is expected to grow at a CAGR of approximately 4.4% from 2025 to 2035.
China is expected to experience the highest growth, with a CAGR of 5% during the forecast period.
The gums & jellies segment is one of the most widely consumed categories in the industry.
Leading companies include Meiji, Morinaga, Lotte, Cargill, Incorporated, Tate & Lyle PLC, Archer Daniels Midland Company (ADM), Südzucker AG, Beneo, and Clasen Quality Chocolate.


Our Research Products

The "Full Research Suite" delivers actionable market intel, deep dives on markets or technologies, so clients act faster, cut risk, and unlock growth.

The Leaderboard benchmarks and ranks top vendors, classifying them as Established Leaders, Leading Challengers, or Disruptors & Challengers.

Locates where complements amplify value and substitutes erode it, forecasting net impact by horizon

We deliver granular, decision-grade intel: market sizing, 5-year forecasts, pricing, adoption, usage, revenue, and operational KPIs—plus competitor tracking, regulation, and value chains—across 60 countries broadly.

Spot the shifts before they hit your P&L. We track inflection points, adoption curves, pricing moves, and ecosystem plays to show where demand is heading, why it is changing, and what to do next across high-growth markets and disruptive tech

Real-time reads of user behavior. We track shifting priorities, perceptions of today’s and next-gen services, and provider experience, then pace how fast tech moves from trial to adoption, blending buyer, consumer, and channel inputs with social signals (#WhySwitch, #UX).

Partner with our analyst team to build a custom report designed around your business priorities. From analysing market trends to assessing competitors or crafting bespoke datasets, we tailor insights to your needs.
Supplier Intelligence
Discovery & Profiling
Capacity & Footprint
Performance & Risk
Compliance & Governance
Commercial Readiness
Who Supplies Whom
Scorecards & Shortlists
Playbooks & Docs
Category Intelligence
Definition & Scope
Demand & Use Cases
Cost Drivers
Market Structure
Supply Chain Map
Trade & Policy
Operating Norms
Deliverables
Buyer Intelligence
Account Basics
Spend & Scope
Procurement Model
Vendor Requirements
Terms & Policies
Entry Strategy
Pain Points & Triggers
Outputs
Pricing Analysis
Benchmarks
Trends
Should-Cost
Indexation
Landed Cost
Commercial Terms
Deliverables
Brand Analysis
Positioning & Value Prop
Share & Presence
Customer Evidence
Go-to-Market
Digital & Reputation
Compliance & Trust
KPIs & Gaps
Outputs
Full Research Suite comprises of:
Market outlook & trends analysis
Interviews & case studies
Strategic recommendations
Vendor profiles & capabilities analysis
5-year forecasts
8 regions and 60+ country-level data splits
Market segment data splits
12 months of continuous data updates
DELIVERED AS:
PDF EXCEL ONLINE
Sugarcane Bottle Market Forecast and Outlook 2025 to 2035
Sugarcane-Derived Squalane Market Size and Share Forecast Outlook 2025 to 2035
Confectionery Coating Market Size and Share Forecast Outlook 2025 to 2035
Confectionery Market Analysis - Size, Share, and Forecast Outlook 2025 to 2035
Sugared Egg Yolk Market Size and Share Forecast Outlook 2025 to 2035
Confectionery Fillings Market Size and Share Forecast Outlook 2025 to 2035
Confectionery Packaging Market Size, Share & Forecast 2025 to 2035
Confectionery Ingredients Market Analysis - Size, Share, and Forecast Outlook 2025 to 2035
Sugar Toppings Market Size, Growth, and Forecast for 2025 to 2035
Sugarcane Fiber Bowls Market – Growth & Demand 2025 to 2035
Sugar-Free Cookies Market Insights - Consumer Trends 2025 to 2035
Sugar-Free Sweets Market Growth - Trends & Consumer Preferences 2025 to 2035
Sugar-Free White Chocolate Market Trends - Demand & Growth 2025 to 2035
Sugar-Free Syrups Market Insights - Innovations & Consumer Demand 2025 to 2035
Sugar-Free Gummy Market Insights - Consumer Trends & Growth 2025 to 2035
Sugar Beet Pectin Market Growth - Functional Applications & Demand 2025 to 2035
Sugar Substitute Market Trends - Low-Calorie Sweeteners & Demand 2025 to 2035
Sugar-based Excipients Market Analysis by Product, Type, Functionality, Formulation, and Region Through 2035
Sugar Alcohol Market Trends - Growth & Sweetener Innovations 2025 to 2035
Sugar Free Candy Market Trends - Innovations & Demand 2025 to 2035

Thank you!
You will receive an email from our Business Development Manager. Please be sure to check your SPAM/JUNK folder too.
Chat With
MaRIA