Reports

- Global Locations -

Headquarters

Future Market Insights, Inc.

Christiana Corporate, 200
Continental Drive, Suite 401,
Newark, Delaware - 19713,
United States

T: +1-845-579-5705

Americas

Future Market Insights, Inc.

616 Corporate Way, Suite 2-9018,
Valley Cottage, NY 10989, United States

T: +1-347-918-3531

MEA

Future Market Insights

1602-6 Jumeirah Bay X2 Tower, Plot No: JLT-PH2-X2A,
Jumeirah Lakes Towers, Dubai,
United Arab Emirates

Europe

Future Market Insights

3rd Floor, 207 Regent Street,
W1B 3HH London
United Kingdom

T: + 44 (0) 20 8123 9659
D: +44 (0) 20 3287 4268

Asia Pacific

Future Market Insights

IndiaLand Global Tech Park, Unit UG-1, Behind Grand HighStreet, Phase 1, Hinjawadi, MH, Pune – 411057, India

Confectionery Fillings Market Snapshot (2022-2032)

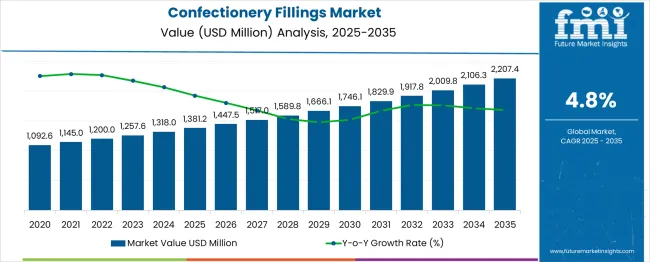
[257 Pages Report] The global confectionary fillings market is projected to have a moderate-paced CAGR of 4.8% during the forecast period. The current valuation of the market is US$ 1,200 million in 2022. The market value of the global confectionary fillings market is anticipated to reach a high of US$ 1,917.8 million by the year 2032. This growth is supported by:

  • The innovative savory flavors are being increasingly associated with fillings of chocolate, strawberry, vanilla, and more for attracting customers.
  • Increasing consumer preference for baked and confectionary products is expected to augur the growth of the confectionery fillings market.
  • Consumer inclination towards products that are made with some innovation is a primary factor fueling growth, as there is a change in food choices identified across the populace.
  • Confectionary fillings and toppings are identified to enhance the product’s shelf-life.
  • Visual appeal of the products is getting better with the addition of confectionery fillings and is attracting a wide base of customers by making the food look more delicious.

However, the fluctuations in the prices of the raw materials and strict adherence to the international quality standards are some factors that are likely to curb the growth in the coming years.

Data Points Key Statistics
Expected Market Value (2022) US$ 1,200 Million
Anticipated Forecast Value (2032) US$ 1,917.8 Million
Projected Growth Rate (2022-2032) 4.8% CAGR

Don't pay for what you don't need

Customize your report by selecting specific countries or regions and save 30%!

Domineering Segments in the Confectionary Fillings Market

As per the analysis of Future Market Insights, it is anticipated that the nut-based confectionery filling segment is likely to lead the market, and is anticipated to record a CAGR of 9% during the forecast period. Besides this flavor, the milk chocolate confectionery filling is expected to hold a considerable share. This dominance can be attributed to the high popularity and desirability of milk chocolate among kids and adults due to its unique taste, which is anticipated to boost the demand for milk chocolate confectionary fillings through 2032.

Besides the flavors, the cookies segment by product category is most likely to witness substantial growth. The rising demand for premium-sized confectionary products is anticipated to leverage the sales of flavor-filled cookies, which in turn is expected to fuel the expansion of the confectionery fillings market globally.

What is the Growth Prospect for Manufacturers?

It is identified that there is a rise in awareness amongst consumers regarding the health benefits of certain foods. There is a high demand for sugar-free, gluten-free, and low-fat category confectionary items. Innovative fruit flavors are in tandem with the taste-bud preferences of the customers. With the growing demand for pastry fillings with bake-stable properties, the manufacturers are identified to market reduced calories and sugar on their labels to meet the ever-increasing demand for these products.

Furthermore, rapid urbanization across the globe and elevated purchasing power of consumers are making allowance for them to spend on prepared and readymade food products that can be quickly prepared. This aspect is anticipated to unravel lucrative opportunities for the confectionary filling manufacturers in the market.

In addition to that, the prominent players in the market are indulging in mergers and acquisitions with other manufacturers in order to curate unique and innovative confectionery fillings. They are witnessed embark on the launch of new confectionary products. For instance, Ferrero expanded its Nutella Biscuit to Italy in 2019. These biscuits are filled with hazelnut and chocolate spread. The increasing popularity of cupcakes filled with different flavors is also having a rise in demand. Therefore, it is anticipated that the market for confectionary fillings is likely to remain highly competitive and witness significant growth over the forecast period.

In food and beverages, fillings and toppings play an important role in determining desired features such as texture, taste, bite, flavor, and appearance. The filling and toppings are visually appealing, and they attract customers by making the food look more delicious.

Fillings and toppings can be used to stretch the component by giving it the appearance of additional fruit. Meal items such as meat, fish, pasta, frozen food, and bakery fillings are processed in industrial stabilizer systems that are modified based on viscosity and texture. The application of several fillings and toppings can enhance the product's shelf life. Also, manufacturers have been focusing on employing low-calorie fillings or low-sugar toppings for health-conscious consumers, which will offer significant growth opportunities to the market in the coming time.

Nandini Roy Choudhury

Principal Consultant

Talk to Analyst

Find your sweet spots for generating winning opportunities in this market.

What are the Factors Driving the Global Confectionery Fillings Market?

Growing Variety of Flavored Confectionery Filling Products to Drive the Market

The changing food consumption patterns of consumers are expected to drive growth in the confectionery filling market as the food industry expands. The increase in the working population in most countries is changing consumer food preferences, increasing demand for bakery and confectionery products, and thus increasing demand for confectionery filling.

Consumers' increased purchasing of bakery and confectionery products has fueled the worldwide confectionery filling market. Confectionery fillings are in high demand owing to increasing trend of decorative food products. The rising popularity of cookies, cakes, and muffins is driving the market for more filling.

To meet the demand of health-conscious consumers, manufacturers are offering filling with less fat and fewer calories. This increases the shelf life of the product while also improving the flavor. Demand for quick-to-use products and flavored foods are propelling the global confectionery-filling market forward. Rapid growth in the chocolate industry in many regions is contributing to the expansion of the confectionery filling market.

Furthermore, players are taking various initiatives to expand their reach in various parts of the globe. For instance, In November 2021, Cargill surged its Asian manufacturing facilities with a significant investment of $35 million expansion of its production facility in Port Klang, Malaysia, for specialty fats within confectionery. The expansion is aimed at significantly expanding the overall product portfolio.

What are the Prevailing Opportunities in the Global Confectionery Fillings Market?

Presence of Untapped Opportunities in Developing Countries to act as Significant Opportunities to the Market

The rising income has elevated the living standards and employment rates in developing regions, resulting in a change in lifestyle with hectic work schedules. Eating habits have been changed from regular meals to fast food and convenience foods, which is boosting fillings in the market. Developing markets provide a higher potential for better market penetration, while in developed markets, innovation in new flavors and healthy ingredients drive market growth.

Players in the market are taking initiatives to launch new products, which are projected to offer remunerative opportunities to the market in the forecast period. For instance, Del Monte, a known brand in the processed food and beverages industry in India, launched a new Fruit Fillings range which is a vital ingredient used by the bakery and confectionery industry all over the world.

Get the data you need at a Fraction of the cost

Personalize your report by choosing insights you need
and save 40%!

What are the Factors Hampering the Global Confectionery Fillings Market?

Strict Adherence Due to International Quality Standards and Regulations to Hinder the Market

The ingredients used in the manufacturing of fillings and toppings for confectionery, bakery, and convenience food products are put through strict health and safety filters based on the governmental regulations in each country. Standards set by authorities for the classification and usage levels differ from respective authoritative bodies and act as a serious restrain to enterprises for streamlining product developments.

For instance, the Environmental Protection Agency and the Food and Drug Administration are constantly examining bakeries' operations and implementing new rules that raise production expenses and thus, affect the growth of the bakery industry in the market.

Segmentation Analysis

Which Product Type Segment is expected to lead the Global Confectionery Fillings Market?

Nut-based Confectionery Fillings to remain most sought after

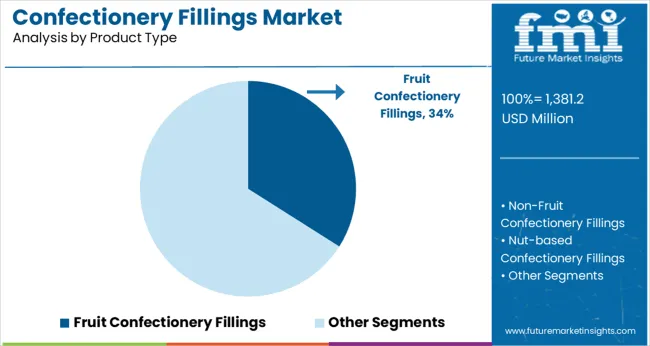
Based on product type, the nut-based fillings segment is projected to lead the global Confectionery Fillings market. As per the analysis, the segment is anticipated to expand at a CAGR of 9% during the forecast period from 2022 to 2032.

Traditionally, chocolate and vanilla fillings were available, but with changing consumer eating habits, there is a greater need for unusual flavors. Consumers are drawn to products with eye-catching content. Consumers are moving their attention away from typical chocolate-vanilla flavors and toward more inventive and fruit-based fillings.

Because of its distinct flavor and texture, the nut-based confectionery filling is gaining favor among consumers. The worldwide confectionery filling market is predicted to develop as the aesthetic attractiveness of confectionery goods improves and baking and confectionery product consumption rises.
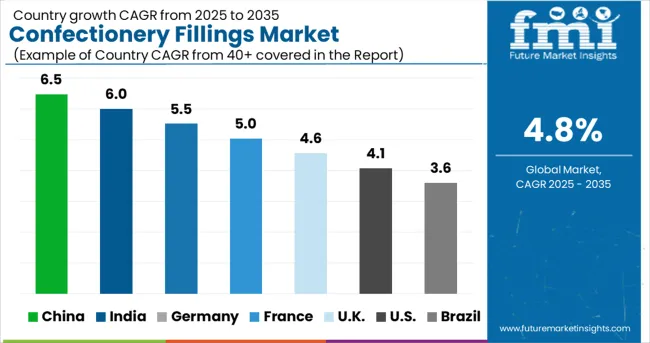
Regional Analysis

How is North America Contributing to the Development of the Confectionery Fillings Market?

Growing Popularity of Nut-Based Confectionery Fillings to Help Bolster the Regional Market

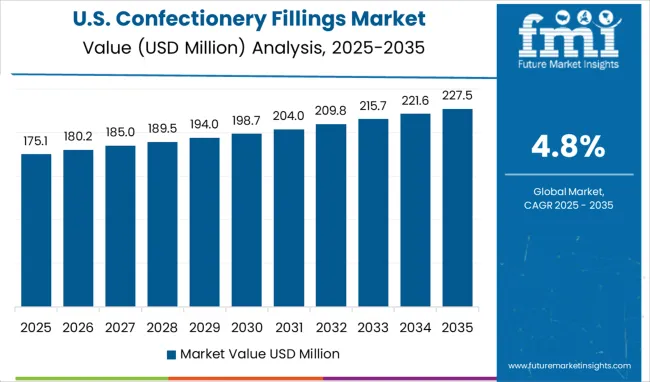
According to the analysis, North America is projected to garner about 29.8% of the global revenue in 2022. The U.S is expected to make the largest contribution to developing the market during the forecast period. The growth of the market can be attributed to the increasing popularity of nut-based confectionery fillings. Another factor contributing to the regional market development is the increasing demand for the combination of candy and nuts.

Also, acquisitions among players have also played an important role in strengthening the regional market during the forecast period. For instance, in August 2021, Bake’n Joy Foods, Inc. announced the acquisition of LandM Baking, expanding industry reach in terms of product category and distribution.

What is the Status of the Confectionery Fillings Market in Europe?

Rapid Growth of Chocolate Industry to Favor the Market in Europe

Europe has the largest market share, accumulating a revenue share of 33.7%, attributed to an uptick in the working population in Europe is shifting consumer food preferences, increasing demand for bakery and confectionery products, and thus increasing demand for confectionery filling. Rapid growth in the European chocolate industry is a factor driving the confectionery filling market. The country has a strong preference for EU-produced chocolates, having previously relied on Ukraine.

Germany is a major supplier of chocolate to Russia. Snack bar consumption in the Russian Federation, on the other hand, has been increasing, with natives eating healthier. The Russian snack bar market has been driven by a high demand for GMO-free, gluten-free, and free of artificial preservatives, dyes, flavors, and emulsifiers. Bite, a domestic Russian brand in fruit and nut bars, for example, has been offering products that are completely natural, sugar-free, and high in protein, fiber, omega-3, and omega-6 fatty acids.

Where does Asia Pacific stand in the Global Confectionery Fillings Market?

Expanding Population and Rising Disposable Income to Boost the APAC Market

The Asia Pacific region is expected to grow at the fastest rate due to its rapidly growing population and significant demand over the forecast period. Due to the popularity of vegetable flavors among the country's young demographics, India is expected to grow at a faster rate than China.

Another projected lucrative market is Japan. Over the forecast period, Japan is expected to exhibit high growth due to rising demand for chocolate-based fillings and bakery products among young consumers across the region.
How are Startups Expanding the Global Confectionery Fillings Market?

Funday Natural Sweets, Stemsugar, Zveetz, Trupo Treats, AAL MIR Trading, Clasen Quality Chocolate, and Loynds, are some of the emerging names in the global confectionery fillings market.
  • Trupo Treats is a US-based company, established in 2020. It raised US$ 350,000 in 2022. Trupo Treats currently offers a variety of vegan milk chocolate products including their Mylk Chocolate Wafer Bar, Mylk Chocolate Caramel Cookie Bar, Mylk Chocolate Rice Crunch Bar, and Mylk Chocolate Bar.

Competition Analysis

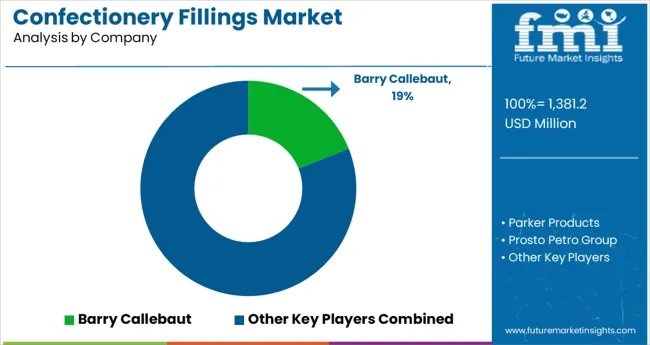
Parker Products, Prosto Petro Group, Fuji Oil Europe, BARRY CALLEBAUT, Domson, Belgo Star, Clasen Quality Coating, Toje, Sirmulis, AAK, Alsino, Zentis, Cargill, and many other key market players are among the key players in the global confectionery fillings market. Some of the recent developments in the global confectionery fillings market are:

  • In February 2022, Dawn Foods has introduced a new line of fat-based, pre-and post-bake, ready-to-use Delicream cocoa fillings for croissants, cookies or muffins, and other sweet bakery items.
  • In March 2021, The Barry Callebaut Group will open new chocolate and compound manufacturing plant in Baramati, its third such facility in India and its largest investment in the country.
  • In May 2021, ZeelIndia purchased John Morley's assets, including fruit filling, fruit soaking, and mac paste. The agreement aimed to expand the company's offerings to customers in the industrial, craft, wholesale, and in-store bakery sectors across the country.

Report Scope

Report Attribute Details
Growth Rate CAGR of 4.8% from 2022 to 2032
Market Value in 2022 US$ 1,200 Million
Market Value in 2032 US$ 1,917.8 Million
Base Year for Estimation 2021
Historical Data 2017-2021
Forecast Period 2022-2032
Quantitative Units US$ Million for Value
Report Coverage Revenue Forecast, Volume Forecast, Company Ranking, Competitive Landscape, Growth Factors, Trends and Pricing Analysis
Segments Covered
  • Product Type
  • Application Type
  • Form Type
  • Distribution Channel Type
  • Region
Regions Covered
  • North America
  • Europe
  • Asia Pacific
  • Latin America
  • Middle East & Africa
Key Countries Profiled
  • USA
  • Canada
  • Mexico
  • Brazil
  • Germany
  • France
  • Italy
  • Spain
  • UK
  • China
  • Japan
  • South Korea
  • Malaysia
  • Singapore
  • Australia
  • New Zealand
  • GCC
  • South Africa
  • Israel
Key Companies Profiled
  • Parker Products
  • Prosto Petro Group
  • BARRY CALLEBAUT
  • Domson
  • Belgo Star
  • Clasen Quality Coating
  • Toje
  • Sirmulis
  • AAK
  • Alsino
  • Zentis
  • Cargill
Report Customization & Pricing Available upon Request

Key Segments Covered in the Confectionery Fillings Industry Report

Confectionery Fillings Market by Product Type:

  • Fruit Confectionery Fillings
  • Non-Fruit Confectionery Fillings
  • Nut-based Confectionery Fillings

Confectionery Fillings Market by Application Type:

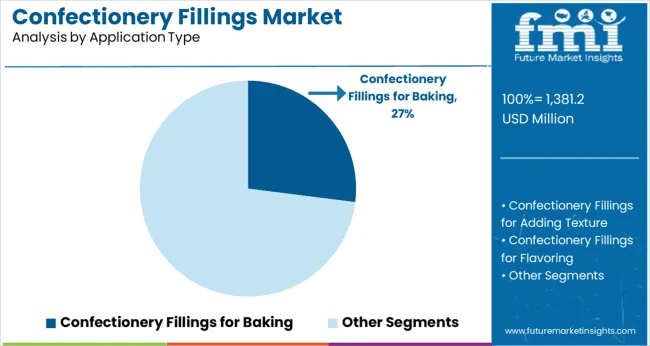
  • Confectionery Fillings for Adding Texture
  • Confectionery Fillings for Flavoring
  • Confectionery Fillings for Decorating
  • Confectionery Fillings for Baking
  • Confectionery Fillings for Other Applications

Confectionery Fillings Market by Form Type:

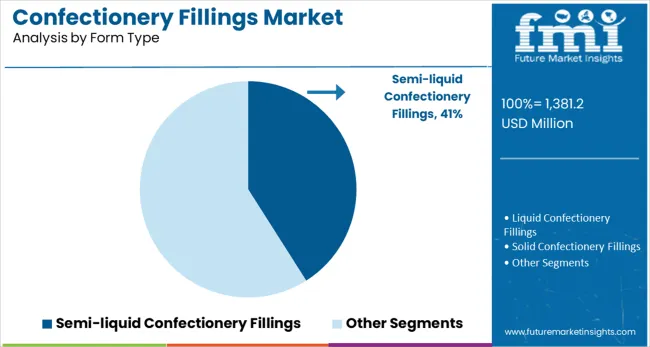
  • Liquid Confectionery Fillings
  • Semi-liquid Confectionery Fillings
  • Solid Confectionery Fillings

Confectionery Fillings Market by Distribution Channel Type:

  • Confectionery Fillings Sales via Wholesaler/Distributor
  • Confectionery Fillings Sales via Modern Trade
  • Confectionery Fillings Sales via Convenience Stores
  • Confectionery Fillings Sales via Online Sales
  • Confectionery Fillings Sales via Other Sales Channels

Confectionery Fillings Market By Region:

  • North America Confectionery Fillings Market
  • Latin America Confectionery Fillings Market
  • Europe Confectionery Fillings Market
  • Asia Pacific Confectionery Fillings Market
  • Middle East and Africa Confectionery Fillings Market

Frequently Asked Questions

What is the Estimated Market Value of the Global Confectionery Fillings Market in 2032?

The global confectionery fillings market is expected to secure US$ 1,917.8 Million during the forecast period.

What is the Estimated Size of the Global Confectionery Fillings Market in 2022?

The global confectionery fillings market is expected to secure US$ 1,200 in 2022

Who are the Key Participants of the Global Confectionery Fillings market?

Parker Products, Prosto Petro Group, Fuji Oil Europe, BARRY CALLEBAUT, and Domson, Belgo Star are some of the known players in the global confectionery fillings market.

Table of Content

1. Executive Summary

    1.1. Global Market Outlook

    1.2. Demand-side Trends

    1.3. Supply-side Trends

    1.4. Technology Roadmap Analysis

    1.5. Analysis and Recommendations

2. Market Overview

    2.1. Market Coverage / Taxonomy

    2.2. Market Definition / Scope / Limitations

3. Market Background

    3.1. Market Dynamics

        3.1.1. Drivers

        3.1.2. Restraints

        3.1.3. Opportunity

        3.1.4. Trends

    3.2. Scenario Forecast

        3.2.1. Demand in Optimistic Scenario

        3.2.2. Demand in Likely Scenario

        3.2.3. Demand in Conservative Scenario

    3.3. Opportunity Map Analysis

    3.4. Product Life Cycle Analysis

    3.5. Supply Chain Analysis

        3.5.1. Supply Side Participants and their Roles

            3.5.1.1. Producers

            3.5.1.2. Mid-Level Participants (Traders/ Agents/ Brokers)

            3.5.1.3. Wholesalers and Distributors

        3.5.2. Value Added and Value Created at Node in the Supply Chain

        3.5.3. List of Raw Material Suppliers

        3.5.4. List of Existing and Potential Buyer’s

    3.6. Investment Feasibility Matrix

    3.7. Value Chain Analysis

        3.7.1. Profit Margin Analysis

        3.7.2. Wholesalers and Distributors

        3.7.3. Retailers

    3.8. PESTLE and Porter’s Analysis

    3.9. Regulatory Landscape

        3.9.1. By Key Regions

        3.9.2. By Key Countries

    3.10. Regional Parent Market Outlook

    3.11. Production and Consumption Statistics

    3.12. Import and Export Statistics

4. Global Market Analysis 2016-2021 and Forecast, 2022-2032

    4.1. Historical Market Size Value (US$ Mn) & Volume (Tons) Analysis, 2017-2021

    4.2. Current and Future Market Size Value (US$ Mn) & Volume (Tons) Projections, 2022-2032

        4.2.1. Y-o-Y Growth Trend Analysis

        4.2.2. Absolute $ Opportunity Analysis

5. Global Market Analysis 2016-2021 and Forecast 2022-2032, By Product Type

    5.1. Introduction / Key Findings

    5.2. Historical Market Size Value (US$ Mn) & Volume (Tons) Analysis By Product Type, 2017-2021

    5.3. Current and Future Market Size Value (US$ Mn) & Volume (Tons) Analysis and Forecast By Product Type, 2022-2032

        5.3.1. Fruit Filling

        5.3.2. Non-fruit fillings

        5.3.3. Nut-based fillings

    5.4. Y-o-Y Growth Trend Analysis By Product Type, 2017-2021

    5.5. Absolute $ Opportunity Analysis By Product Type, 2022-2032

6. Global Market Analysis 2016-2021 and Forecast 2022-2032, By Application Type

    6.1. Introduction / Key Findings

    6.2. Historical Market Size Value (US$ Mn) & Volume (Tons) Analysis By Application Type, 2017-2021

    6.3. Current and Future Market Size Value (US$ Mn) & Volume (Tons) Analysis and Forecast By Application Type, 2022-2032

        6.3.1. Adding texture

        6.3.2. Flavoring

        6.3.3. Decorating

        6.3.4. For Baking

        6.3.5. others

    6.4. Y-o-Y Growth Trend Analysis By Application Type, 2017-2021

    6.5. Absolute $ Opportunity Analysis By Application Type, 2022-2032

7. Global Market Analysis 2016-2021 and Forecast 2022-2032, By Form Type

    7.1. Introduction / Key Findings

    7.2. Historical Market Size Value (US$ Mn) & Volume (Tons) Analysis By Form Type, 2017-2021

    7.3. Current and Future Market Size Value (US$ Mn) & Volume (Tons) Analysis and Forecast By Form Type, 2022-2032

        7.3.1. Liquid

        7.3.2. Semi-liquid

        7.3.3. Solid

    7.4. Y-o-Y Growth Trend Analysis By Form Type, 2017-2021

    7.5. Absolute $ Opportunity Analysis By Form Type, 2022-2032

8. Global Market Analysis 2016-2021 and Forecast 2022-2032, By Distribution Channel Type

    8.1. Introduction / Key Findings

    8.2. Historical Market Size Value (US$ Mn) & Volume (Tons) Analysis By Distribution Channel Type, 2017-2021

    8.3. Current and Future Market Size Value (US$ Mn) & Volume (Tons) Analysis and Forecast By Distribution Channel Type, 2022-2032

        8.3.1. Wholesaler/Distributor

        8.3.2. Modern Trade

        8.3.3. Convenience Stores

        8.3.4. Online Sales

        8.3.5. Other Sales Channel

    8.4. Y-o-Y Growth Trend Analysis By Distribution Channel Type, 2017-2021

    8.5. Absolute $ Opportunity Analysis By Distribution Channel Type, 2022-2032

9. Global Market Analysis 2016-2021 and Forecast 2022-2032, By Region

    9.1. Introduction

    9.2. Historical Market Size Value (US$ Mn) & Volume (Tons) Analysis By Region, 2017-2021

    9.3. Current Market Size Value (US$ Mn) & Volume (Tons) Analysis and Forecast By Region, 2022-2032

        9.3.1. North America

        9.3.2. Latin America

        9.3.3. Europe

        9.3.4. Asia Pacific

        9.3.5. MEA

    9.4. Market Attractiveness Analysis By Region

10. North America Market Analysis 2016-2021 and Forecast 2022-2032, By Country

    10.1. Historical Market Size Value (US$ Mn) & Volume (Tons) Trend Analysis By Market Taxonomy, 2017-2021

    10.2. Market Size Value (US$ Mn) & Volume (Tons) Forecast By Market Taxonomy, 2022-2032

        10.2.1. By Country

            10.2.1.1. U.S.

            10.2.1.2. Canada

        10.2.2. By Product Type

        10.2.3. By Application Type

        10.2.4. By Form Type

        10.2.5. By Distribution Channel Type

    10.3. Market Attractiveness Analysis

        10.3.1. By Country

        10.3.2. By Product Type

        10.3.3. By Application Type

        10.3.4. By Form Type

        10.3.5. By Distribution Channel Type

    10.4. Key Takeaways

11. Latin America Market Analysis 2016-2021 and Forecast 2022-2032, By Country

    11.1. Historical Market Size Value (US$ Mn) & Volume (Tons) Trend Analysis By Market Taxonomy, 2017-2021

    11.2. Market Size Value (US$ Mn) & Volume (Tons) Forecast By Market Taxonomy, 2022-2032

        11.2.1. By Country

            11.2.1.1. Brazil

            11.2.1.2. Mexico

            11.2.1.3. Rest of Latin America

        11.2.2. By Product Type

        11.2.3. By Application Type

        11.2.4. By Form Type

        11.2.5. By Distribution Channel Type

    11.3. Market Attractiveness Analysis

        11.3.1. By Country

        11.3.2. By Product Type

        11.3.3. By Application Type

        11.3.4. By Form Type

        11.3.5. By Distribution Channel Type

    11.4. Key Takeaways

12. Europe Market Analysis 2016-2021 and Forecast 2022-2032, By Country

    12.1. Historical Market Size Value (US$ Mn) & Volume (Tons) Trend Analysis By Market Taxonomy, 2017-2021

    12.2. Market Size Value (US$ Mn) & Volume (Tons) Forecast By Market Taxonomy, 2022-2032

        12.2.1. By Country

            12.2.1.1. Germany

            12.2.1.2. U.K.

            12.2.1.3. France

            12.2.1.4. Spain

            12.2.1.5. Italy

            12.2.1.6. Rest of Europe

        12.2.2. By Product Type

        12.2.3. By Application Type

        12.2.4. By Form Type

        12.2.5. By Distribution Channel Type

    12.3. Market Attractiveness Analysis

        12.3.1. By Country

        12.3.2. By Product Type

        12.3.3. By Application Type

        12.3.4. By Form Type

        12.3.5. By Distribution Channel Type

    12.4. Key Takeaways

13. Asia Pacific Market Analysis 2016-2021 and Forecast 2022-2032, By Country

    13.1. Historical Market Size Value (US$ Mn) & Volume (Tons) Trend Analysis By Market Taxonomy, 2017-2021

    13.2. Market Size Value (US$ Mn) & Volume (Tons) Forecast By Market Taxonomy, 2022-2032

        13.2.1. By Country

            13.2.1.1. China

            13.2.1.2. Japan

            13.2.1.3. South Korea

            13.2.1.4. Malaysia

            13.2.1.5. Singapore

            13.2.1.6. Australia

            13.2.1.7. New Zealand

            13.2.1.8. Rest of APAC

        13.2.2. By Product Type

        13.2.3. By Application Type

        13.2.4. By Form Type

        13.2.5. By Distribution Channel Type

    13.3. Market Attractiveness Analysis

        13.3.1. By Country

        13.3.2. By Product Type

        13.3.3. By Application Type

        13.3.4. By Form Type

        13.3.5. By Distribution Channel Type

    13.4. Key Takeaways

14. MEA Market Analysis 2016-2021 and Forecast 2022-2032, By Country

    14.1. Historical Market Size Value (US$ Mn) & Volume (Tons) Trend Analysis By Market Taxonomy, 2017-2021

    14.2. Market Size Value (US$ Mn) & Volume (Tons) Forecast By Market Taxonomy, 2022-2032

        14.2.1. By Country

            14.2.1.1. GCC Countries

            14.2.1.2. South Africa

            14.2.1.3. Israel

            14.2.1.4. Rest of MEA

        14.2.2. By Product Type

        14.2.3. By Application Type

        14.2.4. By Form Type

        14.2.5. By Distribution Channel Type

    14.3. Market Attractiveness Analysis

        14.3.1. By Country

        14.3.2. By Product Type

        14.3.3. By Application Type

        14.3.4. By Form Type

        14.3.5. By Distribution Channel Type

    14.4. Key Takeaways

15. Key Countries Market Analysis

    15.1. U.S.

        15.1.1. Pricing Analysis

        15.1.2. Market Share Analysis, 2021

            15.1.2.1. By Product Type

            15.1.2.2. By Application Type

            15.1.2.3. By Form Type

            15.1.2.4. By Distribution Channel Type

    15.2. Canada

        15.2.1. Pricing Analysis

        15.2.2. Market Share Analysis, 2021

            15.2.2.1. By Product Type

            15.2.2.2. By Application Type

            15.2.2.3. By Form Type

            15.2.2.4. By Distribution Channel Type

    15.3. Brazil

        15.3.1. Pricing Analysis

        15.3.2. Market Share Analysis, 2021

            15.3.2.1. By Product Type

            15.3.2.2. By Application Type

            15.3.2.3. By Form Type

            15.3.2.4. By Distribution Channel Type

    15.4. Mexico

        15.4.1. Pricing Analysis

        15.4.2. Market Share Analysis, 2021

            15.4.2.1. By Product Type

            15.4.2.2. By Application Type

            15.4.2.3. By Form Type

            15.4.2.4. By Distribution Channel Type

    15.5. Germany

        15.5.1. Pricing Analysis

        15.5.2. Market Share Analysis, 2021

            15.5.2.1. By Product Type

            15.5.2.2. By Application Type

            15.5.2.3. By Form Type

            15.5.2.4. By Distribution Channel Type

    15.6. U.K.

        15.6.1. Pricing Analysis

        15.6.2. Market Share Analysis, 2021

            15.6.2.1. By Product Type

            15.6.2.2. By Application Type

            15.6.2.3. By Form Type

            15.6.2.4. By Distribution Channel Type

    15.7. France

        15.7.1. Pricing Analysis

        15.7.2. Market Share Analysis, 2021

            15.7.2.1. By Product Type

            15.7.2.2. By Application Type

            15.7.2.3. By Form Type

            15.7.2.4. By Distribution Channel Type

    15.8. Spain

        15.8.1. Pricing Analysis

        15.8.2. Market Share Analysis, 2021

            15.8.2.1. By Product Type

            15.8.2.2. By Application Type

            15.8.2.3. By Form Type

            15.8.2.4. By Distribution Channel Type

    15.9. Italy

        15.9.1. Pricing Analysis

        15.9.2. Market Share Analysis, 2021

            15.9.2.1. By Product Type

            15.9.2.2. By Application Type

            15.9.2.3. By Form Type

            15.9.2.4. By Distribution Channel Type

    15.10. China

        15.10.1. Pricing Analysis

        15.10.2. Market Share Analysis, 2021

            15.10.2.1. By Product Type

            15.10.2.2. By Application Type

            15.10.2.3. By Form Type

            15.10.2.4. By Distribution Channel Type

    15.11. Japan

        15.11.1. Pricing Analysis

        15.11.2. Market Share Analysis, 2021

            15.11.2.1. By Product Type

            15.11.2.2. By Application Type

            15.11.2.3. By Form Type

            15.11.2.4. By Distribution Channel Type

    15.12. South Korea

        15.12.1. Pricing Analysis

        15.12.2. Market Share Analysis, 2021

            15.12.2.1. By Product Type

            15.12.2.2. By Application Type

            15.12.2.3. By Form Type

            15.12.2.4. By Distribution Channel Type

    15.13. Malaysia

        15.13.1. Pricing Analysis

        15.13.2. Market Share Analysis, 2021

            15.13.2.1. By Product Type

            15.13.2.2. By Application Type

            15.13.2.3. By Form Type

            15.13.2.4. By Distribution Channel Type

    15.14. Singapore

        15.14.1. Pricing Analysis

        15.14.2. Market Share Analysis, 2021

            15.14.2.1. By Product Type

            15.14.2.2. By Application Type

            15.14.2.3. By Form Type

            15.14.2.4. By Distribution Channel Type

    15.15. Australia

        15.15.1. Pricing Analysis

        15.15.2. Market Share Analysis, 2021

            15.15.2.1. By Product Type

            15.15.2.2. By Application Type

            15.15.2.3. By Form Type

            15.15.2.4. By Distribution Channel Type

    15.16. New Zealand

        15.16.1. Pricing Analysis

        15.16.2. Market Share Analysis, 2021

            15.16.2.1. By Product Type

            15.16.2.2. By Application Type

            15.16.2.3. By Form Type

            15.16.2.4. By Distribution Channel Type

    15.17. GCC Countries

        15.17.1. Pricing Analysis

        15.17.2. Market Share Analysis, 2021

            15.17.2.1. By Product Type

            15.17.2.2. By Application Type

            15.17.2.3. By Form Type

            15.17.2.4. By Distribution Channel Type

    15.18. South Africa

        15.18.1. Pricing Analysis

        15.18.2. Market Share Analysis, 2021

            15.18.2.1. By Product Type

            15.18.2.2. By Application Type

            15.18.2.3. By Form Type

            15.18.2.4. By Distribution Channel Type

    15.19. Israel

        15.19.1. Pricing Analysis

        15.19.2. Market Share Analysis, 2021

            15.19.2.1. By Product Type

            15.19.2.2. By Application Type

            15.19.2.3. By Form Type

            15.19.2.4. By Distribution Channel Type

16. Market Structure Analysis

    16.1. Competition Dashboard

    16.2. Competition Benchmarking

    16.3. Market Share Analysis of Top Players

        16.3.1. By Regional

        16.3.2. By Product Type

        16.3.3. By Application Type

        16.3.4. By Form Type

        16.3.5. By Distribution Channel Type

17. Competition Analysis

    17.1. Competition Deep Dive

        17.1.1. Parker Products

            17.1.1.1. Overview

            17.1.1.2. Product Portfolio

            17.1.1.3. Profitability by Market Segments

            17.1.1.4. Sales Footprint

            17.1.1.5. Strategy Overview

                17.1.1.5.1. Marketing Strategy

                17.1.1.5.2. Product Strategy

                17.1.1.5.3. Channel Strategy

        17.1.2. Prosto Petro Group.

            17.1.2.1. Overview

            17.1.2.2. Product Portfolio

            17.1.2.3. Profitability by Market Segments

            17.1.2.4. Sales Footprint

            17.1.2.5. Strategy Overview

                17.1.2.5.1. Marketing Strategy

                17.1.2.5.2. Product Strategy

                17.1.2.5.3. Channel Strategy

        17.1.3. Fuji Oil Europe

            17.1.3.1. Overview

            17.1.3.2. Product Portfolio

            17.1.3.3. Profitability by Market Segments

            17.1.3.4. Sales Footprint

            17.1.3.5. Strategy Overview

                17.1.3.5.1. Marketing Strategy

                17.1.3.5.2. Product Strategy

                17.1.3.5.3. Channel Strategy

        17.1.4. BARRY CALLEBAUT

            17.1.4.1. Overview

            17.1.4.2. Product Portfolio

            17.1.4.3. Profitability by Market Segments

            17.1.4.4. Sales Footprint

            17.1.4.5. Strategy Overview

                17.1.4.5.1. Marketing Strategy

                17.1.4.5.2. Product Strategy

                17.1.4.5.3. Channel Strategy

        17.1.5. Domson

            17.1.5.1. Overview

            17.1.5.2. Product Portfolio

            17.1.5.3. Profitability by Market Segments

            17.1.5.4. Sales Footprint

            17.1.5.5. Strategy Overview

                17.1.5.5.1. Marketing Strategy

                17.1.5.5.2. Product Strategy

                17.1.5.5.3. Channel Strategy

        17.1.6. Belgo Star

            17.1.6.1. Overview

            17.1.6.2. Product Portfolio

            17.1.6.3. Profitability by Market Segments

            17.1.6.4. Sales Footprint

            17.1.6.5. Strategy Overview

                17.1.6.5.1. Marketing Strategy

                17.1.6.5.2. Product Strategy

                17.1.6.5.3. Channel Strategy

        17.1.7. Clasen Quality Coating

            17.1.7.1. Overview

            17.1.7.2. Product Portfolio

            17.1.7.3. Profitability by Market Segments

            17.1.7.4. Sales Footprint

            17.1.7.5. Strategy Overview

                17.1.7.5.1. Marketing Strategy

                17.1.7.5.2. Product Strategy

                17.1.7.5.3. Channel Strategy

        17.1.8. Toje

            17.1.8.1. Overview

            17.1.8.2. Product Portfolio

            17.1.8.3. Profitability by Market Segments

            17.1.8.4. Sales Footprint

            17.1.8.5. Strategy Overview

                17.1.8.5.1. Marketing Strategy

                17.1.8.5.2. Product Strategy

                17.1.8.5.3. Channel Strategy

        17.1.9. Sirmulis

            17.1.9.1. Overview

            17.1.9.2. Product Portfolio

            17.1.9.3. Profitability by Market Segments

            17.1.9.4. Sales Footprint

            17.1.9.5. Strategy Overview

                17.1.9.5.1. Marketing Strategy

                17.1.9.5.2. Product Strategy

                17.1.9.5.3. Channel Strategy

        17.1.10. AAK

            17.1.10.1. Overview

            17.1.10.2. Product Portfolio

            17.1.10.3. Profitability by Market Segments

            17.1.10.4. Sales Footprint

            17.1.10.5. Strategy Overview

                17.1.10.5.1. Marketing Strategy

                17.1.10.5.2. Product Strategy

                17.1.10.5.3. Channel Strategy

        17.1.11. Alsino

            17.1.11.1. Overview

            17.1.11.2. Product Portfolio

            17.1.11.3. Profitability by Market Segments

            17.1.11.4. Sales Footprint

            17.1.11.5. Strategy Overview

                17.1.11.5.1. Marketing Strategy

                17.1.11.5.2. Product Strategy

                17.1.11.5.3. Channel Strategy

        17.1.12. Zentis

            17.1.12.1. Overview

            17.1.12.2. Product Portfolio

            17.1.12.3. Profitability by Market Segments

            17.1.12.4. Sales Footprint

            17.1.12.5. Strategy Overview

                17.1.12.5.1. Marketing Strategy

                17.1.12.5.2. Product Strategy

                17.1.12.5.3. Channel Strategy

        17.1.13. Cargill

            17.1.13.1. Overview

            17.1.13.2. Product Portfolio

            17.1.13.3. Profitability by Market Segments

            17.1.13.4. Sales Footprint

            17.1.13.5. Strategy Overview

                17.1.13.5.1. Marketing Strategy

                17.1.13.5.2. Product Strategy

                17.1.13.5.3. Channel Strategy

18. Assumptions & Acronyms Used

19. Research Methodology

Don't pay for what you don't need

Customize your report by selecting specific countries or regions and save 30%!

List of Tables

Table 1: Global Market Value (US$ Mn) Forecast by Region, 2016-2032

Table 2: Global Market Volume (Tons) Forecast by Region, 2016-2032

Table 3: Global Market Value (US$ Mn) Forecast by Product Type, 2016-2032

Table 4: Global Market Volume (Tons) Forecast by Product Type, 2016-2032

Table 5: Global Market Value (US$ Mn) Forecast by Application Type, 2016-2032

Table 6: Global Market Volume (Tons) Forecast by Application Type, 2016-2032

Table 7: Global Market Value (US$ Mn) Forecast by Form Type, 2016-2032

Table 8: Global Market Volume (Tons) Forecast by Form Type, 2016-2032

Table 9: Global Market Value (US$ Mn) Forecast by Distribution Channel Type, 2016-2032

Table 10: Global Market Volume (Tons) Forecast by Distribution Channel Type, 2016-2032

Table 11: North America Market Value (US$ Mn) Forecast by Country, 2016-2032

Table 12: North America Market Volume (Tons) Forecast by Country, 2016-2032

Table 13: North America Market Value (US$ Mn) Forecast by Product Type, 2016-2032

Table 14: North America Market Volume (Tons) Forecast by Product Type, 2016-2032

Table 15: North America Market Value (US$ Mn) Forecast by Application Type, 2016-2032

Table 16: North America Market Volume (Tons) Forecast by Application Type, 2016-2032

Table 17: North America Market Value (US$ Mn) Forecast by Form Type, 2016-2032

Table 18: North America Market Volume (Tons) Forecast by Form Type, 2016-2032

Table 19: North America Market Value (US$ Mn) Forecast by Distribution Channel Type, 2016-2032

Table 20: North America Market Volume (Tons) Forecast by Distribution Channel Type, 2016-2032

Table 21: Latin America Market Value (US$ Mn) Forecast by Country, 2016-2032

Table 22: Latin America Market Volume (Tons) Forecast by Country, 2016-2032

Table 23: Latin America Market Value (US$ Mn) Forecast by Product Type, 2016-2032

Table 24: Latin America Market Volume (Tons) Forecast by Product Type, 2016-2032

Table 25: Latin America Market Value (US$ Mn) Forecast by Application Type, 2016-2032

Table 26: Latin America Market Volume (Tons) Forecast by Application Type, 2016-2032

Table 27: Latin America Market Value (US$ Mn) Forecast by Form Type, 2016-2032

Table 28: Latin America Market Volume (Tons) Forecast by Form Type, 2016-2032

Table 29: Latin America Market Value (US$ Mn) Forecast by Distribution Channel Type, 2016-2032

Table 30: Latin America Market Volume (Tons) Forecast by Distribution Channel Type, 2016-2032

Table 31: Europe Market Value (US$ Mn) Forecast by Country, 2016-2032

Table 32: Europe Market Volume (Tons) Forecast by Country, 2016-2032

Table 33: Europe Market Value (US$ Mn) Forecast by Product Type, 2016-2032

Table 34: Europe Market Volume (Tons) Forecast by Product Type, 2016-2032

Table 35: Europe Market Value (US$ Mn) Forecast by Application Type, 2016-2032

Table 36: Europe Market Volume (Tons) Forecast by Application Type, 2016-2032

Table 37: Europe Market Value (US$ Mn) Forecast by Form Type, 2016-2032

Table 38: Europe Market Volume (Tons) Forecast by Form Type, 2016-2032

Table 39: Europe Market Value (US$ Mn) Forecast by Distribution Channel Type, 2016-2032

Table 40: Europe Market Volume (Tons) Forecast by Distribution Channel Type, 2016-2032

Table 41: Asia Pacific Market Value (US$ Mn) Forecast by Country, 2016-2032

Table 42: Asia Pacific Market Volume (Tons) Forecast by Country, 2016-2032

Table 43: Asia Pacific Market Value (US$ Mn) Forecast by Product Type, 2016-2032

Table 44: Asia Pacific Market Volume (Tons) Forecast by Product Type, 2016-2032

Table 45: Asia Pacific Market Value (US$ Mn) Forecast by Application Type, 2016-2032

Table 46: Asia Pacific Market Volume (Tons) Forecast by Application Type, 2016-2032

Table 47: Asia Pacific Market Value (US$ Mn) Forecast by Form Type, 2016-2032

Table 48: Asia Pacific Market Volume (Tons) Forecast by Form Type, 2016-2032

Table 49: Asia Pacific Market Value (US$ Mn) Forecast by Distribution Channel Type, 2016-2032

Table 50: Asia Pacific Market Volume (Tons) Forecast by Distribution Channel Type, 2016-2032

Table 51: MEA Market Value (US$ Mn) Forecast by Country, 2016-2032

Table 52: MEA Market Volume (Tons) Forecast by Country, 2016-2032

Table 53: MEA Market Value (US$ Mn) Forecast by Product Type, 2016-2032

Table 54: MEA Market Volume (Tons) Forecast by Product Type, 2016-2032

Table 55: MEA Market Value (US$ Mn) Forecast by Application Type, 2016-2032

Table 56: MEA Market Volume (Tons) Forecast by Application Type, 2016-2032

Table 57: MEA Market Value (US$ Mn) Forecast by Form Type, 2016-2032

Table 58: MEA Market Volume (Tons) Forecast by Form Type, 2016-2032

Table 59: MEA Market Value (US$ Mn) Forecast by Distribution Channel Type, 2016-2032

Table 60: MEA Market Volume (Tons) Forecast by Distribution Channel Type, 2016-2032
Nandini Roy Choudhury

Principal Consultant

Talk to Analyst

Find your sweet spots for generating winning opportunities in this market.

List of Charts

Figure 1: Global Market Value (US$ Mn) by Product Type, 2022-2032

Figure 2: Global Market Value (US$ Mn) by Application Type, 2022-2032

Figure 3: Global Market Value (US$ Mn) by Form Type, 2022-2032

Figure 4: Global Market Value (US$ Mn) by Distribution Channel Type, 2022-2032

Figure 5: Global Market Value (US$ Mn) by Region, 2022-2032

Figure 6: Global Market Value (US$ Mn) Analysis by Region, 2016-2032

Figure 7: Global Market Volume (Tons) Analysis by Region, 2016-2032

Figure 8: Global Market Value Share (%) and BPS Analysis by Region, 2022-2032

Figure 9: Global Market Y-o-Y Growth (%) Projections by Region, 2022-2032

Figure 10: Global Market Value (US$ Mn) Analysis by Product Type, 2016-2032

Figure 11: Global Market Volume (Tons) Analysis by Product Type, 2016-2032

Figure 12: Global Market Value Share (%) and BPS Analysis by Product Type, 2022-2032

Figure 13: Global Market Y-o-Y Growth (%) Projections by Product Type, 2022-2032

Figure 14: Global Market Value (US$ Mn) Analysis by Application Type, 2016-2032

Figure 15: Global Market Volume (Tons) Analysis by Application Type, 2016-2032

Figure 16: Global Market Value Share (%) and BPS Analysis by Application Type, 2022-2032

Figure 17: Global Market Y-o-Y Growth (%) Projections by Application Type, 2022-2032

Figure 18: Global Market Value (US$ Mn) Analysis by Form Type, 2016-2032

Figure 19: Global Market Volume (Tons) Analysis by Form Type, 2016-2032

Figure 20: Global Market Value Share (%) and BPS Analysis by Form Type, 2022-2032

Figure 21: Global Market Y-o-Y Growth (%) Projections by Form Type, 2022-2032

Figure 22: Global Market Value (US$ Mn) Analysis by Distribution Channel Type, 2016-2032

Figure 23: Global Market Volume (Tons) Analysis by Distribution Channel Type, 2016-2032

Figure 24: Global Market Value Share (%) and BPS Analysis by Distribution Channel Type, 2022-2032

Figure 25: Global Market Y-o-Y Growth (%) Projections by Distribution Channel Type, 2022-2032

Figure 26: Global Market Attractiveness by Product Type, 2022-2032

Figure 27: Global Market Attractiveness by Application Type, 2022-2032

Figure 28: Global Market Attractiveness by Form Type, 2022-2032

Figure 29: Global Market Attractiveness by Distribution Channel Type, 2022-2032

Figure 30: Global Market Attractiveness by Region, 2022-2032

Figure 31: North America Market Value (US$ Mn) by Product Type, 2022-2032

Figure 32: North America Market Value (US$ Mn) by Application Type, 2022-2032

Figure 33: North America Market Value (US$ Mn) by Form Type, 2022-2032

Figure 34: North America Market Value (US$ Mn) by Distribution Channel Type, 2022-2032

Figure 35: North America Market Value (US$ Mn) by Country, 2022-2032

Figure 36: North America Market Value (US$ Mn) Analysis by Country, 2016-2032

Figure 37: North America Market Volume (Tons) Analysis by Country, 2016-2032

Figure 38: North America Market Value Share (%) and BPS Analysis by Country, 2022-2032

Figure 39: North America Market Y-o-Y Growth (%) Projections by Country, 2022-2032

Figure 40: North America Market Value (US$ Mn) Analysis by Product Type, 2016-2032

Figure 41: North America Market Volume (Tons) Analysis by Product Type, 2016-2032

Figure 42: North America Market Value Share (%) and BPS Analysis by Product Type, 2022-2032

Figure 43: North America Market Y-o-Y Growth (%) Projections by Product Type, 2022-2032

Figure 44: North America Market Value (US$ Mn) Analysis by Application Type, 2016-2032

Figure 45: North America Market Volume (Tons) Analysis by Application Type, 2016-2032

Figure 46: North America Market Value Share (%) and BPS Analysis by Application Type, 2022-2032

Figure 47: North America Market Y-o-Y Growth (%) Projections by Application Type, 2022-2032

Figure 48: North America Market Value (US$ Mn) Analysis by Form Type, 2016-2032

Figure 49: North America Market Volume (Tons) Analysis by Form Type, 2016-2032

Figure 50: North America Market Value Share (%) and BPS Analysis by Form Type, 2022-2032

Figure 51: North America Market Y-o-Y Growth (%) Projections by Form Type, 2022-2032

Figure 52: North America Market Value (US$ Mn) Analysis by Distribution Channel Type, 2016-2032

Figure 53: North America Market Volume (Tons) Analysis by Distribution Channel Type, 2016-2032

Figure 54: North America Market Value Share (%) and BPS Analysis by Distribution Channel Type, 2022-2032

Figure 55: North America Market Y-o-Y Growth (%) Projections by Distribution Channel Type, 2022-2032

Figure 56: North America Market Attractiveness by Product Type, 2022-2032

Figure 57: North America Market Attractiveness by Application Type, 2022-2032

Figure 58: North America Market Attractiveness by Form Type, 2022-2032

Figure 59: North America Market Attractiveness by Distribution Channel Type, 2022-2032

Figure 60: North America Market Attractiveness by Country, 2022-2032

Figure 61: Latin America Market Value (US$ Mn) by Product Type, 2022-2032

Figure 62: Latin America Market Value (US$ Mn) by Application Type, 2022-2032

Figure 63: Latin America Market Value (US$ Mn) by Form Type, 2022-2032

Figure 64: Latin America Market Value (US$ Mn) by Distribution Channel Type, 2022-2032

Figure 65: Latin America Market Value (US$ Mn) by Country, 2022-2032

Figure 66: Latin America Market Value (US$ Mn) Analysis by Country, 2016-2032

Figure 67: Latin America Market Volume (Tons) Analysis by Country, 2016-2032

Figure 68: Latin America Market Value Share (%) and BPS Analysis by Country, 2022-2032

Figure 69: Latin America Market Y-o-Y Growth (%) Projections by Country, 2022-2032

Figure 70: Latin America Market Value (US$ Mn) Analysis by Product Type, 2016-2032

Figure 71: Latin America Market Volume (Tons) Analysis by Product Type, 2016-2032

Figure 72: Latin America Market Value Share (%) and BPS Analysis by Product Type, 2022-2032

Figure 73: Latin America Market Y-o-Y Growth (%) Projections by Product Type, 2022-2032

Figure 74: Latin America Market Value (US$ Mn) Analysis by Application Type, 2016-2032

Figure 75: Latin America Market Volume (Tons) Analysis by Application Type, 2016-2032

Figure 76: Latin America Market Value Share (%) and BPS Analysis by Application Type, 2022-2032

Figure 77: Latin America Market Y-o-Y Growth (%) Projections by Application Type, 2022-2032

Figure 78: Latin America Market Value (US$ Mn) Analysis by Form Type, 2016-2032

Figure 79: Latin America Market Volume (Tons) Analysis by Form Type, 2016-2032

Figure 80: Latin America Market Value Share (%) and BPS Analysis by Form Type, 2022-2032

Figure 81: Latin America Market Y-o-Y Growth (%) Projections by Form Type, 2022-2032

Figure 82: Latin America Market Value (US$ Mn) Analysis by Distribution Channel Type, 2016-2032

Figure 83: Latin America Market Volume (Tons) Analysis by Distribution Channel Type, 2016-2032

Figure 84: Latin America Market Value Share (%) and BPS Analysis by Distribution Channel Type, 2022-2032

Figure 85: Latin America Market Y-o-Y Growth (%) Projections by Distribution Channel Type, 2022-2032

Figure 86: Latin America Market Attractiveness by Product Type, 2022-2032

Figure 87: Latin America Market Attractiveness by Application Type, 2022-2032

Figure 88: Latin America Market Attractiveness by Form Type, 2022-2032

Figure 89: Latin America Market Attractiveness by Distribution Channel Type, 2022-2032

Figure 90: Latin America Market Attractiveness by Country, 2022-2032

Figure 91: Europe Market Value (US$ Mn) by Product Type, 2022-2032

Figure 92: Europe Market Value (US$ Mn) by Application Type, 2022-2032

Figure 93: Europe Market Value (US$ Mn) by Form Type, 2022-2032

Figure 94: Europe Market Value (US$ Mn) by Distribution Channel Type, 2022-2032

Figure 95: Europe Market Value (US$ Mn) by Country, 2022-2032

Figure 96: Europe Market Value (US$ Mn) Analysis by Country, 2016-2032

Figure 97: Europe Market Volume (Tons) Analysis by Country, 2016-2032

Figure 98: Europe Market Value Share (%) and BPS Analysis by Country, 2022-2032

Figure 99: Europe Market Y-o-Y Growth (%) Projections by Country, 2022-2032

Figure 100: Europe Market Value (US$ Mn) Analysis by Product Type, 2016-2032

Figure 101: Europe Market Volume (Tons) Analysis by Product Type, 2016-2032

Figure 102: Europe Market Value Share (%) and BPS Analysis by Product Type, 2022-2032

Figure 103: Europe Market Y-o-Y Growth (%) Projections by Product Type, 2022-2032

Figure 104: Europe Market Value (US$ Mn) Analysis by Application Type, 2016-2032

Figure 105: Europe Market Volume (Tons) Analysis by Application Type, 2016-2032

Figure 106: Europe Market Value Share (%) and BPS Analysis by Application Type, 2022-2032

Figure 107: Europe Market Y-o-Y Growth (%) Projections by Application Type, 2022-2032

Figure 108: Europe Market Value (US$ Mn) Analysis by Form Type, 2016-2032

Figure 109: Europe Market Volume (Tons) Analysis by Form Type, 2016-2032

Figure 110: Europe Market Value Share (%) and BPS Analysis by Form Type, 2022-2032

Figure 111: Europe Market Y-o-Y Growth (%) Projections by Form Type, 2022-2032

Figure 112: Europe Market Value (US$ Mn) Analysis by Distribution Channel Type, 2016-2032

Figure 113: Europe Market Volume (Tons) Analysis by Distribution Channel Type, 2016-2032

Figure 114: Europe Market Value Share (%) and BPS Analysis by Distribution Channel Type, 2022-2032

Figure 115: Europe Market Y-o-Y Growth (%) Projections by Distribution Channel Type, 2022-2032

Figure 116: Europe Market Attractiveness by Product Type, 2022-2032

Figure 117: Europe Market Attractiveness by Application Type, 2022-2032

Figure 118: Europe Market Attractiveness by Form Type, 2022-2032

Figure 119: Europe Market Attractiveness by Distribution Channel Type, 2022-2032

Figure 120: Europe Market Attractiveness by Country, 2022-2032

Figure 121: Asia Pacific Market Value (US$ Mn) by Product Type, 2022-2032

Figure 122: Asia Pacific Market Value (US$ Mn) by Application Type, 2022-2032

Figure 123: Asia Pacific Market Value (US$ Mn) by Form Type, 2022-2032

Figure 124: Asia Pacific Market Value (US$ Mn) by Distribution Channel Type, 2022-2032

Figure 125: Asia Pacific Market Value (US$ Mn) by Country, 2022-2032

Figure 126: Asia Pacific Market Value (US$ Mn) Analysis by Country, 2016-2032

Figure 127: Asia Pacific Market Volume (Tons) Analysis by Country, 2016-2032

Figure 128: Asia Pacific Market Value Share (%) and BPS Analysis by Country, 2022-2032

Figure 129: Asia Pacific Market Y-o-Y Growth (%) Projections by Country, 2022-2032

Figure 130: Asia Pacific Market Value (US$ Mn) Analysis by Product Type, 2016-2032

Figure 131: Asia Pacific Market Volume (Tons) Analysis by Product Type, 2016-2032

Figure 132: Asia Pacific Market Value Share (%) and BPS Analysis by Product Type, 2022-2032

Figure 133: Asia Pacific Market Y-o-Y Growth (%) Projections by Product Type, 2022-2032

Figure 134: Asia Pacific Market Value (US$ Mn) Analysis by Application Type, 2016-2032

Figure 135: Asia Pacific Market Volume (Tons) Analysis by Application Type, 2016-2032

Figure 136: Asia Pacific Market Value Share (%) and BPS Analysis by Application Type, 2022-2032

Figure 137: Asia Pacific Market Y-o-Y Growth (%) Projections by Application Type, 2022-2032

Figure 138: Asia Pacific Market Value (US$ Mn) Analysis by Form Type, 2016-2032

Figure 139: Asia Pacific Market Volume (Tons) Analysis by Form Type, 2016-2032

Figure 140: Asia Pacific Market Value Share (%) and BPS Analysis by Form Type, 2022-2032

Figure 141: Asia Pacific Market Y-o-Y Growth (%) Projections by Form Type, 2022-2032

Figure 142: Asia Pacific Market Value (US$ Mn) Analysis by Distribution Channel Type, 2016-2032

Figure 143: Asia Pacific Market Volume (Tons) Analysis by Distribution Channel Type, 2016-2032

Figure 144: Asia Pacific Market Value Share (%) and BPS Analysis by Distribution Channel Type, 2022-2032

Figure 145: Asia Pacific Market Y-o-Y Growth (%) Projections by Distribution Channel Type, 2022-2032

Figure 146: Asia Pacific Market Attractiveness by Product Type, 2022-2032

Figure 147: Asia Pacific Market Attractiveness by Application Type, 2022-2032

Figure 148: Asia Pacific Market Attractiveness by Form Type, 2022-2032

Figure 149: Asia Pacific Market Attractiveness by Distribution Channel Type, 2022-2032

Figure 150: Asia Pacific Market Attractiveness by Country, 2022-2032

Figure 151: MEA Market Value (US$ Mn) by Product Type, 2022-2032

Figure 152: MEA Market Value (US$ Mn) by Application Type, 2022-2032

Figure 153: MEA Market Value (US$ Mn) by Form Type, 2022-2032

Figure 154: MEA Market Value (US$ Mn) by Distribution Channel Type, 2022-2032

Figure 155: MEA Market Value (US$ Mn) by Country, 2022-2032

Figure 156: MEA Market Value (US$ Mn) Analysis by Country, 2016-2032

Figure 157: MEA Market Volume (Tons) Analysis by Country, 2016-2032

Figure 158: MEA Market Value Share (%) and BPS Analysis by Country, 2022-2032

Figure 159: MEA Market Y-o-Y Growth (%) Projections by Country, 2022-2032

Figure 160: MEA Market Value (US$ Mn) Analysis by Product Type, 2016-2032

Figure 161: MEA Market Volume (Tons) Analysis by Product Type, 2016-2032

Figure 162: MEA Market Value Share (%) and BPS Analysis by Product Type, 2022-2032

Figure 163: MEA Market Y-o-Y Growth (%) Projections by Product Type, 2022-2032

Figure 164: MEA Market Value (US$ Mn) Analysis by Application Type, 2016-2032

Figure 165: MEA Market Volume (Tons) Analysis by Application Type, 2016-2032

Figure 166: MEA Market Value Share (%) and BPS Analysis by Application Type, 2022-2032

Figure 167: MEA Market Y-o-Y Growth (%) Projections by Application Type, 2022-2032

Figure 168: MEA Market Value (US$ Mn) Analysis by Form Type, 2016-2032

Figure 169: MEA Market Volume (Tons) Analysis by Form Type, 2016-2032

Figure 170: MEA Market Value Share (%) and BPS Analysis by Form Type, 2022-2032

Figure 171: MEA Market Y-o-Y Growth (%) Projections by Form Type, 2022-2032

Figure 172: MEA Market Value (US$ Mn) Analysis by Distribution Channel Type, 2016-2032

Figure 173: MEA Market Volume (Tons) Analysis by Distribution Channel Type, 2016-2032

Figure 174: MEA Market Value Share (%) and BPS Analysis by Distribution Channel Type, 2022-2032

Figure 175: MEA Market Y-o-Y Growth (%) Projections by Distribution Channel Type, 2022-2032

Figure 176: MEA Market Attractiveness by Product Type, 2022-2032

Figure 177: MEA Market Attractiveness by Application Type, 2022-2032

Figure 178: MEA Market Attractiveness by Form Type, 2022-2032

Figure 179: MEA Market Attractiveness by Distribution Channel Type, 2022-2032

Figure 180: MEA Market Attractiveness by Country, 2022-2032

Recommendations

Food and Beverage

Confectionery Market

Published : July 2023

Food and Beverage

Confectionery Ingredients Market

Published : July 2023

Food and Beverage

Confectionery Coating Market

Published : January 2023

Explore Food and Beverage Insights

View Reports

Confectionery Fillings Market