Sales of convenience confectionery products in the United States are estimated at USD 17.1 billion in 2025, with projections indicating a rise to USD 21.9 billion by 2035, reflecting a CAGR of approximately 2.5% over the forecast period. This growth reflects both a stabilizing consumer base and steady per capita consumption across diverse demographic segments.
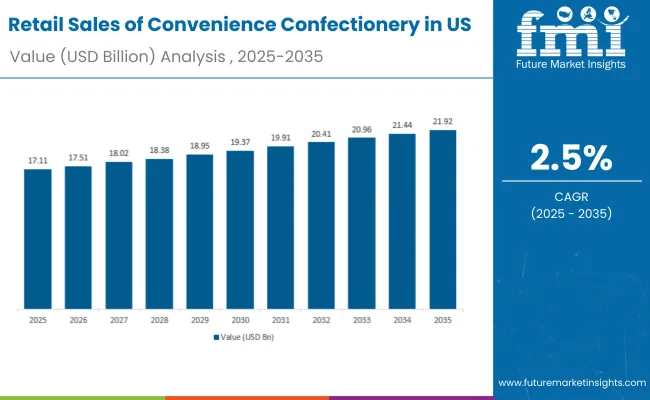
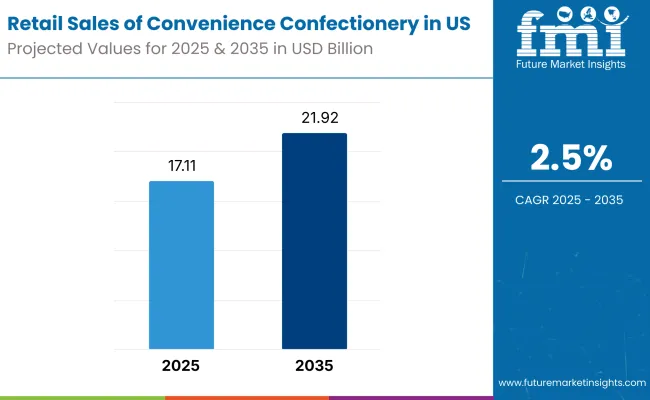
The rise in demand is linked to consistent snacking habits, seasonal consumption patterns, and the premiumization of chocolate offerings. By 2025, per capita consumption in leading USA states such as Texas, California, and Florida averages between 8.2 to 9.1 kilograms annually, with projections reaching 9.8 kilograms by 2035. Texas leads among states, expected to generate USD 2.36 billion in Convenience Confectionery sales by 2035, followed by California (USD 1.75 billion), Florida (USD 1.40 billion), New York (USD 1.11 billion), and Georgia (USD 1.02 billion).
The largest contribution to demand continues to come from chocolate products, which are expected to account for 50% of total sales by 2035, owing to strong brand loyalty, seasonal gifting traditions, and premium positioning. By pack type, single-serve bars and packs represent the dominant format, responsible for 53% of all sales, while multipack bags and seasonal novelty items continue to serve distinct consumption occasions.
Consumer adoption spans all age groups and income levels, with impulse purchasing and seasonal consumption emerging as significant drivers of demand. While health consciousness remains a consideration, the average spending on premium and artisanalConvenience Confectionery has increased from traditional mass offerings. Continued improvements in product innovation, including sugar alternatives and functional ingredients, are expected to sustain consumption across health-conscious households. Regional preferences persist, but per capita demand in high-growth Southern states is approaching levels seen in traditionally strong consumption areas.
The Convenience Confectionery segment in the USA is classified across several segments. By product, the key categories include chocolate bars and premium chocolates, non-chocolate candy including gummies and hard candy, and gum and mints. By pack type, the segment spans single-serve bars and individual packs, peg bags and multipack offerings, and seasonal and novelty packaging.
By consumer profile, the segment covers impulse purchasers, gift buyers, seasonal consumers, health-conscious snackers, and premium chocolate enthusiasts. By region, states such as Texas, California, Florida, New York, and Georgia are included, along with coverage across all 50 states and Washington, D.C.
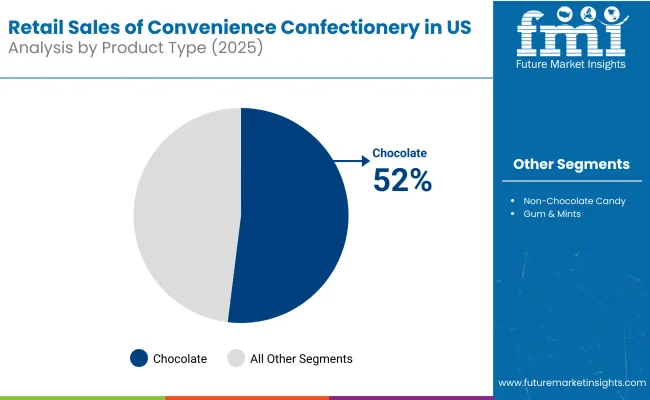
Chocolate products are projected to maintain dominance through 2035, supported by brand recognition, seasonal demand patterns, and premiumization trends. Non-chocolate candy continues growing steadily, serving different taste preferences and age demographics.
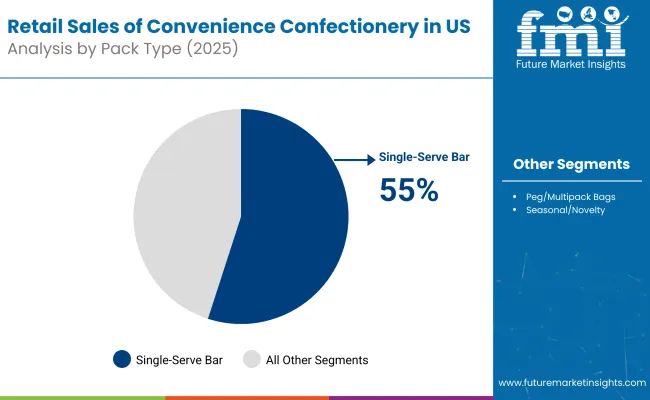
Confectionery products in the USA are packaged across various formats to match consumption occasions and purchase behaviors. Single-serve formats are expected to maintain the primary position through 2035, followed by multipack bags and seasonal packaging.
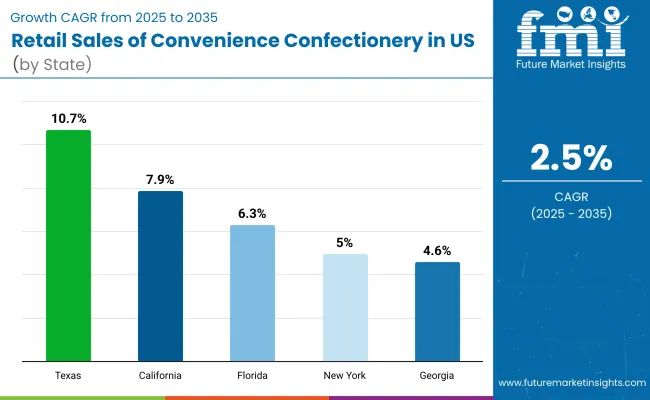
Confectionery sales growth will vary across states, with Southern and Southeastern regions showing stronger expansion due to population growth and changing demographic composition. The table below shows the compound annual growth rate (CAGR) each of the five largest states is expected to record between 2025 and 2035.
Between 2025 and 2035, demand for Convenience Confectionery products is projected to expand across all major USA states, but the pace of growth will vary based on demographic shifts, population migration patterns, and regional consumption preferences. Among the top five states analyzed, Georgia is expected to register the fastest compound annual growth rate (CAGR) of 2.70%, followed closely by Florida at 2.60%. This acceleration is underpinned by strong population inflows from other states, younger demographic composition, and expanding retail presence across suburban and urban areas. In both states, per capita consumption is projected to rise steadily, supported by increased disposable income and established snacking culture.
Texas and California are forecast to grow at CAGRs of 2.52% and 2.48% respectively over the same period. Both states maintain large population bases with diverse consumer segments driving consistent demand across allConvenience Confectionery categories. Texas benefits from continued population growth and strong family consumption patterns, while California shows sustained demand despite higher health consciousness, with premium and organicConvenience Confectionery options gaining traction.
New York, while maintaining significant absolute sales volumes, is expected to grow at a CAGR of 2.30%, reflecting a more mature consumer base and slower population growth. The state already exhibits well-established consumption patterns, with growth primarily driven by premiumization trends and seasonal purchasing rather than volume expansion.
These five states collectively represent approximately 35% of total USAConvenience Confectionery demand, highlighting the concentration of consumption in populous regions while also demonstrating the importance of demographic and economic factors in driving regional growth patterns.
The projected trajectory indicates a resilient sector with consistent demand drivers including seasonal consumption, gifting traditions, and impulse purchasing behavior. Annual variations reflect broader economic cycles, with higher growth during periods of increased consumer confidence and discretionary spending.
Convenience stores treat confectionery as a high-margin impulse category, yet sales momentum is under pressure from inflation, changing health attitudes, and rising cocoa costs. The leading manufacturers are responding on three vectors. First, they are refining price-pack architecture by pushing share packs and two-for-one deals to defend front-end basket size without provoking sticker shock.
Second, they are accelerating innovation in low- and no-sugar formulas, gummy texture formats, and limited-edition flavours to counter the calorie scrutiny amplified by GLP-1 weight-loss drugs. Third, they are strengthening retailer partnerships through data-backed merchandising plans that optimise SKU assortment for regional preferences and day-part traffic, locking in shelf and cooler space ahead of private labels.
Supply security is an equally intense battleground. Tight cocoa and gelatin markets are forcing firms to hedge raw materials more aggressively while streamlining ingredient lists to satisfy clean-label expectations. Consolidation among wholesalers means that national brands with direct-store delivery capabilities can outpace smaller rivals on in-stock rates and promotional execution. Winners will be those that can protect gross margin through sourcing discipline, sustain consumer excitement via flavour rotation, and demonstrate category stewardship to c-store operators who rely on confectionery to lift overall basket profitability.
| Attribute | Details |
|---|---|
| Study Coverage | USA sales and consumption of Convenience Confectionery products from 2025 to 2035 |
| Base Year | 2025 |
| Forecast Period | 2025 to 2035 |
| Units of Measurement | USD (sales), Metric Tonnes (volume), Kilograms per capita (consumption) |
| Geography Covered | All 50 USA states + Washington D.C.; state-level granularity |
| Top States Analyzed | Texas, California, Florida, New York, Georgia |
| By Product Format | Chocolate, Non-chocolate candy, Gum & mints |
| By Pack Type | Single-serve bars/packs, Peg/multipack bags, Seasonal/novelty |
| By Consumer Profile | Impulse purchasers, Gift buyers, Seasonal consumers, Health-conscious snackers , Premium enthusiasts |
| Metrics Provided | Sales (USD), Volume (MT), Per capita consumption (kg), CAGR (2025 to 2035), Share by segment |
| Price Analysis | Average unit prices by product format and region |
| Competitive Landscape | Company profiles, brand portfolios, distribution strategies, seasonal campaigns |
| Forecast Drivers | Per capita demand trends, demographic shifts, premiumization , seasonal patterns |
By 2035, total US sales of Convenience Confectionery products are projected to reach USD 21.9 billion, up from USD 17.1 billion in 2025, reflecting a CAGR of approximately 2.5%.
Chocolate products hold the leading share, accounting for approximately 50% of total sales by 2035, followed by non-chocolate candy at 42% and gum & mints at 8%.
Georgia and Florida lead in projected growth, registering CAGRs of 2.70% and 2.60% respectively between 2025 and 2035, due to population growth and demographic shifts.
Single-serve bars and packs are the dominant format (53% share by 2035), driven by impulse purchasing and convenience, followed by multipack bags at 34% share.
Major players include Mars Wrigley, Mondelez International, The Hershey Company, Ferrero, and Lindt & Sprüngli, with increasing focus on sustainability, premium positioning, and health-conscious formulations.


Our Research Products

The "Full Research Suite" delivers actionable market intel, deep dives on markets or technologies, so clients act faster, cut risk, and unlock growth.

The Leaderboard benchmarks and ranks top vendors, classifying them as Established Leaders, Leading Challengers, or Disruptors & Challengers.

Locates where complements amplify value and substitutes erode it, forecasting net impact by horizon

We deliver granular, decision-grade intel: market sizing, 5-year forecasts, pricing, adoption, usage, revenue, and operational KPIs—plus competitor tracking, regulation, and value chains—across 60 countries broadly.

Spot the shifts before they hit your P&L. We track inflection points, adoption curves, pricing moves, and ecosystem plays to show where demand is heading, why it is changing, and what to do next across high-growth markets and disruptive tech

Real-time reads of user behavior. We track shifting priorities, perceptions of today’s and next-gen services, and provider experience, then pace how fast tech moves from trial to adoption, blending buyer, consumer, and channel inputs with social signals (#WhySwitch, #UX).

Partner with our analyst team to build a custom report designed around your business priorities. From analysing market trends to assessing competitors or crafting bespoke datasets, we tailor insights to your needs.
Supplier Intelligence
Discovery & Profiling
Capacity & Footprint
Performance & Risk
Compliance & Governance
Commercial Readiness
Who Supplies Whom
Scorecards & Shortlists
Playbooks & Docs
Category Intelligence
Definition & Scope
Demand & Use Cases
Cost Drivers
Market Structure
Supply Chain Map
Trade & Policy
Operating Norms
Deliverables
Buyer Intelligence
Account Basics
Spend & Scope
Procurement Model
Vendor Requirements
Terms & Policies
Entry Strategy
Pain Points & Triggers
Outputs
Pricing Analysis
Benchmarks
Trends
Should-Cost
Indexation
Landed Cost
Commercial Terms
Deliverables
Brand Analysis
Positioning & Value Prop
Share & Presence
Customer Evidence
Go-to-Market
Digital & Reputation
Compliance & Trust
KPIs & Gaps
Outputs
Full Research Suite comprises of:
Market outlook & trends analysis
Interviews & case studies
Strategic recommendations
Vendor profiles & capabilities analysis
5-year forecasts
8 regions and 60+ country-level data splits
Market segment data splits
12 months of continuous data updates
DELIVERED AS:
PDF EXCEL ONLINE
Retail Paper Bag Market Size and Share Forecast Outlook 2025 to 2035
Retail Automation Market Size and Share Forecast Outlook 2025 to 2035
Retail Logistics Market Size and Share Forecast Outlook 2025 to 2035
Retail Displays Market Size and Share Forecast Outlook 2025 to 2035
Retail Colocation Market Size and Share Forecast Outlook 2025 to 2035
Retail Analytics Market Analysis by Solution, Function, Enterprise Size, Deployment Model, Field Crowdsourcing, and Region Through 2035
Examining Market Share Trends in the Retail Paper Bag Industry
Retail Signage Market
Retail Digital Signage Market
Retail Warehouse Management Systems Market Size and Share Forecast Outlook 2025 to 2035
India Retail Mineral Turpentine Oil Market Growth – Trends & Forecast 2024-2034
Retail Clinics Market Analysis – Size, Share, and Forecast Outlook 2025 to 2035
Retail Printers Market Growth - Trends & Forecast 2025 to 2035
Retail Printers and Consumables Market Growth - Trends & Forecast 2025 to 2035
Retail Vending Machine Market Analysis - Size, Share, and Forecast 2025 to 2035
Market Share Distribution Among Retail Vending Machine Suppliers
Retail Sourcing And Procurement Market Size and Share Forecast Outlook 2025 to 2035
Europe Retail Paper Bag Market Trends – Growth & Forecast 2023-2033
Retail Glass Packaging Market Size and Share Forecast Outlook 2025 to 2035
Market Share Distribution Among Retail Glass Packaging Companies

Thank you!
You will receive an email from our Business Development Manager. Please be sure to check your SPAM/JUNK folder too.
Chat With
MaRIA