Retail Paper Bag Market Size and Share Forecast Outlook 2025 to 2035

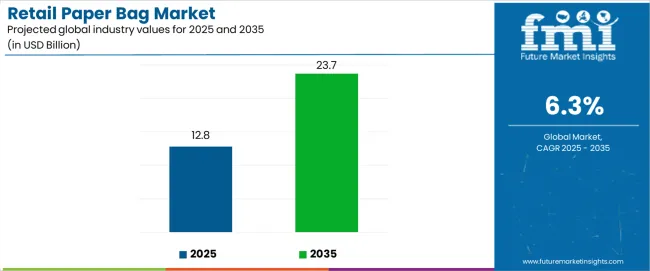
The retail paper bag market is projected to grow from USD 1.8 billion in 2025 to USD 2.8 billion by 2035, registering a CAGR of 4.3% during the forecast period. Sales in 2024 reached USD 1.7 billion, reflecting steady growth driven by increasing demand for sustainable and eco-friendly packaging solutions.

Quick Stats of Retail Paper Bag Market

  • Market Value (2025): USD 1.8 billion
  • Forecast Value (2035): USD 2.8 billion
  • Forecast CAGR: 4.3%
  • Material Leader in 2025: Kraft paper (51.6% market share)
  • Top End Use: Grocery and supermarket stores (43.8% share)
  • Key Growth Country: India (India is the fastest-growing market with 5.4% CAGR)

Retail Paper Bags Market   Industry Value Analysis

Metric Value
Industry Size (2025E) USD 1.8 billion
Industry Value (2035F) USD 2.8 billion
CAGR (2025 to 2035) 4.3%

This growth is attributed to the rising environmental concerns, government regulations banning single-use plastics, and the surge in e-commerce and retail sectors seeking biodegradable alternatives.

The market's expansion is further supported by innovations in paper bag designs and materials, enhancing their durability and appeal to both consumers and retailers.

In June 2025, Mondi, a global leader in sustainable packaging and paper, launched its re/cycle PaperPlus Bag Advanced, a high-performance paper bag designed to protect humidity-sensitive goods, while significantly reducing plastic content. PaperPlus Bag Advanced is a future-ready alternative for customers seeking to reduce plastic and meet performance demands without compromising on efficiency.

At Mondi, we are ready to support our customers, considering the environmental impacts of our products at each stage of the value chain. Following our own MAP2030 goals, we are working hard to offer solutions that contribute to a circular economy while being fully tailored to our customers’ needs said, Max Melzer, Head of External Sales Industrial Bags at Mondi

Manufacturers of paper bags are focusing on producing biodegradable and recyclable bags. Innovations include the development of water-resistant coatings and the use of soy-based inks for printing, enhancing the environmental friendliness of paper bags.

Additionally, advancements in manufacturing technologies are improving the strength and durability of paper bags, making them suitable for a wider range of products. These innovations are aligning with consumer preferences for sustainable packaging and are expected to propel market growth in the coming years.

The retail paper bag market is poised for significant growth, driven by increasing environmental awareness, regulatory support, and consumer demand for sustainable packaging. Companies investing in innovative, eco-friendly solutions are expected to gain a competitive edge.

The market's expansion is further supported by the growing e-commerce sector and the shift towards plastic-free packaging. With continuous advancements in materials and manufacturing processes, the retail paper bag market is set to offer lucrative opportunities for stakeholders over the forecast period.

Semi Annual Market Update

The below table presents the expected CAGR for the global retail paper bag market over several semi-annual periods spanning from 2024 to 2034.

Particular Value CAGR
H1 (2024 to 2034) 4.0%
H2 (2024 to 2034) 4.6%
H1 (2025 to 2035) 3.6%
H2 (2025 to 2035) 5.0%

In the first half (H1) of the decade from 2024 to 2034, the business is predicted to surge at a CAGR of 4.0%, followed by a slightly lower growth rate of 4.6% in the second half (H2) of the same decade. Moving into the subsequent period, from H1 2025 to H2 2035, the CAGR is projected to decrease slightly to 3.6% in the first half and remain relatively moderate at 5% in the second half. In the first half (H1) the market witnessed a decrease of 40 BPS while in the second half (H2), the market witnessed an increase of 40 BPS.

Analyzing Retail Paper Bag Market by Top Investment Segments

The market is segmented based on material type, end-use industry, thickness (GSM), and region. By material type, the market comprises kraft paper, recycled paper, coated paper, and specialty paper. In terms of end-use industry, the market is categorized into grocery & supermarket, foodservice & QSR, fashion & apparel, electronics & appliances, healthcare & pharmacy, gifts & novelties, and homecare & lifestyle retail.

Based on thickness, the market is segmented into below 80 GSM, 80-120 GSM, and above 120 GSM. Regionally, the market is analyzed across North America, Latin America, East Asia, South Asia & Pacific, Eastern Europe, Western Europe, Oceania, and the Middle East & Africa.

Retail Paper Bags Market   Analysis By Thickness (GSM)

Kraft Paper Preferred for Structural Strength and Brand Customization

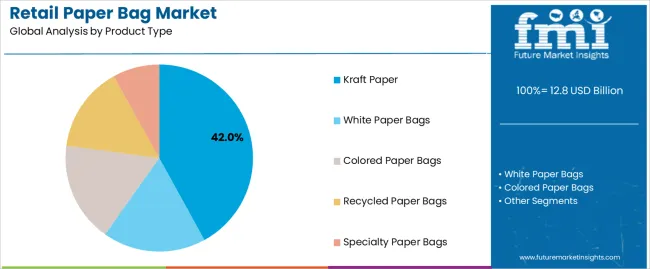
Kraft paper has been estimated to account for 51.6% of the retail paper bag market by 2025, supported by its superior tensile strength, tear resistance, and compatibility with a wide range of retail packaging formats. Both virgin and recycled kraft variants have been extensively used across carryout and promotional bags due to their cost efficiency and availability in both bleached and natural brown finishes.

Printability on kraft paper using water- and soy-based inks has been optimized for branded communication and eco-positioning. Mechanical durability under high-volume retail use has been enhanced through multi-ply construction, reinforced handles, and gusseted bases. These improvements have allowed kraft bags to substitute plastic counterparts in medium- and heavy-load categories.

Major retailers and supermarket chains have transitioned toward kraft paper bags, supported by bulk procurement advantages and reduced environmental taxation. Regulatory bans on plastic in major urban markets have further driven demand for kraft-based formats, which align with both recyclability and composability norms.

Reinvestment in kraft paper mills and new FSC-certified sourcing programs have been announced to meet rising retail bag requirements. This shift has been reinforced by consumer expectations for sustainability in carry-home packaging and compliance with emerging packaging directives in the EU, North America, and parts of Asia.

Retail Paper Bags Market   Analysis By Material Type

Grocery & Supermarket Channels Lead in High-Volume Paper Bag Adoption

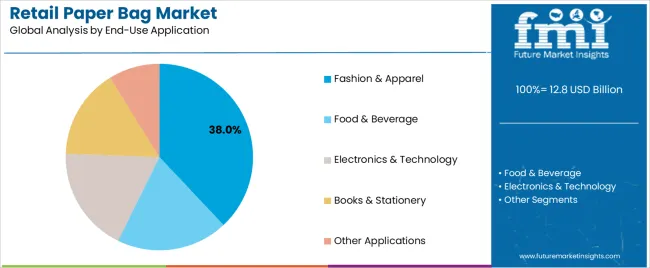
Grocery and supermarket stores have been projected to hold 43.8% of the retail paper bag market by 2025, driven by the frequent need for bulk packaging and regulatory mandates banning plastic alternatives. Paper bags have been widely adopted at checkout counters, self-bagging stations, and home delivery segments across regional and national grocery chains.

Functional performance under moisture, weight, and variable handling conditions has been addressed through reinforced bottom seals, anti-wicking coatings, and dual-handle formats. Custom-printed designs and barcoded variants have enabled ease of scanning and store branding, while grease-resistant liners have been added for fresh and frozen food applications.

Transition from single-use plastic has been mandated in several states and cities, prompting large-format retailers and food cooperatives to deploy kraft and recycled paper bag programs. These shifts have been supported by customer loyalty incentives and store-level sustainability audits.

Retail bag policies favoring biodegradable and recyclable formats have resulted in significant bulk-order contracts with paper converters. Regional paper mills have expanded output capacity specifically for grocery retail clients, aligning with operational scale, short lead times, and circular economy targets.

Retail Paper Bags Market   Analysis By End Use

Key Industry Highlights

Demand is rising for green and sustainable packaging

Companies worldwide are yielding to an existing environmental care; therefore, a vicious push is constructed mainly by the plastic bag of economy to companies which are required to speed up developing green packaging materials such as paper shopping bags.

At the moment, with the increased focus on plastic contamination and waste dumping, it has resulted in numerous nations applying strict policies on single-use plastic and pushes the retailers towards the path of biodegradable forms, such as paper bags.

Retail brands, the household names, and internet-based companies are speeding up paper-based packaging substitution to appease customers, according to civic demands, and affirm the company's sustainability initiatives favorably. This also means that green-conscious consumers need companies that stick to green packaging procedure, which again compels companies to utilize these bags as a part of their branding and marketing strategies.

bags are considered an asset for brand value by most industries; they are easily printable with their logos and designs, or as ecological statements bags. The international retail market for paper bags is experiencing a speedy growth because of the constantly growing impact of sustainability on consumer trends.

Expansion of Retail and E-Commerce Sectors

The retail outlets, supermarkets, high-end boutiques, and e-commerce websites are growing at an unprecedented scale; therefore, the retail paper bag market is getting a helping hand. Current situation of increasing urbanization, disposable income, and shopping habits of today, it is evident that enormous spending on large fashion segments, grocery, electronics, and lifestyle items has to translate into higher demand for premium and aesthetically attractive packaging.

Within the fashion or clothing segment, department stores, organic food stalls, paper bags are becoming a symbol of premium looks and eco-friendliness. Most of the online shops have already resorted to paper packaging and recycled cartons in order to satisfy environmental standards and appeal to green consumers.

Furthermore, paper-based packaging has infiltrated leading online shopping platforms and institutional food delivery services road mapping the way towards a sustainable packaging mode. Along with additional growth in the world retail market, to maintain the new influence, the demand for paper bags of branded and quality type shall mercilessly increase.

High Cost and Supply Chain Restriction

A stark market issue confronting the growing retail paper bag market is the high cost compared to plastic bags. It calls for increased costs of raw material procurement, significant energy use, and water usage, thereby rendering paper bags expensive. Wood pulp price fluctuations and significant supply chain interruptions because of factors like inconstancy of high-quality paper raw materials availability can result in cost instability and interfere with retail paper bag demand.

Paper bags lack the strength plastic bags possess and thus are easy to tear when carrying heavy loads. This issue has especially raised concerns about a potential loss of functionality and being cost-ineffective for small enterprises that might not have a large customer base to finance medium and larger-quantity paper bag production.

Country-wise Insights

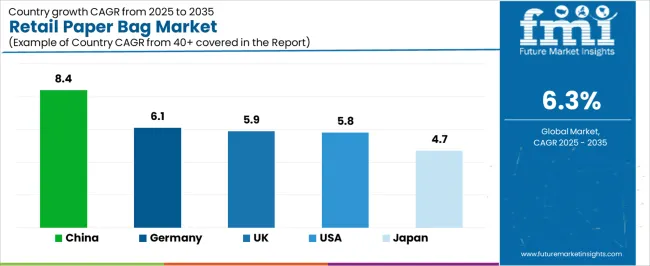
The section below covers the future forecast for the retail paper bag marketin terms of countries. Information on key countries in several parts of the globe, including North America, Latin America, East Asia, South Asia and Pacific, Western Europe, Eastern Europe and MEA is provided. USA is expected to account for a CAGR of 3.2% through 2035. In Europe, Spainis projected to witness a CAGR of 3.9% by 2035.

Countries Value CAGR (2025 to 2035)
USA 3.2%
Germany 2.8%
China 5.2%
UK 2.7%
Spain 3.9%
India 5.4%
Canada 3.0%

USA Market Driver: Government Regulations on Plastic Bans

In the United States, strict state-level regulations on single-use plastics are strongly driving retail paper bag use. Various states such as California, New York, and New Jersey have prohibited plastic bags to reduce plastic pollution, thus compelling retailers to adopt paper-based alternatives. Most local governments impose charges for plastic bag usage to make consumers opt for reusable or biodegradable paper bags.

Therefore, the USA Green packaging initiatives of the Environmental Protection Agency (EPA) and corporate sustainability programs of the big retailers encourage the utilization of green packaging. The big supermarket chains have now made the transition to paper bags that are recyclable to adhere to government regulations and customer demand.

Plastic substitution by paper bags in the retail industry will thus be further enhanced by growing awareness among the public and government support, which will in turn enhance market growth in the coming years.

UK Market Driver: Strong Corporate Sustainability Goals and Eco-Branding

Corporate sustainability goals and green branding drive army the retail paper bag market in the UK. A vast majority of the UK-based retailers and supermarket brands such as Tesco, Sainsbury's, and Marks & Spencer also have some grave sustainability targets in place to reduce their carbon footprint on the planet.

Thus, the British government has imposed stiff levies on plastic bags and even hard-line rules on single-use plastic packaging, which compelled business houses to switch to the paper route. UK shoppers also care about the environment and wish to identify with brands that promote sustainability and ethical sourcing.

They now use quality paper bags with custom designs to present that image directed at green consumers. Growing demand for recyclable and biodegradable packaging and business sustainability objectives are now likely to witness the retail paper bag industry in the UK record high growth in the near future.

Competitive Outlook

The Retail Paper Bag Market is witnessing significant growth due to the global push for sustainable and eco-friendly packaging solutions. Governments worldwide are imposing strict regulations on plastic bags, leading to increased adoption of paper bags in retail, food service, and grocery sectors. Rising consumer awareness regarding environmental sustainability, coupled with the shift toward biodegradable and recyclable materials, is fueling market expansion.

Retailers are investing in customized and branded paper bags to enhance brand visibility and customer engagement. The demand for durable, reusable, and recyclable paper bags is particularly strong in luxury retail, fashion, foodservice, and supermarkets. However, challenges such as higher production costs compared to plastic bags, limited water resistance, and supply chain disruptions affecting raw materials could hinder market growth.

Key Developments in Retail Paper Bag Market

  • In June 2024, Mondi Group introduced an expanded range of paper-based MailerBAGs designed to replace plastic packaging in e-commerce. These bags are made from responsibly sourced renewable materials, offering an eco-friendly alternative for online retailers.
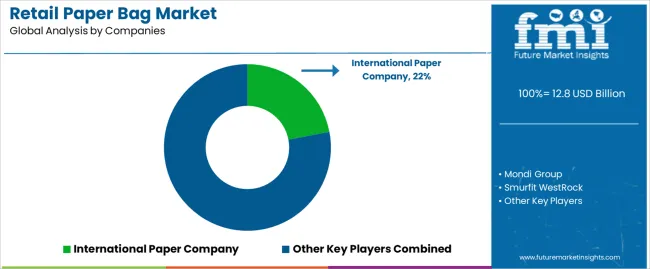
  • ​ In October 2024, International Paper acquired UK-based DS Smith for USD 7.2 billion. This merger positions International Paper as one of the largest paper packaging companies globally, enhancing its capabilities in producing paper bags and other packaging solutions.

Retail Paper Bags Market   Analysis By Company

Key Players in Retail Paper Bag Market

  • Hood Packaging Corporation Paper Sacks Factory
  • Novolex
  • United Bags, Inc.
  • Holmen Group
  • Georgia-Pacific LLC
  • OJI Holding Corporation
  • WestRock Company
  • DS Smith Plc
  • Ronpak
  • B&H Bag Company
  • Smurfit Kappa Group PLC
  • International Paper Company
  • Hotpack Packaging Industries LLC
  • National Paper Products Company.

Report Scope Table - Retail Paper Bag Market

Report Attributes Details
Current Total Market Size (2025) USD 1,877.4 million
Projected Market Size (2035) USD 2,860.2 million
CAGR (2025 to 2035) 4.3%
Base Year for Estimation 2024
Historical Period 2020 to 2024
Projections Period 2025 to 2035
Quantitative Units USD million for value and million units for volume
Product Types Analyzed (Segment 1) Sewn Open Mouth, Pinched Bottom Open Mouth, Pasted Valve, Pasted Open Mouth, Flat Bottom, Others
Material Types Analyzed (Segment 2) Brown Kraft Paper, White Kraft Paper
Thickness Types Analyzed (Segment 3) 1 Ply, 2 Ply, 3 Ply, More Than 3 Ply
End Use Industries Analyzed (Segment 4) Food and Beverages, Pharmaceuticals, Apparel, Consumer Electronics, Construction, Others
Regions Covered North America; Latin America; Western Europe; Eastern Europe; South Asia and Pacific; East Asia; Middle East & Africa
Countries Covered United States, Canada, Mexico, Brazil, Argentina, Germany, France, United Kingdom, Italy, Spain, Netherlands, China, India, Japan, South Korea, ANZ, GCC Countries, South Africa
Key Players influencing the Retail Paper Bag Market Hood Packaging Corporation, Paper Sacks Factory, Novolex, United Bags, Inc., Holmen Group, Georgia-Pacific LLC, OJI Holding Corporation, WestRock Company, DS Smith Plc, Ronpak, B&H Bag Company, Smurfit Kappa Group PLC, International Paper Company, Hotpack Packaging Industries LLC, National Paper Products Company
Additional Attributes Dollar sales by product type (flat bottom, pasted valve), Dollar sales by material type (brown kraft, white kraft), Sustainability trends in paper packaging, Growth of food and fashion retail sectors, Regulatory mandates for plastic alternatives, Regional demand in environmentally-conscious retail practices
Customization and Pricing Customization and Pricing Available on Request

Key Segmentation

By Material Type:

  • Kraft Paper
  • Recycled Paper
  • Coated Paper
  • Specialty Paper

By End-Use Industry:

  • Grocery & Supermarket
  • Foodservice & QSR
  • Fashion & Apparel
  • Electronics & Appliances
  • Healthcare & Pharmacy
  • Gifts & Novelties
  • Homecare & Lifestyle Retail

By Thickness (GSM):

  • Below 80 GSM
  • 80-120 GSM
  • Above 120 GSM

By Region:

  • North America
  • Latin America
  • East Asia
  • South Asia & Pacific
  • Eastern Europe
  • Western Europe
  • Oceania
  • Middle East & Africa

Table of Content

  1. Executive Summary
    • Global Market Outlook
    • Demand-side Trends
    • Supply-side Trends
    • Technology Roadmap Analysis
    • Analysis and Recommendations
  2. Market Overview
    • Market Coverage / Taxonomy
    • Market Definition / Scope / Limitations
  3. Market Background
    • Market Dynamics
      • Drivers
      • Restraints
      • Opportunity
      • Trends
    • Scenario Forecast
      • Demand in Optimistic Scenario
      • Demand in Likely Scenario
      • Demand in Conservative Scenario
    • Opportunity Map Analysis
    • Product Life Cycle Analysis
    • Supply Chain Analysis
      • Supply Side Participants and their Roles
        • Producers
        • Mid-Level Participants (Traders/ Agents/ Brokers)
        • Wholesalers and Distributors
      • Value Added and Value Created at Node in the Supply Chain
      • List of Raw Material Suppliers
      • List of Existing and Potential Buyer’s
    • Investment Feasibility Matrix
    • Value Chain Analysis
      • Profit Margin Analysis
      • Wholesalers and Distributors
      • Retailers
    • PESTLE and Porter’s Analysis
    • Regulatory Landscape
      • By Key Regions
      • By Key Countries
    • Regional Parent Market Outlook
    • Production and Consumption Statistics
    • Import and Export Statistics
  4. Global Market Analysis 2020-2024 and Forecast, 2025-2035
    • Historical Market Size Value (USD Million) & Volume (Units) Analysis, 2020-2024
    • Current and Future Market Size Value (USD Million) & Volume (Units) Projections, 2025-2035
      • Y-o-Y Growth Trend Analysis
      • Absolute $ Opportunity Analysis
  5. Global Market Analysis 2020-2024 and Forecast 2025-2035, By Material
    • Introduction / Key Findings
    • Historical Market Size Value (USD Million) & Volume (Units) Analysis By Material
    • Current and Future Market Size Value (USD Million) & Volume (Units) Analysis and Forecast By Material
      • Kraft Paper
      • Recycled Paper
      • Coated Paper
      • Specialty Paper
    • Y-o-Y Growth Trend Analysis By Material, 2020-2024
    • Absolute $ Opportunity Analysis By Material, 2025-2035
  6. Global Market Analysis 2020-2024 and Forecast 2025-2035, By Application
    • Introduction / Key Findings
    • Historical Market Size Value (USD Million) & Volume (Units) Analysis By Application , 2020-2024
    • Current and Future Market Size Value (USD Million) & Volume (Units) Analysis and Forecast By Application, 2025-2035
      • Grocery & Supermarket
      • Foodservice & QSR
      • Fashion & Apparel
      • Electronics & Appliances
      • Healthcare & Pharmacy
      • Gifts & Novelties
      • Homecare & Lifestyle Retail
    • Y-o-Y Growth Trend Analysis By Application , 2020-2024
    • Absolute $ Opportunity Analysis By Application , 2025-2035
  7. Global Market Analysis 2020-2024 and Forecast 2025-2035, By Thickness
  8. 7.2. Historical Market Size Value (USD Million) & Volume (Units) Analysis By Thickness 2020-2024
  9. 7.3. Current and Future Market Size Value (USD Million) & Volume (Units) Analysis and Forecast By Thickness, 2025-2035
  10. 7.3.1. Below 80 GSM
  11. 7.3.2. 80-120 GSM
  12. 7.3.3. Above 120 GSM
  13. 7.4. Y-o-Y Growth Trend Analysis By Thickness, 2020-2024
  14. 7.5. Absolute $ Opportunity Analysis By Thickness, 2025-2035
  15. Global Market Analysis 2020-2024 and Forecast 2025-2035, By Region
    • Introduction
    • Historical Market Size Value (USD Million) & Volume (Units) Analysis By Region, 2020-2024
    • Current Market Size Value (USD Million) & Volume (Units) Analysis and Forecast By Region, 2025-2035
      • North America
      • Latin America
      • Europe
      • East Asia
      • South Asia
      • Oceania
      • MEA
    • Market Attractiveness Analysis By Region
  16. North America Market Analysis 2020-2024 and Forecast 2025-2035, By Country
    • Historical Market Size Value (USD Million) & Volume (Units) Trend Analysis By Market Taxonomy, 2020-2024
    • Market Size Value (USD Million) & Volume (Units) Forecast By Market Taxonomy, 2025-2035
      • By Country
        • USA
        • Canada
      • By Material
      • By Application
      • By Thickness
    • Market Attractiveness Analysis
      • By Country
      • By Material
      • By Application
      • By Thickness
    • Key Takeaways
  17. Latin America Market Analysis 2020-2024 and Forecast 2025-2035, By Country
    • Historical Market Size Value (USD Million) & Volume (Units) Trend Analysis By Market Taxonomy, 2020-2024
    • Market Size Value (USD Million) & Volume (Units) Forecast By Market Taxonomy, 2025-2035
      • By Country
        • Brazil
        • Mexico
        • Argentina
        • Chile
        • Peru
        • Rest of Latin America
      • By Material
      • By Application
      • By Thickness
    • Market Attractiveness Analysis
      • By Country
      • By Material
      • By Application
      • By Thickness
    • Key Takeaways
  18. Europe Market Analysis 2020-2024 and Forecast 2025-2035, By Country
    • Historical Market Size Value (USD Million) & Volume (Units) Trend Analysis By Market Taxonomy, 2020-2024
    • Market Size Value (USD Million) & Volume (Units) Forecast By Market Taxonomy, 2025-2035
      • By Country
        • Germany
        • Italy
        • France
        • UK
        • Spain
        • Russia
        • BENELUX
        • Rest of Europe
      • By Material
      • By Application
      • By Thickness
    • Market Attractiveness Analysis
      • By Country
      • By Material
      • By Application
      • By Thickness
    • Key Takeaways
  19. East Asia Market Analysis 2020-2024 and Forecast 2025-2035, By Country
    • Historical Market Size Value (USD Million) & Volume (Units) Trend Analysis By Market Taxonomy, 2020-2024
    • Market Size Value (USD Million) & Volume (Units) Forecast By Market Taxonomy, 2025-2035
      • By Country
        • China
        • Japan
        • South Korea
      • By Material
      • By Application
      • By Thickness
    • Market Attractiveness Analysis
      • By Country
      • By Material
      • By Application
      • By Thickness
    • Key Takeaways
  20. South Asia Market Analysis 2020-2024 and Forecast 2025-2035, By Country
    • Historical Market Size Value (USD Million) & Volume (Units) Trend Analysis By Market Taxonomy, 2020-2024
    • Market Size Value (USD Million) & Volume (Units) Forecast By Market Taxonomy, 2025-2035
      • By Country
        • India
        • Thailand
        • Malaysia
        • Indonesia
        • Rest of South Asia
      • By Material
      • By Application
      • By Thickness
    • Market Attractiveness Analysis
      • By Country
      • By Material
      • By Application
      • By Thickness
    • Key Takeaways
  21. Oceania Market Analysis 2020-2024 and Forecast 2025-2035, By Country
    • Historical Market Size Value (USD Million) & Volume (Units) Trend Analysis By Market Taxonomy, 2020-2024
    • Market Size Value (USD Million) & Volume (Units) Forecast By Market Taxonomy, 2025-2035
      • By Country
        • Australia
        • New Zealand
      • By Material
      • By Application
      • By Thickness
    • Market Attractiveness Analysis
      • By Country
      • By Material
      • By Application
      • By Thickness
    • Key Takeaways
  22. MEA Market Analysis 2020-2024 and Forecast 2025-2035, By Country
    • Historical Market Size Value (USD Million) & Volume (Units) Trend Analysis By Market Taxonomy, 2020-2024
    • Market Size Value (USD Million) & Volume (Units) Forecast By Market Taxonomy, 2025-2035
      • By Country
        • GCC
        • Rest of MEA
      • By Material
      • By Application
      • By Thickness
    • Market Attractiveness Analysis
      • By Country
      • By Material
      • By Application
      • By Thickness
    • Key Takeaways
  23. Key Countries Market Analysis
    • USA
      • Pricing Analysis
      • Market Share Analysis, 2024
        • By Material
        • By Application
        • By Thickness
    • Canada
      • Pricing Analysis
      • Market Share Analysis, 2024
        • By Material
        • By Application
        • By Thickness
    • Brazil
      • Pricing Analysis
      • Market Share Analysis, 2024
        • By Material
        • By Application
        • By Thickness
    • Mexico
      • Pricing Analysis
      • Market Share Analysis, 2024
        • By Material
        • By Application
        • By Thickness
    • Argentina
      • Pricing Analysis
      • Market Share Analysis, 2024
        • By Material
        • By Application
        • By Thickness
  24. Market Structure Analysis
    • Competition Dashboard
    • Competition Benchmarking
    • Market Share Analysis of Top Players
      • By Regional
      • By Material
      • By Application
      • By Thickness
  25. Competition Analysis
    • Competition Deep Dive
      • Hood Packaging Corporation Paper Sacks Factory
        • Overview
        • Product Portfolio
        • Profitability by Market Segments (Product/Age /Sales Channel/Region)
        • Sales Footprint
        • Strategy Overview
          • Marketing Strategy
          • Product Strategy
          • Channel Strategy
      • Novolex
        • Overview
        • Product Portfolio
        • Profitability by Market Segments (Product/Age /Sales Channel/Region)
        • Sales Footprint
        • Strategy Overview
          • Marketing Strategy
          • Product Strategy
          • Channel Strategy
      • Value Bags, Inc.
        • Overview
        • Product Portfolio
        • Profitability by Market Segments (Product/Age /Sales Channel/Region)
        • Sales Footprint
        • Strategy Overview
          • Marketing Strategy
          • Product Strategy
          • Channel Strategy
      • Holmen Group
        • Overview
        • Product Portfolio
        • Profitability by Market Segments (Product/Age /Sales Channel/Region)
        • Sales Footprint
        • Strategy Overview
          • Marketing Strategy
          • Product Strategy
          • Channel Strategy
      • Georgia-Pacific LLC
        • Overview
        • Product Portfolio
        • Profitability by Market Segments (Product/Age /Sales Channel/Region)
        • Sales Footprint
        • Strategy Overview
          • Marketing Strategy
          • Product Strategy
          • Channel Strategy
      • OJI Holding Corporation
        • Overview
        • Product Portfolio
        • Profitability by Market Segments (Product/Age /Sales Channel/Region)
        • Sales Footprint
        • Strategy Overview
          • Marketing Strategy
          • Product Strategy
          • Channel Strategy
      • WestRock Company
        • Overview
        • Product Portfolio
        • Profitability by Market Segments (Product/Age /Sales Channel/Region)
        • Sales Footprint
        • Strategy Overview
          • Marketing Strategy
          • Product Strategy
          • Channel Strategy
      • DS Smith Plc
        • Overview
        • Product Portfolio
        • Profitability by Market Segments (Product/Age /Sales Channel/Region)
        • Sales Footprint
        • Strategy Overview
          • Marketing Strategy
          • Product Strategy
          • Channel Strategy
      • Ronpak
        • Overview
        • Product Portfolio
        • Profitability by Market Segments (Product/Age /Sales Channel/Region)
        • Sales Footprint
        • Strategy Overview
          • Marketing Strategy
          • Product Strategy
          • Channel Strategy
      • B&H Bag Company
        • Overview
        • Product Portfolio
        • Profitability by Market Segments (Product/Age /Sales Channel/Region)
        • Sales Footprint
        • Strategy Overview
          • Marketing Strategy
          • Product Strategy
          • Channel Strategy
  26. Assumptions & Acronyms Used
  27. Research Methodology

List of Tables

  • Table 1: Global Market Value (USD Million) Forecast by Region, 2020-2035
  • Table 2: Global Market Volume (Units) Forecast by Region, 2020-2035
  • Table 3: Global Market Value (USD Million) Forecast By Material, 2020-2035
  • Table 4: Global Market Volume (Units) Forecast By Material, 2020-2035
  • Table 5: Global Market Value (USD Million) Forecast by Application , 2020-2035
  • Table 6: Global Market Volume (Units) Forecast by Application , 2020-2035
  • Table 7: Global Market Value (USD Million) Forecast by Thickness, 2020-2035
  • Table 8: Global Market Volume (Units) Forecast by Thickness, 2020-2035
  • Table 9: North America Market Value (USD Million) Forecast by Country, 2020-2035
  • Table 10: North America Market Volume (Units) Forecast by Country, 2020-2035
  • Table 11: North America Market Value (USD Million) Forecast By Material, 2020-2035
  • Table 12: North America Market Volume (Units) Forecast By Material, 2020-2035
  • Table 13: North America Market Value (USD Million) Forecast by Application , 2020-2035
  • Table 14: North America Market Volume (Units) Forecast by Application , 2020-2035
  • Table 15: North America Market Value (USD Million) Forecast by Thickness, 2020-2035
  • Table 16: North America Market Volume (Units) Forecast by Thickness, 2020-2035
  • Table 17: Latin America Market Value (USD Million) Forecast by Country, 2020-2035
  • Table 18: Latin America Market Volume (Units) Forecast by Country, 2020-2035
  • Table 19: Latin America Market Value (USD Million) Forecast By Material, 2020-2035
  • Table 20: Latin America Market Volume (Units) Forecast By Material, 2020-2035
  • Table 21: Latin America Market Value (USD Million) Forecast by Application , 2020-2035
  • Table 22: Latin America Market Volume (Units) Forecast by Application , 2020-2035
  • Table 23: Latin America Market Value (USD Million) Forecast by Thickness, 2020-2035
  • Table 24: Latin America Market Volume (Units) Forecast by Thickness, 2020-2035
  • Table 25: Europe Market Value (USD Million) Forecast by Country, 2020-2035
  • Table 26: Europe Market Volume (Units) Forecast by Country, 2020-2035
  • Table 27: Europe Market Value (USD Million) Forecast By Material, 2020-2035
  • Table 28: Europe Market Volume (Units) Forecast By Material, 2020-2035
  • Table 29: Europe Market Value (USD Million) Forecast by Application , 2020-2035
  • Table 30: Europe Market Volume (Units) Forecast by Application , 2020-2035
  • Table 31: Europe Market Value (USD Million) Forecast by Thickness, 2020-2035
  • Table 32: Europe Market Volume (Units) Forecast by Thickness, 2020-2035
  • Table 33: East Asia Market Value (USD Million) Forecast by Country, 2020-2035
  • Table 34: East Asia Market Volume (Units) Forecast by Country, 2020-2035
  • Table 35: East Asia Market Value (USD Million) Forecast By Material, 2020-2035
  • Table 36: East Asia Market Volume (Units) Forecast By Material, 2020-2035
  • Table 37: East Asia Market Value (USD Million) Forecast by Application , 2020-2035
  • Table 38: East Asia Market Volume (Units) Forecast by Application , 2020-2035
  • Table 39: East Asia Market Value (USD Million) Forecast by Thickness, 2020-2035
  • Table 40: East Asia Market Volume (Units) Forecast by Thickness, 2020-2035
  • Table 41: South Asia Market Value (USD Million) Forecast by Country, 2020-2035
  • Table 42: South Asia Market Volume (Units) Forecast by Country, 2020-2035
  • Table 43: South Asia Market Value (USD Million) Forecast By Material, 2020-2035
  • Table 44: South Asia Market Volume (Units) Forecast By Material, 2020-2035
  • Table 45: South Asia Market Value (USD Million) Forecast by Application , 2020-2035
  • Table 46: South Asia Market Volume (Units) Forecast by Application , 2020-2035
  • Table 47: South Asia Market Value (USD Million) Forecast by Thickness, 2020-2035
  • Table 48: South Asia Market Volume (Units) Forecast by Thickness, 2020-2035
  • Table 49: Oceania Market Value (USD Million) Forecast by Country, 2020-2035
  • Table 50: Oceania Market Volume (Units) Forecast by Country, 2020-2035
  • Table 51: Oceania Market Value (USD Million) Forecast By Material, 2020-2035
  • Table 52: Oceania Market Volume (Units) Forecast By Material, 2020-2035
  • Table 53: Oceania Market Value (USD Million) Forecast by Application , 2020-2035
  • Table 54: Oceania Market Volume (Units) Forecast by Application , 2020-2035
  • Table 55: Oceania Market Value (USD Million) Forecast by Thickness, 2020-2035
  • Table 56: Oceania Market Volume (Units) Forecast by Thickness, 2020-2035
  • Table 57: MEA Market Value (USD Million) Forecast by Country, 2020-2035
  • Table 58: MEA Market Volume (Units) Forecast by Country, 2020-2035
  • Table 59: MEA Market Value (USD Million) Forecast By Material, 2020-2035
  • Table 60: MEA Market Volume (Units) Forecast By Material, 2020-2035
  • Table 61: MEA Market Value (USD Million) Forecast by Application , 2020-2035
  • Table 62: MEA Market Volume (Units) Forecast by Application , 2020-2035
  • Table 63: MEA Market Value (USD Million) Forecast by Thickness, 2020-2035
  • Table 64: MEA Market Volume (Units) Forecast by Thickness, 2020-2035

List of Figures

  • Figure 1: Global Market Value (USD Million) By Material, 2025-2035
  • Figure 2: Global Market Value (USD Million) by Application , 2025-2035
  • Figure 3: Global Market Value (USD Million) by Thickness, 2025-2035
  • Figure 4: Global Market Value (USD Million) by Region, 2025-2035
  • Figure 5: Global Market Value (USD Million) Analysis by Region, 2020-2035
  • Figure 6: Global Market Volume (Units) Analysis by Region, 2020-2035
  • Figure 7: Global Market Value Share (%) and BPS Analysis by Region, 2025-2035
  • Figure 8: Global Market Y-o-Y Growth (%) Projections by Region, 2025-2035
  • Figure 9: Global Market Value (USD Million) Analysis By Material, 2020-2035
  • Figure 10: Global Market Volume (Units) Analysis By Material, 2020-2035
  • Figure 11: Global Market Value Share (%) and BPS Analysis By Material, 2025-2035
  • Figure 12: Global Market Y-o-Y Growth (%) Projections By Material, 2025-2035
  • Figure 13: Global Market Value (USD Million) Analysis by Application , 2020-2035
  • Figure 14: Global Market Volume (Units) Analysis by Application , 2020-2035
  • Figure 15: Global Market Value Share (%) and BPS Analysis by Application , 2025-2035
  • Figure 16: Global Market Y-o-Y Growth (%) Projections by Application , 2025-2035
  • Figure 17: Global Market Value (USD Million) Analysis by Thickness, 2020-2035
  • Figure 18: Global Market Volume (Units) Analysis by Thickness, 2020-2035
  • Figure 19: Global Market Value Share (%) and BPS Analysis by Thickness, 2025-2035
  • Figure 20: Global Market Y-o-Y Growth (%) Projections by Thickness, 2025-2035
  • Figure 21: Global Market Attractiveness By Material, 2025-2035
  • Figure 22: Global Market Attractiveness by Application , 2025-2035
  • Figure 23: Global Market Attractiveness by Thickness, 2025-2035
  • Figure 24: Global Market Attractiveness by Region, 2025-2035
  • Figure 25: North America Market Value (USD Million) By Material, 2025-2035
  • Figure 26: North America Market Value (USD Million) by Application , 2025-2035
  • Figure 27: North America Market Value (USD Million) by Thickness, 2025-2035
  • Figure 28: North America Market Value (USD Million) by Country, 2025-2035
  • Figure 29: North America Market Value (USD Million) Analysis by Country, 2020-2035
  • Figure 30: North America Market Volume (Units) Analysis by Country, 2020-2035
  • Figure 31: North America Market Value Share (%) and BPS Analysis by Country, 2025-2035
  • Figure 32: North America Market Y-o-Y Growth (%) Projections by Country, 2025-2035
  • Figure 33: North America Market Value (USD Million) Analysis By Material, 2020-2035
  • Figure 34: North America Market Volume (Units) Analysis By Material, 2020-2035
  • Figure 35: North America Market Value Share (%) and BPS Analysis By Material, 2025-2035
  • Figure 36: North America Market Y-o-Y Growth (%) Projections By Material, 2025-2035
  • Figure 37: North America Market Value (USD Million) Analysis by Application , 2020-2035
  • Figure 38: North America Market Volume (Units) Analysis by Application , 2020-2035
  • Figure 39: North America Market Value Share (%) and BPS Analysis by Application , 2025-2035
  • Figure 40: North America Market Y-o-Y Growth (%) Projections by Application , 2025-2035
  • Figure 41: North America Market Value (USD Million) Analysis by Thickness, 2020-2035
  • Figure 42: North America Market Volume (Units) Analysis by Thickness, 2020-2035
  • Figure 43: North America Market Value Share (%) and BPS Analysis by Thickness, 2025-2035
  • Figure 44: North America Market Y-o-Y Growth (%) Projections by Thickness, 2025-2035
  • Figure 45: North America Market Attractiveness By Material, 2025-2035
  • Figure 46: North America Market Attractiveness by Application , 2025-2035
  • Figure 47: North America Market Attractiveness by Thickness, 2025-2035
  • Figure 48: North America Market Attractiveness by Country, 2025-2035
  • Figure 49: Latin America Market Value (USD Million) By Material, 2025-2035
  • Figure 50: Latin America Market Value (USD Million) by Application , 2025-2035
  • Figure 51: Latin America Market Value (USD Million) by Thickness, 2025-2035
  • Figure 52: Latin America Market Value (USD Million) by Country, 2025-2035
  • Figure 53: Latin America Market Value (USD Million) Analysis by Country, 2020-2035
  • Figure 54: Latin America Market Volume (Units) Analysis by Country, 2020-2035
  • Figure 55: Latin America Market Value Share (%) and BPS Analysis by Country, 2025-2035
  • Figure 56: Latin America Market Y-o-Y Growth (%) Projections by Country, 2025-2035
  • Figure 57: Latin America Market Value (USD Million) Analysis By Material, 2020-2035
  • Figure 58: Latin America Market Volume (Units) Analysis By Material, 2020-2035
  • Figure 59: Latin America Market Value Share (%) and BPS Analysis By Material, 2025-2035
  • Figure 60: Latin America Market Y-o-Y Growth (%) Projections By Material, 2025-2035
  • Figure 61: Latin America Market Value (USD Million) Analysis by Application , 2020-2035
  • Figure 62: Latin America Market Volume (Units) Analysis by Application , 2020-2035
  • Figure 63: Latin America Market Value Share (%) and BPS Analysis by Application , 2025-2035
  • Figure 64: Latin America Market Y-o-Y Growth (%) Projections by Application , 2025-2035
  • Figure 65: Latin America Market Value (USD Million) Analysis by Thickness, 2020-2035
  • Figure 66: Latin America Market Volume (Units) Analysis by Thickness, 2020-2035
  • Figure 67: Latin America Market Value Share (%) and BPS Analysis by Thickness, 2025-2035
  • Figure 68: Latin America Market Y-o-Y Growth (%) Projections by Thickness, 2025-2035
  • Figure 69: Latin America Market Attractiveness By Material, 2025-2035
  • Figure 70: Latin America Market Attractiveness by Application , 2025-2035
  • Figure 71: Latin America Market Attractiveness by Thickness, 2025-2035
  • Figure 72: Latin America Market Attractiveness by Country, 2025-2035
  • Figure 73: Europe Market Value (USD Million) By Material, 2025-2035
  • Figure 74: Europe Market Value (USD Million) by Application , 2025-2035
  • Figure 75: Europe Market Value (USD Million) by Thickness, 2025-2035
  • Figure 76: Europe Market Value (USD Million) by Country, 2025-2035
  • Figure 77: Europe Market Value (USD Million) Analysis by Country, 2020-2035
  • Figure 78: Europe Market Volume (Units) Analysis by Country, 2020-2035
  • Figure 79: Europe Market Value Share (%) and BPS Analysis by Country, 2025-2035
  • Figure 80: Europe Market Y-o-Y Growth (%) Projections by Country, 2025-2035
  • Figure 81: Europe Market Value (USD Million) Analysis By Material, 2020-2035
  • Figure 82: Europe Market Volume (Units) Analysis By Material, 2020-2035
  • Figure 83: Europe Market Value Share (%) and BPS Analysis By Material, 2025-2035
  • Figure 84: Europe Market Y-o-Y Growth (%) Projections By Material, 2025-2035
  • Figure 85: Europe Market Value (USD Million) Analysis by Application , 2020-2035
  • Figure 86: Europe Market Volume (Units) Analysis by Application , 2020-2035
  • Figure 87: Europe Market Value Share (%) and BPS Analysis by Application , 2025-2035
  • Figure 88: Europe Market Y-o-Y Growth (%) Projections by Application , 2025-2035
  • Figure 89: Europe Market Value (USD Million) Analysis by Thickness, 2020-2035
  • Figure 90: Europe Market Volume (Units) Analysis by Thickness, 2020-2035
  • Figure 91: Europe Market Value Share (%) and BPS Analysis by Thickness, 2025-2035
  • Figure 92: Europe Market Y-o-Y Growth (%) Projections by Thickness, 2025-2035
  • Figure 93: Europe Market Attractiveness By Material, 2025-2035
  • Figure 94: Europe Market Attractiveness by Application , 2025-2035
  • Figure 95: Europe Market Attractiveness by Thickness, 2025-2035
  • Figure 96: Europe Market Attractiveness by Country, 2025-2035
  • Figure 97: East Asia Market Value (USD Million) By Material, 2025-2035
  • Figure 98: East Asia Market Value (USD Million) by Application , 2025-2035
  • Figure 99: East Asia Market Value (USD Million) by Thickness, 2025-2035
  • Figure 100: East Asia Market Value (USD Million) by Country, 2025-2035
  • Figure 101: East Asia Market Value (USD Million) Analysis by Country, 2020-2035
  • Figure 102: East Asia Market Volume (Units) Analysis by Country, 2020-2035
  • Figure 103: East Asia Market Value Share (%) and BPS Analysis by Country, 2025-2035
  • Figure 104: East Asia Market Y-o-Y Growth (%) Projections by Country, 2025-2035
  • Figure 105: East Asia Market Value (USD Million) Analysis By Material, 2020-2035
  • Figure 106: East Asia Market Volume (Units) Analysis By Material, 2020-2035
  • Figure 107: East Asia Market Value Share (%) and BPS Analysis By Material, 2025-2035
  • Figure 108: East Asia Market Y-o-Y Growth (%) Projections By Material, 2025-2035
  • Figure 109: East Asia Market Value (USD Million) Analysis by Application , 2020-2035
  • Figure 110: East Asia Market Volume (Units) Analysis by Application , 2020-2035
  • Figure 111: East Asia Market Value Share (%) and BPS Analysis by Application , 2025-2035
  • Figure 112: East Asia Market Y-o-Y Growth (%) Projections by Application , 2025-2035
  • Figure 113: East Asia Market Value (USD Million) Analysis by Thickness, 2020-2035
  • Figure 114: East Asia Market Volume (Units) Analysis by Thickness, 2020-2035
  • Figure 115: East Asia Market Value Share (%) and BPS Analysis by Thickness, 2025-2035
  • Figure 116: East Asia Market Y-o-Y Growth (%) Projections by Thickness, 2025-2035
  • Figure 117: East Asia Market Attractiveness By Material, 2025-2035
  • Figure 118: East Asia Market Attractiveness by Application , 2025-2035
  • Figure 119: East Asia Market Attractiveness by Thickness, 2025-2035
  • Figure 120: East Asia Market Attractiveness by Country, 2025-2035
  • Figure 121: South Asia Market Value (USD Million) By Material, 2025-2035
  • Figure 122: South Asia Market Value (USD Million) by Application , 2025-2035
  • Figure 123: South Asia Market Value (USD Million) by Thickness, 2025-2035
  • Figure 124: South Asia Market Value (USD Million) by Country, 2025-2035
  • Figure 125: South Asia Market Value (USD Million) Analysis by Country, 2020-2035
  • Figure 126: South Asia Market Volume (Units) Analysis by Country, 2020-2035
  • Figure 127: South Asia Market Value Share (%) and BPS Analysis by Country, 2025-2035
  • Figure 128: South Asia Market Y-o-Y Growth (%) Projections by Country, 2025-2035
  • Figure 129: South Asia Market Value (USD Million) Analysis By Material, 2020-2035
  • Figure 130: South Asia Market Volume (Units) Analysis By Material, 2020-2035
  • Figure 131: South Asia Market Value Share (%) and BPS Analysis By Material, 2025-2035
  • Figure 132: South Asia Market Y-o-Y Growth (%) Projections By Material, 2025-2035
  • Figure 133: South Asia Market Value (USD Million) Analysis by Application , 2020-2035
  • Figure 134: South Asia Market Volume (Units) Analysis by Application , 2020-2035
  • Figure 135: South Asia Market Value Share (%) and BPS Analysis by Application , 2025-2035
  • Figure 136: South Asia Market Y-o-Y Growth (%) Projections by Application , 2025-2035
  • Figure 137: South Asia Market Value (USD Million) Analysis by Thickness, 2020-2035
  • Figure 138: South Asia Market Volume (Units) Analysis by Thickness, 2020-2035
  • Figure 139: South Asia Market Value Share (%) and BPS Analysis by Thickness, 2025-2035
  • Figure 140: South Asia Market Y-o-Y Growth (%) Projections by Thickness, 2025-2035
  • Figure 141: South Asia Market Attractiveness By Material, 2025-2035
  • Figure 142: South Asia Market Attractiveness by Application , 2025-2035
  • Figure 143: South Asia Market Attractiveness by Thickness, 2025-2035
  • Figure 144: South Asia Market Attractiveness by Country, 2025-2035
  • Figure 145: Oceania Market Value (USD Million) By Material, 2025-2035
  • Figure 146: Oceania Market Value (USD Million) by Application , 2025-2035
  • Figure 147: Oceania Market Value (USD Million) by Thickness, 2025-2035
  • Figure 148: Oceania Market Value (USD Million) by Country, 2025-2035
  • Figure 149: Oceania Market Value (USD Million) Analysis by Country, 2020-2035
  • Figure 150: Oceania Market Volume (Units) Analysis by Country, 2020-2035
  • Figure 151: Oceania Market Value Share (%) and BPS Analysis by Country, 2025-2035
  • Figure 152: Oceania Market Y-o-Y Growth (%) Projections by Country, 2025-2035
  • Figure 153: Oceania Market Value (USD Million) Analysis By Material, 2020-2035
  • Figure 154: Oceania Market Volume (Units) Analysis By Material, 2020-2035
  • Figure 155: Oceania Market Value Share (%) and BPS Analysis By Material, 2025-2035
  • Figure 156: Oceania Market Y-o-Y Growth (%) Projections By Material, 2025-2035
  • Figure 157: Oceania Market Value (USD Million) Analysis by Application , 2020-2035
  • Figure 158: Oceania Market Volume (Units) Analysis by Application , 2020-2035
  • Figure 159: Oceania Market Value Share (%) and BPS Analysis by Application , 2025-2035
  • Figure 160: Oceania Market Y-o-Y Growth (%) Projections by Application , 2025-2035
  • Figure 161: Oceania Market Value (USD Million) Analysis by Thickness, 2020-2035
  • Figure 162: Oceania Market Volume (Units) Analysis by Thickness, 2020-2035
  • Figure 163: Oceania Market Value Share (%) and BPS Analysis by Thickness, 2025-2035
  • Figure 164: Oceania Market Y-o-Y Growth (%) Projections by Thickness, 2025-2035
  • Figure 165: Oceania Market Attractiveness By Material, 2025-2035
  • Figure 166: Oceania Market Attractiveness by Application , 2025-2035
  • Figure 167: Oceania Market Attractiveness by Thickness, 2025-2035
  • Figure 168: Oceania Market Attractiveness by Country, 2025-2035
  • Figure 169: MEA Market Value (USD Million) By Material, 2025-2035
  • Figure 170: MEA Market Value (USD Million) by Application , 2025-2035
  • Figure 171: MEA Market Value (USD Million) by Thickness, 2025-2035
  • Figure 172: MEA Market Value (USD Million) by Country, 2025-2035
  • Figure 173: MEA Market Value (USD Million) Analysis by Country, 2020-2035
  • Figure 174: MEA Market Volume (Units) Analysis by Country, 2020-2035
  • Figure 175: MEA Market Value Share (%) and BPS Analysis by Country, 2025-2035
  • Figure 176: MEA Market Y-o-Y Growth (%) Projections by Country, 2025-2035
  • Figure 177: MEA Market Value (USD Million) Analysis By Material, 2020-2035
  • Figure 178: MEA Market Volume (Units) Analysis By Material, 2020-2035
  • Figure 179: MEA Market Value Share (%) and BPS Analysis By Material, 2025-2035
  • Figure 180: MEA Market Y-o-Y Growth (%) Projections By Material, 2025-2035
  • Figure 181: MEA Market Value (USD Million) Analysis by Application , 2020-2035
  • Figure 182: MEA Market Volume (Units) Analysis by Application , 2020-2035
  • Figure 183: MEA Market Value Share (%) and BPS Analysis by Application , 2025-2035
  • Figure 184: MEA Market Y-o-Y Growth (%) Projections by Application , 2025-2035
  • Figure 185: MEA Market Value (USD Million) Analysis by Thickness, 2020-2035
  • Figure 186: MEA Market Volume (Units) Analysis by Thickness, 2020-2035
  • Figure 187: MEA Market Value Share (%) and BPS Analysis by Thickness, 2025-2035
  • Figure 188: MEA Market Y-o-Y Growth (%) Projections by Thickness, 2025-2035
  • Figure 189: MEA Market Attractiveness By Material, 2025-2035
  • Figure 190: MEA Market Attractiveness by Application , 2025-2035
  • Figure 191: MEA Market Attractiveness by Thickness, 2025-2035
  • Figure 192: MEA Market Attractiveness by Country, 2025-2035

Frequently Asked Questions

What is the future of global retail paper bag industry?

The global retail paper bag industry is projected to witness CAGR of 4.3% between 2025 and 2035.

What was the worth of the global retail paper bag industry in 2025?

The global retail paper bag industry stood at USD 1.8 billion in 2024.

What will the worth of global retail paper bag industry by 2035 end?

Global retail paper bag industry is anticipated to reach USD 2.8 billion by 2035 end.

Which region to showcase the highest CAGR during forecast period?

East Asia is set to record a CAGR of 5.4% in assessment period.

Who are the key players of global retail paper bag industry?

The key players operating in the global retail paper bag industry include International Paper Company, WestRock Company, OJI Holding Corporation, Smurfit Kappa Group PLC.

Explore Similar Insights

Future Market Insights

Retail Paper Bag Market